3556
Transcriptional signatures underpinnings of altered large-scale functional connectome hierarchy in patients with IBS1Second Clinical School, Lanzhou University, Lanzhou, China, 2Department of Magnetic Resonance, Lanzhou University Second Hospital, Lanzhou, China, 3Gansu Province Clinical Research Center for Functional and Molecular Imaging, Lanzhou University Second Hospital, Lanzhou, China, 4Department of clinical science, Philips Healthcare, Xi’an, China
Synopsis
Keywords: Gray Matter, fMRI (resting state)
Functional connectivity is altered in patients with irritable bowel syndrome (IBS), but its histological basis is unknown. We used resting-state fMRI imaging combined with transcriptomics to examine changes in functional connectivity gradients in IBS patients and their corresponding gene regulatory basis. The reduced connectivity gradients and contractions in IBS patients compared to healthy controls were mainly involved in primary sensory and cross-modal structural domains and were associated with aberrant expression of genes related to neurological development. These results reveal gradient dysfunction of large-scale functional connectomes in IBS and elucidate the role of abnormal gene-function connectivity in the disease.Introduction
Irritable bowel syndrome (IBS) is a functional gastrointestinal disorders (FGID) characterized by chronic recurrent abdominal pain [1-4]. About 5.8%~17.5% of people suffer from the disease in the world [5], which brings additional economic burden. Functional imaging studies mainly focused on the detection of the neurological characteristics of visceral pain and visceral hypersensitivity in the central nervous system (CNS) of patients with IBS [6]. Due to the lack of verifiable pathological abnormalities and reliable biomarkers, the current understanding of the pathogenesis of IBS is not satisfactory. We used rsfMR imaging to study the global large-scale extensive cortical functional connectivity gradient of 54 IBS patients and 40 age matched controls, combined with transcriptional data to: (1) determine the changes of functional network gradient in IBS patients; (2) Check whether these changes are related to the brain expression of IBS related genes.Materials and Methods
According to Rome IV diagnostic criteria, 54 IBS patients, and 40 healthy volunteers (HC) were recruited during the same period with approved by the Ethics Committee (shown as Table 1). Data were collected with Verio 3.0T MRI scanner (Siemens, Erlangen, Germany). rs-fMRI images were acquired using EPI sequence with the following parameters: repetition time/echo time = 2000/30 ms; field of view = 256 × 256 mm; matrix = 128 × 128; and 36 interleaved axial slices with 3 mm thickness. We used fMRIPrep (https://fmriprep.readthedocs.io/) for raw data preprocessing. Functional connectivity analysis was performed with the CONN toolbox. We generated large-scale connectome gradients based on BrainSpace toolbox (https://github.com/MICA-MNI/BrainSpace). AHBA data were mapped into Schaefer atlas regions (400 × 400) using the abagen python toolbox (https://github.com/rmarkello/abagen) to generate a 400 × 15632 region transcription matrix. The first component of the PLS (PLS-1) consists of linear combinations of weighted gene expression values that correlate most closely with cortical maps of between-group differences. And then, we used the clusterProfiler R package to examine the enrichment of relevant gene features. Statistical analysis was performed using SPSS version 25.0 (IBM). The comparison of group differences was performed using a one-way ANOVA. A significance level of p < 0.05 was set.Results
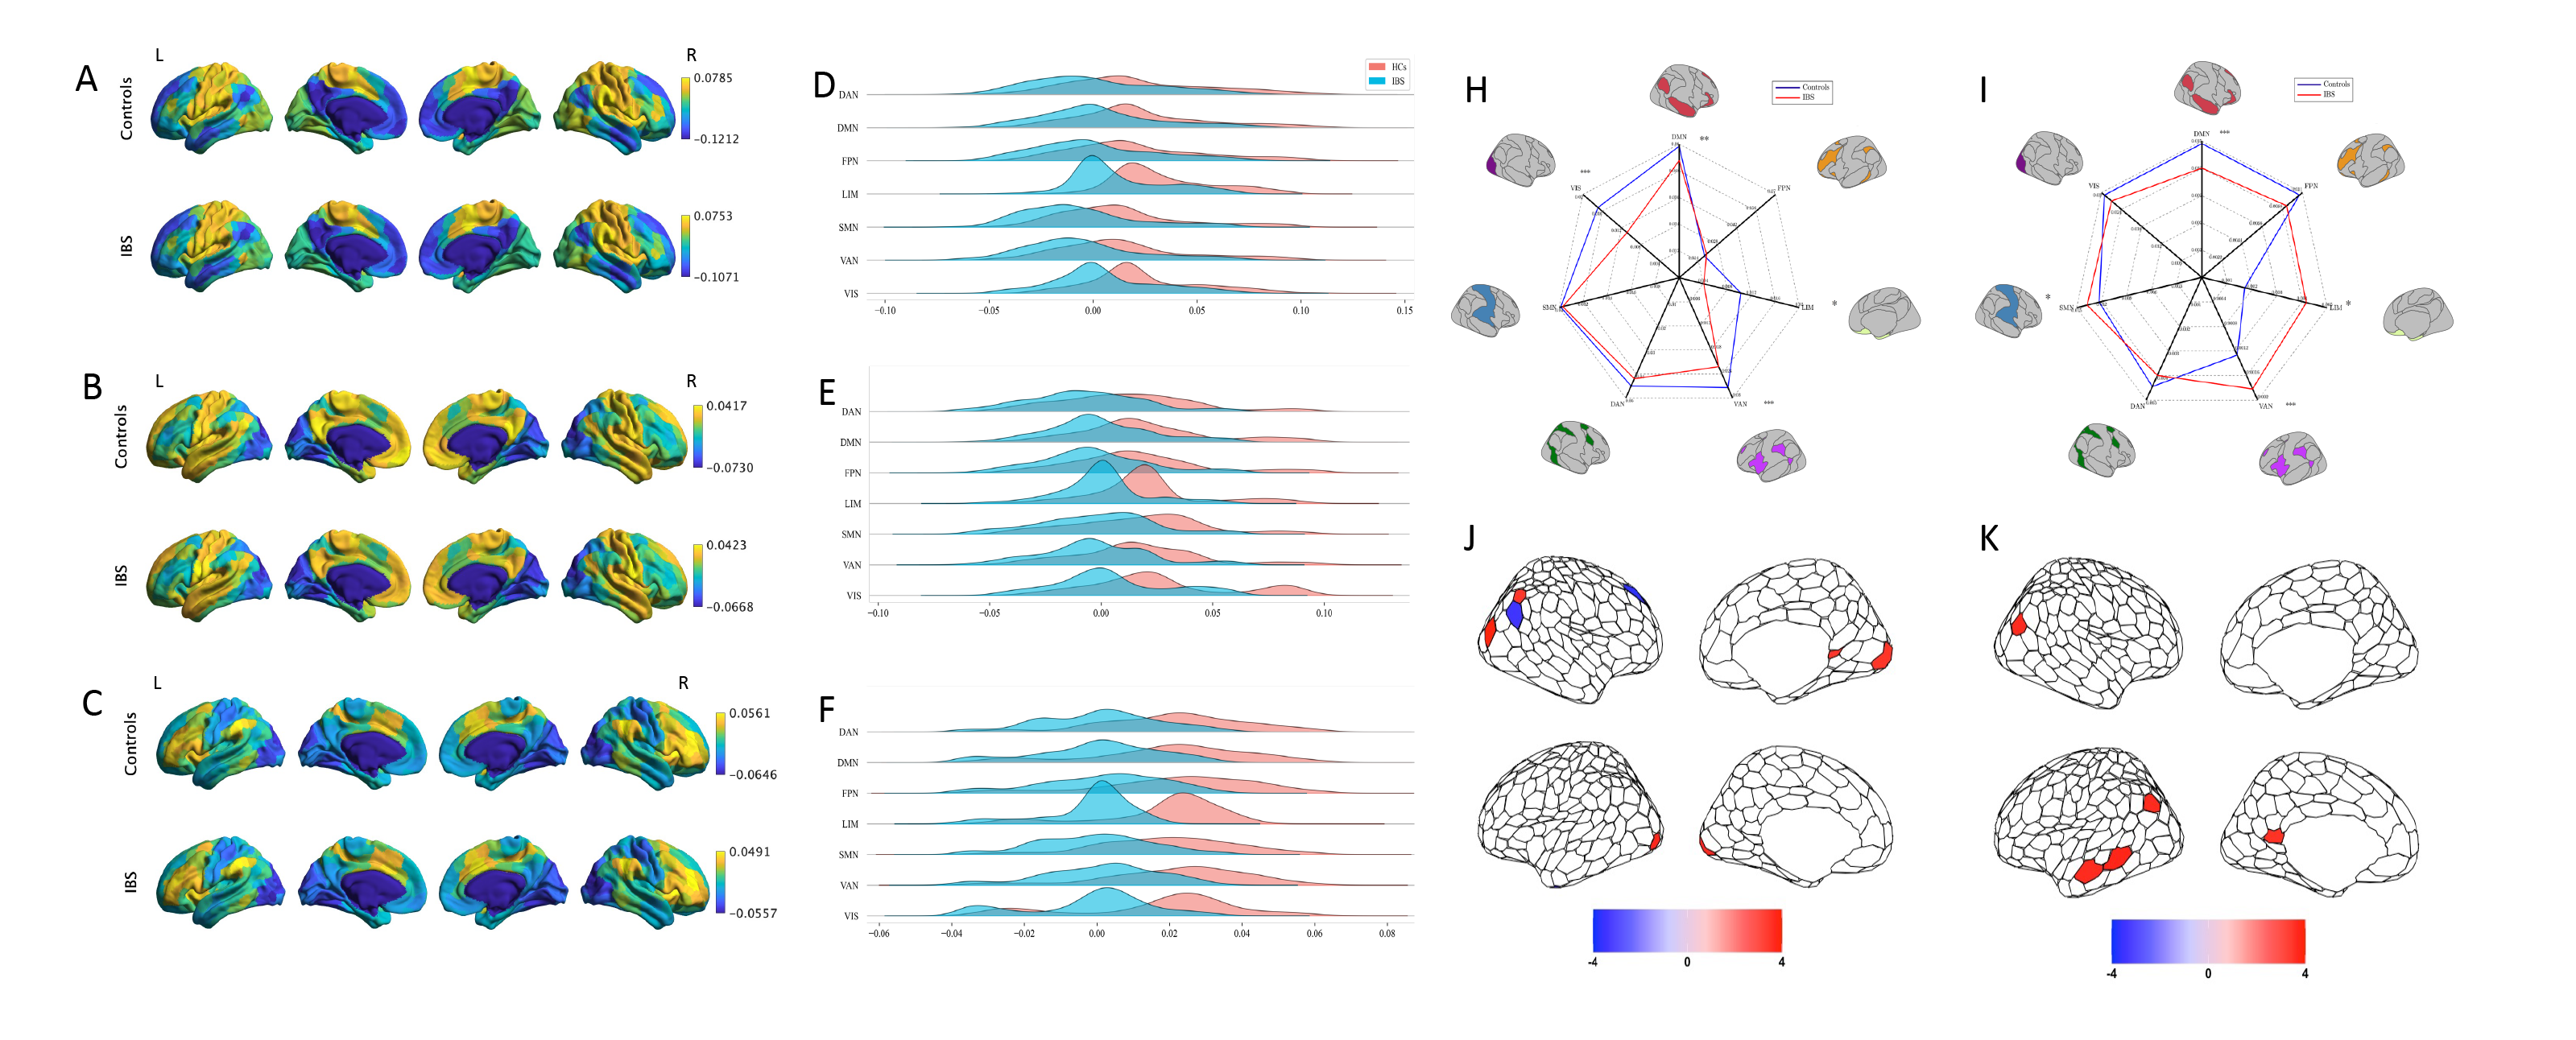
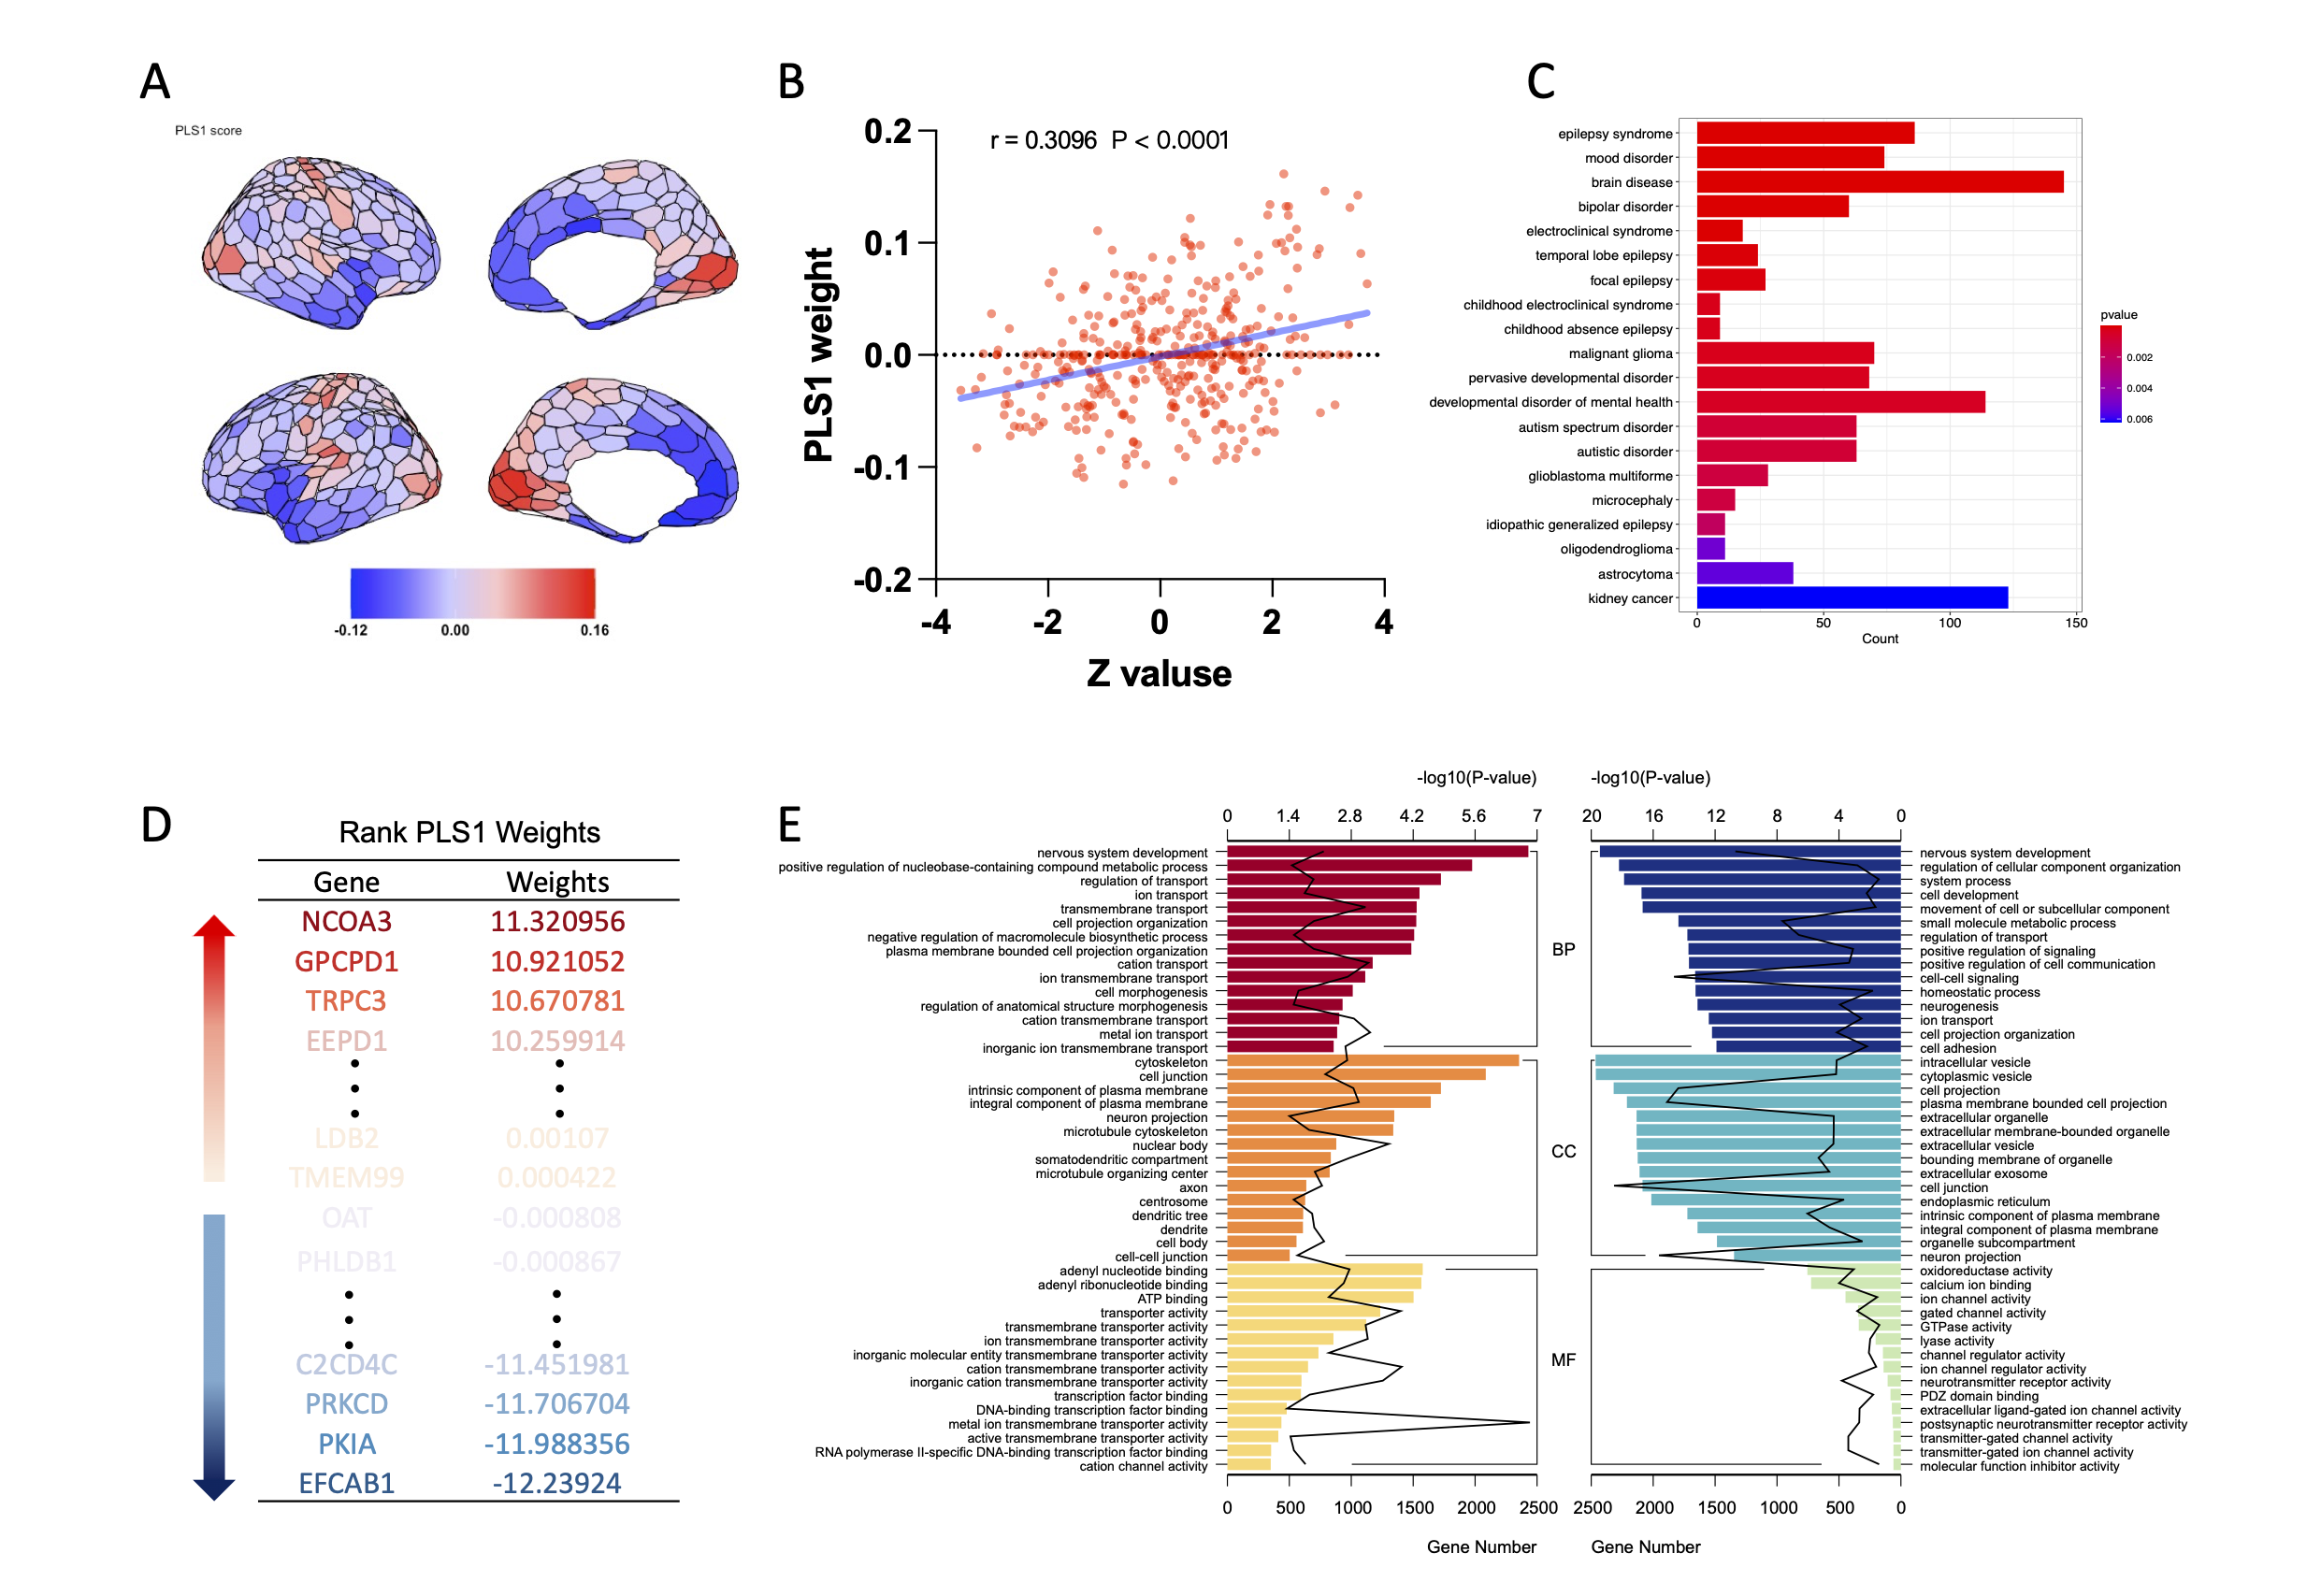
We found that the first three gradient explained 35.7% ± 3.0% of the total variance across all individual. The principal gradient aligned along the gradient axis from the visual and primary sensory-motor network (VSN/SMN) to the transmodal cortex (e.g., frontoparietal and DMN) (Fig. 1A), and the main primary to cross-modal gradient explained 17.5% ± 2.9% of the total connectivity variance. The second gradient (gradient 2) extends between the DMN and the ventral attention network (VAN), and the third gradient (gradient 3) running from areas commonly implicated in executive control network (ECN) to the paralimbic cortex, which is overlapping with part of the DMN (Fig. 1B and C) [7-10]. Visual inspection of the density map revealed a decrease in IBS extremes in gradient 1 relative to the control range and at the same level in the other two gradients (Fig. 1D-F). On a brain-wide scale of gradient 1, we found reduced functional separation between unimodal and cross-modal networks in IBS, mainly including VIS, DMN, LIM, and VAN. A slight increase in gradient values was found only in the FPN (Fig. 1H). In the whole-brain range of gradient 2, the gradient value of the DMN network decreased, and the gradient value increased in LIM, SMN, and VAN (Fig. 1I). The principal component of the PLS regression defined a weighted sum of gene expression that explained 16.4% of the variance (P<0.001, permutation test, Fig. 3A), mainly in high expression in the posterior parietal-occipital region and low expression in the prefrontal region (Fig. 2A). The regional mapping of this component was positively correlated with the Z-map of gradient 1 (r = 0.309, p < 0.0001, Fig. 2B). We ranked genes according with weights, where the top genes obtained after sorting in descending order represent the up-regulated set, and those obtained after sorting in ascending order represent the down-regulated set (Fig. 2D). We found that up and down-regulated genes are involved in neurons system development enrichment (FDR corrected q < 0.01, Fig. 3C and 3E).Discussion
In this study, we examined whether IBS patients could identify alterations in large-scale functional networks and the underlying genetic basis for such alterations using rs-fMRI gradient maps. demonstrated graded dysfunction of large-scale functional connectomes in IBS patients. Specifically, IBS patients exhibited reduced connectome hierarchy and constriction, with the most pronounced changes in sensory and trans-segmental gradient scores. These gradients were closely related to transcriptional profiles, with the most relevant genes enriched for neuron system development. There is evidence that IBS family aggregation is attributed to heredity or common environmental factors. Our findings provide genetic insights into the neurobiological mechanisms of IBS related FC changes.Conclusion
In summary, current study supported our hypotheses that alterations of the gradient existed in individuals with IBS, and these alterations were spatially related to gene expression. We further showed that neuron system development genes were enriched for neurobiologically relevant pathways. Together, our findings provide new insight into understanding the altered coordination of structure in patients with IBS and may offer a new endophenotype to further investigate the complex substrate of depression.Acknowledgements
No acknowledgements found.References
1. Mohammadi, M., et al. (2017). Serotonin Transporter Gene (SLC6A4) Polymorphism and Mucosal Serotonin Levels in Southeastern Iranian Patients with Irritable Bowel Syndrome. Middle East J Dig Dis, 9(1), 26-32. https://doi.org/10.15171/mejdd.2016.48
2. Tan, X., et al. (2020). Study on the clinical mechanism of Tong-Xie-An-Chang Decoction in the treatment of diarrheal irritable bowel syndrome based on single-cell sequencing technology. Medicine (Baltimore), 99(52), e23868. https://doi.org/10.1097/md.0000000000023868
3. Løvmo, S.D., et al. (2020). Mid and hindgut transcriptome profiling analysis of Atlantic salmon (Salmon salar) under unpredictable chronic stress. R Soc Open Sci, 7(2), 191480. https://doi.org/10.1098/rsos.191480 4. Borghini, R., et al. (2017). New insights in IBS-like disorders: Pandora's box has been opened; a review. Gastroenterol Hepatol Bed Bench, 10(2), 79-89.
5. Jin, D.C., et al. (2016). Regulation of the serotonin transporter in the pathogenesis of irritable bowel syndrome. World J Gastroenterol, 22(36), 8137-48. https://doi.org/10.3748/wjg.v22.i36.8137
6. Liu, X., et al. (2017). Reduced Functional Connectivity Between the Hypothalamus and High-order Cortical Regions in Adolescent Patients With Irritable Bowel Syndrome. J Pediatr Gastroenterol Nutr, 65(5), 516-519. https://doi.org/10.1097/mpg.0000000000001611
7. Cross, N., et al. (2021). Cortical gradients of functional connectivity are robust to state-dependent changes following sleep deprivation. Neuroimage, 226, 117547. https://doi.org/10.1016/j.neuroimage.2020.117547
8. Margulies, D.S., et al. (2016). Situating the default-mode network along a principal gradient of macroscale cortical organization. Proc Natl Acad Sci U S A, 113(44), 12574-12579. https://doi.org/10.1073/pnas.1608282113
9. Hong, S.J., et al. (2019). Atypical functional connectome hierarchy in autism. Nat Commun, 10(1), 1022. https://doi.org/10.1038/s41467-019-08944-1
10. Buckner, R.L. and D.S. Margulies. (2019). Macroscale cortical organization and a default-like apex transmodal network in the marmoset monkey. Nat Commun, 10(1), 1976. https://doi.org/10.1038/s41467-019-09812-8
Figures