3555
T2 heterogeneity of cortex in patients with beta-thalassemia major1Radiology Department of the First Affiliated Hospital of Guangxi Medical University, Nanning, China, 2Hematology Department of The First Affiliated Hospital of Guangxi Medical University, Nanning, China, 3MR Research, GE Healthcare, Beijing, China, Beijing, China
Synopsis
Keywords: Gray Matter, Blood, Beta-thalassemia; T2 heterogeneity;
Beta-thalassemia (β-TM) is an inherited blood disorder with severe anemia. In this study, we investigated alterations of T2 heterogeneity in cortical regions caused by β-TM using magnetic resonance imaging (MRI). Compared with healthy controls, β-TM patients showed increased T2 heterogeneities in bilateral inferior orbitofrontal, left calcarine, left cuneus and left superior occipital lobe, while no decreased T2 heterogeneity was observed. Thus, we concluded that T2 heterogeneities could reveal the β-TM-affecting T2 alterations in brain.Introduction
Beta-thalassemia (β-TM) is a chronic genetically haematological disorder with defective production of hemoglobin. Although the frequent therapy of transfusions and iron chelation can significantly prolong survival, β-TM patients still suffer from several complications including cognitive impairment. T2 relaxometry measured by MRI approach could be able to report tissue microstructure and relate to cognition1. In patients with β-TM, most studies described a shortened T2 relaxometry in subcortical regions2, whereas others found a prolonged result3. These opposite results imply that there are increased and decreased T2 relaxometry in different regions and averaging across the entire region could yield different results as the predominant T2 alteration may vary across patients. The T2 heterogeneity was proposed to measure T2 variance within region and correlated with cognitive change in Alzheimer’s disease4. Therefore, in this study, we employed the T2 heterogeneity to uncover the altered T2 relaxometry in patients with β-TM.Methods
Eighteen patients with β-TM (mean age ± standard deviation: 11.78±3.735 years; sex: 7 females and 11 males) and 8 healthy control (HC) subjects (age: 7.13±2.558 years; sex: 2 females and 6 males) were recurred from First Affiliated Hospital of Guangxi Medical University (participants’ information was shown in Table 1). The protocol of this study was approved by the local ethics committee. All participants signed an informed consent form prior to participation in this study.MRI data of all participants was obtained on a 3.0-T magnetic resonance scanner (SIGNA Premier MR, GE Healthcare, WI, USA) with a 48-channel head coil. For each subject, T1-weighted (T1w) images were acquired using the sagittal three-dimensional fast spoiled gradient echo-based sequence with 1.00 mm isotropic resolution. T2-mapping images were acquired using synthetic magnetic resonance imaging (SyMRI) sequence. SyMRI is a two-dimensional multiple-dynamic multiple-echo (MDME) sequence. The major sequence parameters included: repetition time (TR) = 10,205.0 ms; echo time (TE) =11.3 ms; flip angle (FA) = 20°; echo train length = 16; in-plane pixel size = 2.0 mm×2.0 mm; and slice thickness = 2 mm with no gap.
The T2 relaxometry in each cortical region was obtained as follow: the quantitative T1- and T2- mapping (T1m and T2m) images were calculated from the SyMRI data using the vendor-provided postprocessing software (SyntheticMR, v11.2.2). Then, the linear transformation matrix between T1m images and T1w images and non-linear warped images between T1w images and T1w template images in MNI space were obtained using the Advanced Normalization Tools (ANTs). T2m images were transformed to MNI space by applying the linear transformation matrix and non-linear warped images. Finally, T2 relaxometry values in each cortical region were extracted using Automated Anatomical Labeling atlas.
For each cortical region, T2 relaxometry data were fitted to 18 different distribution functions using the maximum likelihood estimation in MATLAB software4. Then, the distribution function with minimum Akaike Information Criteria value was selected. And the midpoint and heterogeneity values were extracted based on the selected distribution function. Finally, a general linear mode with the group as the main factor and sex and age as covariates was conducted to analyze difference in the midpoint and heterogeneity between the β-TM and HC groups.
Results
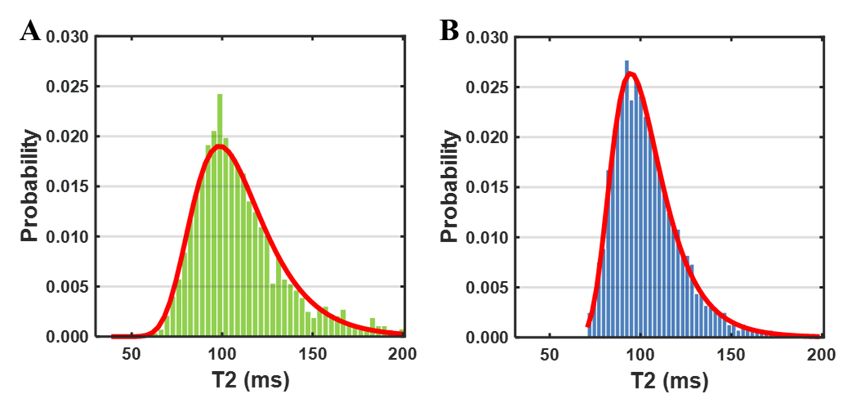
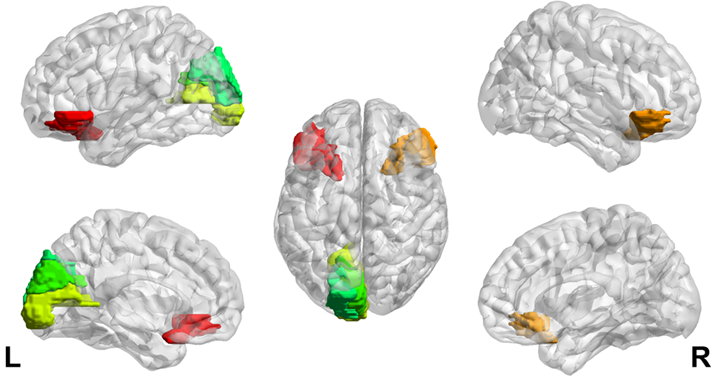
Generalized extreme value distribution function showed the best fitting results for the T2 distributions of all brain regions in majority participants. The location parameter (μ) and scale parameter (σ) of the generalized extreme value distribution function were extracted as midpoint and heterogeneity4. Fitting examples of one β-TM patient and one healthy subject were showed in Fig. 1. The heterogeneities of two distributions were obviously different, while the midpoints were same.Compared with HC subjects, increased T2 heterogeneities were showed in bilateral inferior orbitofrontal, left calcarine, left cuneus and left superior occipital lobe. No decreased T2 heterogeneity was found. The brain regions with different T2 heterogeneity and the corresponding detail information were showed the Fig. 2 and Table 2 respectively. For the T2 midpoints, no significantly difference was found.
Discussion
n this study, regional T2 heterogeneities of cortical areas were evaluated in the patients with β-TM. Compared with HC subjects, altered T2 heterogeneities were found in some cortical regions, whereases no significant difference in T2 midpoint was found (Table 2). This result suggested that the β-TM may cause both decreased and increased T2 relaxometry among the voxels of these brain regions (Fig. 1), while the midpoints of T2 relaxometry may not be affected. In β-TM, the iron deposition is the main factor for the T2 decrease5. And the T2 increase may be the results of cell member disruption which may lead to the increase of water mobility. All these disruptions could induce the cognitive decline. The altered T2 heterogeneities were found in frontal and occipital lobes which are associated with attention and visual function. And the disruption in of these functions were reported in β-TM patients by previous studies6. Thus, T2 heterogeneity has the potential to evaluate the cognitive impairment in patients with β-TM.Conclusion
Heterogeneity can be used to evaluated T2 alteration of cortical regions affected by β-TM.Acknowledgements
No acknowledgement found.References
1. MacKay A, Laule C, Vavasour I, Bjarnason T, Kolind S, Mädler B. Insights into brain microstructure from the T2 distribution. Magn Reson Imaging. 2006;24(4):515–525.
2. Argyropoulou MI, Metafratzi Z, Kiortsis DN, Bitsis S, Tsatsoulis A, Efremidis S. T2 Relaxation Rate as an Index of Pituitary Iron Overload in Patients with β-Thalassemia Major. Am J Roentgenol. 2000;175(6):1567–1569.
3. Metafratzi Z, Argyropoulou MI, Kiortsis DN, Tsampoulas C, Chaliassos N, Efremidis SC. T2 relaxation rate of basal ganglia and cortex in patients with β-thalassaemia major. Br J Radiology. 2001;74(881):407–410.
4. Wearn AR, Nurdal V, Saunders-Jennings E, et al. T2 heterogeneity: a novel marker of microstructural integrity associated with cognitive decline in people with mild cognitive impairment. Alzheimer’s Res Ther. 2020;12(1):105.
5. Qiu D, Chan GC-F, Chu J, et al. MR Quantitative Susceptibility Imaging for the Evaluation of Iron Loading in the Brains of Patients with β-Thalassemia Major. Am J Neuroradiol. 2014;35(6):1085–1090.
6. Raz S, Koren A, Levin C. Attention, response inhibition and brain event‐related potential alterations in adults with beta‐thalassaemia major. Brit J Haematol. 2019;186(4):580–591.
Figures