3554
Altered cortical susceptibility heterogeneity in patients with beta-thalassemia1Radiology Department of the First Affiliated Hospital of Guangxi Medical University, Nanning, China, 2Hematology Department of The First Affiliated Hospital of Guangxi Medical University, Nanning, China, 3MR Research, GE Healthcare, Beijing, China, Beijing, China
Synopsis
Keywords: Gray Matter, Blood, Beta-thalassemia
Beta-thalassemia (β-TM) is an inherited blood disorder that causes the body to make less hemoglobin. In this study, we examined altered cortical susceptibility heterogeneity in patients with β-TM vs. healthy controls using magnetic resonance imaging (MRI). For the altered regions of susceptibility heterogeneities in the β-TM group, an increase was only found in the left hippocampus, while decreased heterogeneities were observed for all other regions located in the frontal and temporal lobes. Thus, we concluded that susceptibility heterogeneities could reveal the β-TM-affecting regions.Introduction
Beta-thalassemia (β-TM) is a group of hereditary disorders responsible for the reduced production of hemoglobin. Patients with β-TM require a blood transfusion, which remains the primary treatment for prolonging survival; yet, this method can lead to iron overload in the heart, liver, and brain. Quantitative susceptibility mapping (QSM), a reliable MRI technique to quantify iron content1, has been widely used to evaluate abnormalities of brain iron level in β-TM patients2,3. Previous studies found increased and decreased regional susceptibilities in several brain areas2,3. However, averaging across the entire region with both increased and decreased susceptibilities could yield a net change of zero and therefore hide some abnormalities caused by β-TM. To address this issue, regional heterogeneity, which has been used to evaluate T2 relaxation time in Alzheimer’s disease4, was employed in the present study to uncover the altered brain iron content in patients with β-TM.Methods
Twenty-one patients with β-TM (mean age ± standard deviation: 27.26 ± 20.47 years; sex: 18 females and 21 males) and 19 healthy control (HC) subjects (age: 27.26 ± 20.47 years; sex: 18 females and 21 males) were included in the study. Participants’ information is shown in Table 1. The protocol of this study was approved by the ethics committee of XX Hospital, and informed consent forms were signed by all participants.MRI data were scanned using a 3.0-T magnetic resonance scanner (SIGNA Premier MR, GE Healthcare, WI, USA) with a 48-channel head coil. T1-weighted (T1w) images were acquired for each subject with a three-dimensional brain volume (3D-BRAVO) technique. The major sequence included: repetition time (TR) =8.464 ms; echo time (TE) =3.2480 ms; flip angle (FA) = 15°; matrix size = 256 × 256; field of view (FOV) = 25.6 cm × 25.6 cm; 196 slices with a 1-mm slice thickness (no slice gap). An ESWAN sequence with 8 echoes was scanned after T1w to obtain QSM data. The main scan parameters were first echo time = 4.4 ms; TR = 46.7 ms; FOV = 25.6 cm × 25.6 cm; FA = 20°; matrix size = 256 × 256; slices = 75; slice thickness = 2 mm with no gap.
The susceptibilities of cortical regions were obtained as follows: the susceptibility maps were first calculated using the STISuite toolbox. Then, the linear transformation matrix between ESWAN first magnitude images and T1w images and the non-linear warped images between T1w images and T1w MNI template images were obtained using the Advanced Normalization Tools (ANTs). Next, considering ESWAN first magnitude images and susceptibility maps were in the same space, the linear transformation matrix and non-linear warped images were applied to the susceptibility maps. Finally, susceptibility values in each cortical region were extracted using the Automated Anatomical Labeling atlas.
For each cortical region, susceptibility data were fitted to 18 different distribution functions using the maximum likelihood estimation in MATLAB software4. First, the distribution function with minimum Akaike Information Criteria value was selected. Then, the midpoint and heterogeneity values were extracted based on the selected distribution function. Finally, the midpoints and heterogeneities of each brain regions were compared between β-TM and HC groups using general linear mode with age and sex as covariates.
Results
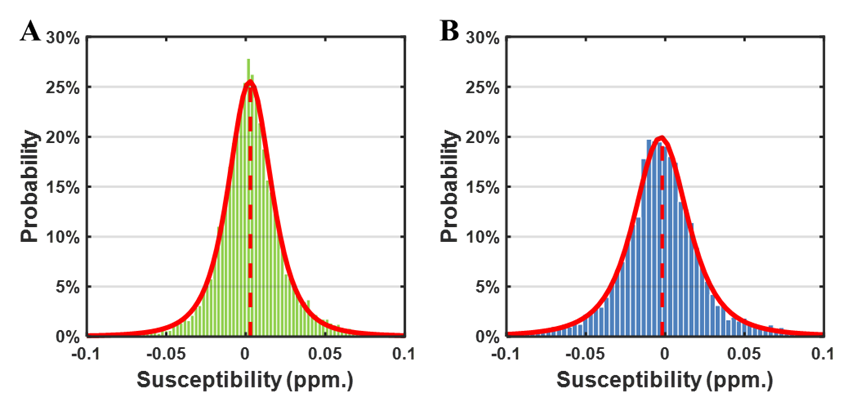
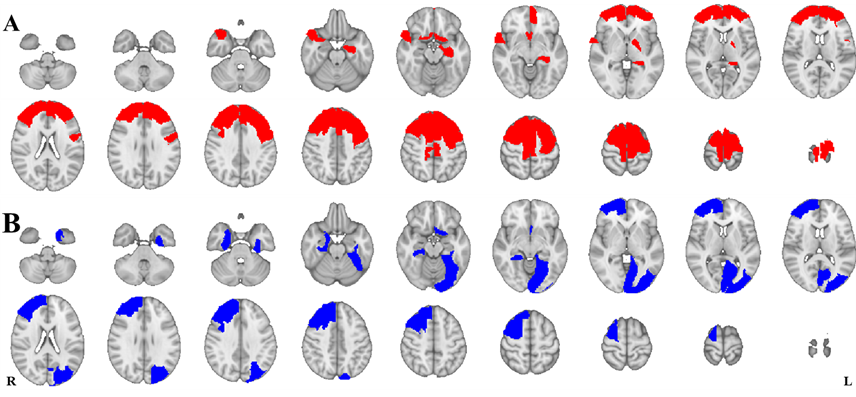
The susceptibility distributions of all brain regions were best fitted in the majority of participants by the t location-scale distribution function. The location parameter (μ) and scale parameter (σ) of the t location-scale distribution function were chosen as midpoint and heterogeneity4. Fig. 1 shows two examples of fitting results, one β-TM patient and one healthy subject. The heterogeneities of these two distributions were obviously different, while the midpoints were the same.Next, we compared the regional heterogeneity and midpoint of susceptibilities of the whole cortical areas between the two groups. The brain regions with significant differences (p < 0.05 after FDR correction) and the corresponding information are shown the Figure 2 and Table 2, respectively. For the altered regions of susceptibility heterogeneities in the β-TM group, an increase was only found in the left hippocampus, while all other regions, located in frontal and temporal lobes, showed significantly decreased heterogeneities (p < 0.05 after FDR correction). For the midpoints, β-TM caused increased or decreased susceptibilities in the frontal, temporal, and occipital lobes.
Discussion
In this study, we evaluated the regional susceptibility heterogeneities in the cortical areas affected by the β-TM. Compared with the HCs, several brain regions showed significantly altered susceptibility heterogeneities, while there was no difference in the susceptibility midpoints in these regions. These data implied that the iron content in these brain regions was increased while in the other regions, it was decreased. Also, averaging the susceptibilities of these voxels could lead to a net change of zero4. The brain regions with altered iron content heterogeneities in the temporal and frontal lobes were associated with many ‘higher’ cognitive functions, including decision-making, attention, memory and so on. Previous studies indicated that changes in iron content level in the brain affects cognition5,6. Thus, the cognition impairment in β-TM patients could be related to the altered iron content heterogeneities.Conclusion
Susceptibility heterogeneities could reveal the β-TM-affecting regions where the midpoints did not show significant differences compared to healthy subjects.Acknowledgements
No acknowledgement found.References
1. Bilgic B, Pfefferbaum A, Rohlfing T, Sullivan EV, Adalsteinsson E. MRI estimates of brain iron concentration in normal aging using quantitative susceptibility mapping. Neuroimage. 2012;59(3):2625–2635.
2. Manara R, Ponticorvo S, Tartaglione I, et al. Brain iron content in systemic iron overload: A beta-thalassemia quantitative MRI study. Neuroimage Clin. 2019;24102058.
3. Qiu D, Chan GC-F, Chu J, et al. MR Quantitative Susceptibility Imaging for the Evaluation of Iron Loading in the Brains of Patients with β-Thalassemia Major. Am J Neuroradiol. 2014;35(6):1085–1090.
4. Wearn AR, Nurdal V, Saunders-Jennings E, et al. T2 heterogeneity: a novel marker of microstructural integrity associated with cognitive decline in people with mild cognitive impairment. Alzheimer’s Res Ther. 2020;12(1):105.
5. Youdim MBH. Brain iron deficiency and excess; cognitive impairment and neurodegenration with involvement of striatum and hippocampus. Neurotox Res. 2008;14(1):45–56.
6. Brass SD, Chen N, Mulkern RV, Bakshi R. Magnetic Resonance Imaging of Iron Deposition in Neurological Disorders. Top Magn Reson Imag. 2006;17(1):31–40.
Figures