3553
Reveal cortical abnormalities by quantitative synthetic MRI in children with beta-thalassemia1Radiology Department of the First Affiliated Hospital of Guangxi Medical University, Nanning, China, 2Hematology Department of The First Affiliated Hospital of Guangxi Medical University, Nanning, China, 3MR Research, GE Healthcare, Beijing, China, Beijing, China
Synopsis
Keywords: Gray Matter, Blood, Beta-thalassemia
Beta-thalassemia (β-TM) is a chronic blood disorder presenting with severe anemia. However, the abnormalities of microstructure in cortical regions are still unclear. Herein, we explored the difference of quantitative MRI parameters in gray matter between β-TM patients and healthy controls. The results showed that altered T1 and T2 values in specific gray matter in β-TM patients, which may be associated with alteration in brain gray matter, such as reduced myelin content and excessive iron deposition. Thus, T1 and T2 quantitative variables may be promising imaging markers for further exploring the pathophysiological mechanisms of β-TM.Introduction
In southern China, beta-thalassemia (β-TM) is the most common hereditary hemolytic anemia. Besides the persistent anemia and hypoxia, iron deposition from the frequent therapy of blood transfusion and iron chelation in children with β-TM can lead to several complications including cognitive impairment1,2. Recent study has shown that the quantitative MRI parameters (T1, T2, etc.) can be used to reveal the brain microstructure abnormalities caused by the diseases and are related to cognitive dysfunction3. However, most β-TM studies focused on the T2 alteration in subcortical regions to uncover the iron deposition. And T1 and T2 relaxometry in cortical regions were not well investigated. Accordingly, this study aims to investigate the quantitative profiles of brain cortex in children with β-TM major using synthetic magnetic resonance imaging (SyMRI) technique, which can quantify the T1 and T2 values in the brain4.Methods
Eighteen patients with β-TM major (ages range from 4 to 18 years) and 8 healthy control (HC) subjects (ages range from 5 to 11 years) were enrolled from First Affiliated Hospital of Guangxi Medical University (participants’ information was shown in Table 1). This study was approved by the local ethics committee. And all participants signed the informed consent forms.MRI examinations of all participants were performed on a 3.0T scanner (SIGNA Premier GE Healthcare, WI, USA) using 32-channel head coils. For each subject, T1-weighted (T1w) images were acquired using the sagittal three-dimensional fast spoiled gradient echo-based sequence with 1.00 mm isotropic resolution. Quantitative MRI parameters including T1 and T2 mapping images were obtained using the SyMRI technique, which is based on the two-dimensional multiple-dynamic multiple-echo (MDME) sequence. The main parameters were repetition time = 10,205.0 ms; echo time =11.3 ms; flip angle = 20°; echo train length = 16; in-plane voxel size = 2.0 mm×2.0 mm; and slice thickness = 2 mm with no gap.
The T1 and T2 relaxation time in each cortical region was obtained as follow: (1) T1- and T2- mapping (T1m and T2m) images were calculated using the vendor-provided postprocessing software (SyntheticMR, v11.2.2). (2) liner transformation matrix between T1m and T1w images were calculated using rigid only transformation. (3) non-linear warped images between T1w images and T1w template images in MNI space were calculated using rigid, affine and non-linear transformation in the Advanced Normalization Tools (ANTs). (4) T2m images were transformed to MNI space by applying the linear transformation matrix and non-linear warped images. (5) Mean T1 and T2 relaxation time in each cortical region were extracted using Automated Anatomical Labeling (AAL) atlas. Group comparisons were preformed using a general linear mode with the group as the main factor after controlling for the effect of age and sex.
Results
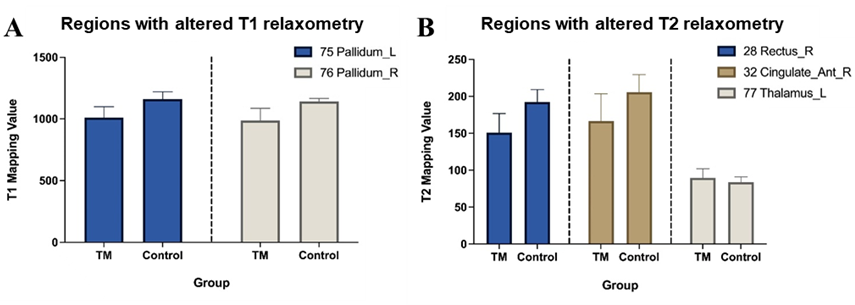
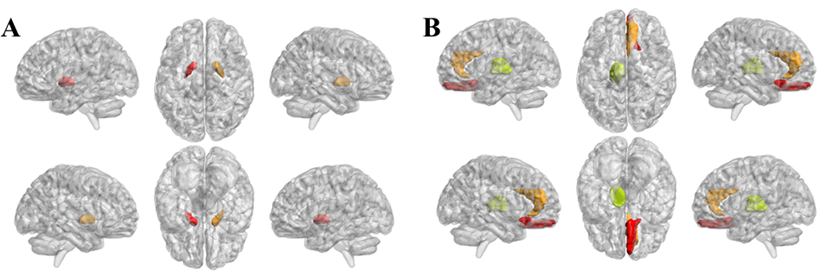
The main demographic characteristics of β-TM and HC groups are shown in Table 1. There were significant differences in age (P = 0.004) between the two groups, while no significant difference was found in gender (P = 0.472). T1 and T2 group-differences were showed in Table 2 and Fig. 1. The corresponding brain regions were showed in Fig. 2. The T1 mapping value of the bilateral pallidum was lower in patients compared with the controls (P<0.01). The T2 mapping value of the right rectus and anterior cingulate cortex was lower in patients compared with the controls (P<0.01), while the left thalamus was higher in patients compared with the controls (P<0.01).Discussion
In this study, the decreased T1 relaxation times of bilateral pallidum in patients with β-TM could be related to the iron overload, which may reflect macrostructure changes and microstructure alteration in these regions. Interestingly, previous study has shown that the underload iron in pallidum in β-TM patients compared to healthy controls5. The inconsistencies findings increased the diversity of brain iron deposition regions in patients with β-TM. The lower T2 value of anterior cingulate cortex found in the β-TM group may relate to the impairment of executive function in patients with β-TM , as anterior cingulate cortex belongs to the executive network of attention system. Considering water trapped between the myelin layers has a shorter T2 relaxometry than water in the intra- and extra-cellular compartments6, the longer T2 values of thalamus in β-TM patients may suggest a decreased concentration of myelin content and increased water content.However, the current study has some limitations including small sample size and did not acquire neuropsychological assessments. Future controlled studies with a larger cohort including these measures are warranted.
Conclusion
The quantitative MR imaging could reflect the brain tissue microstructure changes, thus furthering our knowledge of the brain changes in β-TM.Acknowledgements
No acknowledgement found.References
1. Daar S, Saadoon MA, Wali Y, et al. Cognitive Function in Adults with Beta-Thalassemia Major in Oman: A Pilot Study. Oman Medical J. 2021;36(6):e322–e322.
2. El-Alameey IR, Alzaree F, Shehata MA, Shady MMA, Atti MA, El-Khonezy MI. Neurocognitive Function and Its Related Potentials in Children with Beta Thalassemia Major: An Egyptian Study. Open Access Macedonian J Medical Sci. 2019;7(3):322–328.
3. Edwards LJ, Kirilina E, Mohammadi S, Weiskopf N. Microstructural imaging of human neocortex in vivo. Neuroimage. 2018;182184–206.
4. Warntjes JBM, Leinhard OD, West J, Lundberg P. Rapid magnetic resonance quantification on the brain: Optimization for clinical usage. Magn Reson Med. 2008;60(2):320–329.
5. Qiu D, Chan GC-F, Chu J, et al. MR Quantitative Susceptibility Imaging for the Evaluation of Iron Loading in the Brains of Patients with β-Thalassemia Major. Am J Neuroradiol. 2014;35(6):1085–1090.
6. Does MD. Inferring brain tissue composition and microstructure via MR relaxometry. Neuroimage. 2018;182136–148.
Figures