3544
Histogram Analysis of Magnetic Resonance Diffusion Imaging in Differentiating Glioma Mimicking Encephalitis from Encephalitis
Kai Zhao1, Xiaoyue Ma1, Ankang Gao1, Eryuan Gao1, Jinbo Qi1, Peipei Wang1, Guohua Zhao1, Huiting Zhang2, Guang Yang3, Jie Bai1, Yong Zhang1, and Jingliang Cheng1
1Department of MRI, The First Affiliated Hospital of Zhengzhou University, Zhengzhou, China, 2Magnetic Resonance Scientific Marketing, Siemens Healthineers Ltd., Wuhan, China, 3Shanghai Key Laboratory of Magnetic Resonance, East China Normal University, Shanghai, China
1Department of MRI, The First Affiliated Hospital of Zhengzhou University, Zhengzhou, China, 2Magnetic Resonance Scientific Marketing, Siemens Healthineers Ltd., Wuhan, China, 3Shanghai Key Laboratory of Magnetic Resonance, East China Normal University, Shanghai, China
Synopsis
Keywords: Tumors, Tumor, Inflammation Diffusion/Other Diffusion Imaging Techniques
Glioma Mimicking Encephalitis is difficult to be differentiated from Encephalitis by conventional MRI. In this study, 18 patients with diagnosed glioma and 15 patients with encephalitis were included. Their DWI images were processed to obtain the histogram of the parameter maps of DKI, DTI, NODDI, and MAP. We use lasso regression to fit the diagnostic models, and the diagnostic performance of different models were compared. We find no significant difference in the AUC between the single and combined diffusion lasso models. Any of the models could be individually used for differentiating glioma mimicking encephalitis from encephalitis.Background and Purpose
Some gliomas with atypical presentation on MR images are difficult to differentiate from encephalitis[1]. However, the corresponding treatment principles and prognosis are different for the two diseases. Glioma needs to be surgically removed[2], while non-operative therapy is the main treatment for encephalitis[3]. Advanced diffusion models reflect microstructural differences in lesions. In this study, we evaluated the performance of histogram analysis of 4 diffusion models in differentiating glioma mimicking encephalitis from encephalitis, including Diffusion tensor imaging (DTI), Diffusion kurtosis imaging (DKI), Mean apparent propagator (MAP), and Neurite orientation dispersion and density imaging (NODDI) models.Materials and Methods
The imaging data of 33 patients with diagnosed glioma (n=18) and encephalitis (n=15) were retrospectively collected. All patients underwent conventional MRI (including T1WI, T2WI, T2WI-FLAIR) and DWI scans on a 3T MR scanner (MAGNETOM Prisma, Siemens Healthineers, Erlangen, Germany) with a 64 channel of head-neck coil before surgery or conservative treatment. The acquisition parameters of DWI were as follows: spin-echo echo-planar imaging sequence, field of view, 220 × 220 mm2; section thickness, 2.2 mm; 60 sections; TR msec/TE msec, 2500/71, five non-zero b values (500, 1000, 1500, 2000, and 2500 sec/mm2) in 30 directions for every b value, one zero b value. The DWI images were processed by NeuDiLab (Diffusion Imaging In Python, http://nipy.org/dipy) to obtain the parameter maps of DKI, DTI, NODDI, and MAP. The volumes of interest (VOIs) of lesions were manually delineated on the b=0 image (Figure 1) and registered it to other parametric maps, and the histogram features of each parameter map were extracted by FAE (https://github.com/salan668/FAE) [4]. The chi-square test, independent samples t test and Mann-Whitney U test were used to compare the general data, conventional MRI findings and histogram differences of diffusion parameters between the two groups, respectively. Lasso regression was used to fit the diagnostic model, the receiver operating characteristic (ROC) curve was drawn to calculate the area under the curve (AUC), and the Delong test was used to compare the differential diagnostic performance of different models. P<0.05 was considered statistically significant.Results
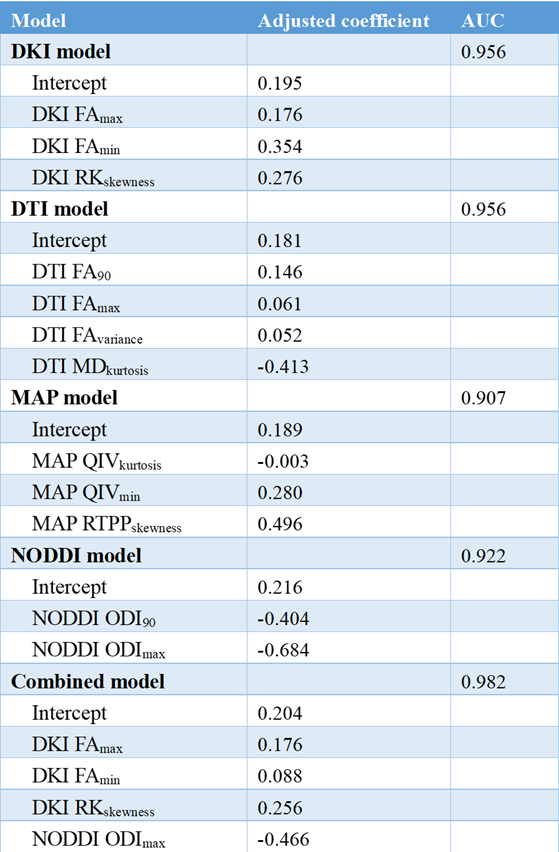
The average age of patients in the encephalitis group was significant older than that in the glioma group (P < 0.05), but there was no significant difference in gender distribution between the two groups (P > 0.05). In conventional MRI, there was no significant difference between the two groups in terms of edema, cystic changes, necrosis, hemorrhage and mass effect (Table 1). The diffusion models and the corresponding AUC are reported in Table 2. Delong test shows no significant difference in the AUC between the single and combined diffusion lasso models for differentiating glioma mimicking encephalitis from encephalitis (P>0.05).Discussion
In the models, the positive coefficient indicates a higher parameter value in the glioma group; Conversely, the negative coefficient represents a higher parameter value in the encephalitis group. In our study, FA from DTI, DKI and combined models is an important index to differentiate glioma and encephalitis. The higher FAmax and FAmin in glioma indicated higher cell density, cellularity, and vascularity, representing a higher degree of malignancy than encephalitis[5]. Higher ODImax value in encephalitis means more isotropic[6]. In glioma, the tissue structure is prone to anisotropic due to cellularity and vascularity, therefore the ODImax is lower. Normal white matter shows low signal on the map of QIV. The QIVmin may represents the most slightly damaged part of the white matter in the lesion. The less QIVmin in encephalitis indicates the less damage to white matter in encephalitis than glioma. The higher skewness, variance and lower kurtosis of some parameters in glioma indicate that the signal distribution of the glioma is more uneven, representing a higher heterogeneity of glioma than encephalitis.Conclusion
Histogram analysis of magnetic resonance diffusion imaging is helpful for differentiating glioma mimicking encephalitis from encephalitis.Acknowledgements
Thank youprofessors from the First Affiliated Hospital for academic guidance. Thank you engineers from Siemens Healthineers for technical support. Thank you scientist from East China Normal University for calculation and analysis.References
[1] Piper K, Foster H, Gabel B, et al. Glioblastoma Mimicking Viral Encephalitis Responds to Acyclovir: A Case Series and Literature Review[J]. Front Oncol, 2019, 9: 8. [2] Lapointe S, Perry A, Butowski N A. Primary brain tumours in adults[J]. Lancet, 2018, 392(10145): 432-446. [3] Hodler J, Kubik-Huch R A, Von Schulthess G K, editor, Diseases of the Brain, Head and Neck, Spine 2020-2023: Diagnostic Imaging, Cham (CH), 2020. [4] Song Y, Zhang J, Zhang Y D, et al. FeAture Explorer (FAE): A tool for developing and comparing radiomics models[J]. PLoS One, 2020, 15(8): e0237587. [5] White M L, Zhang Y, Yu F, et al. Diffusion tensor MR imaging of cerebral gliomas: evaluating fractional anisotropy characteristics[J]. AJNR Am J Neuroradiol, 2011, 32(2): 374-81. [6] Qi J, Wang P, Zhao G, et al. Histogram Analysis Based on Neurite Orientation Dispersion and Density MR Imaging for Differentiation Between Glioblastoma Multiforme and Solitary Brain Metastasis and Comparison of the Diagnostic Performance of Two ROI Placements[J]. J Magn Reson Imaging, 2022.Figures
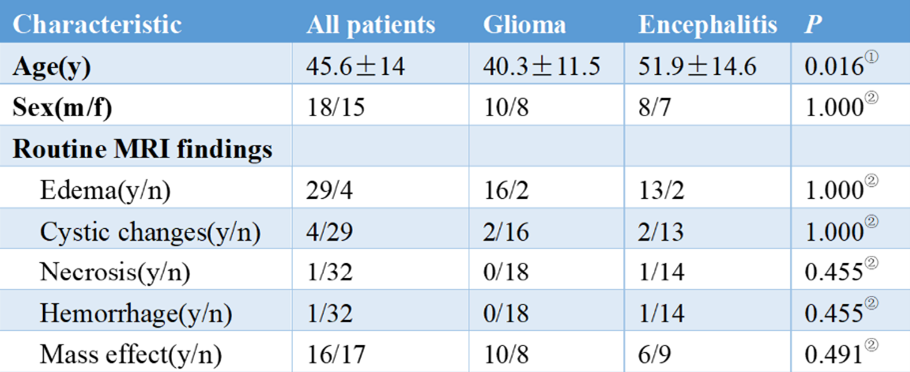
Table 1. Patient Characteristics.
①independent t-test was adopted ②chi-square test was adopted
Table
2. Coefficients of features in the diffusion models and AUC.
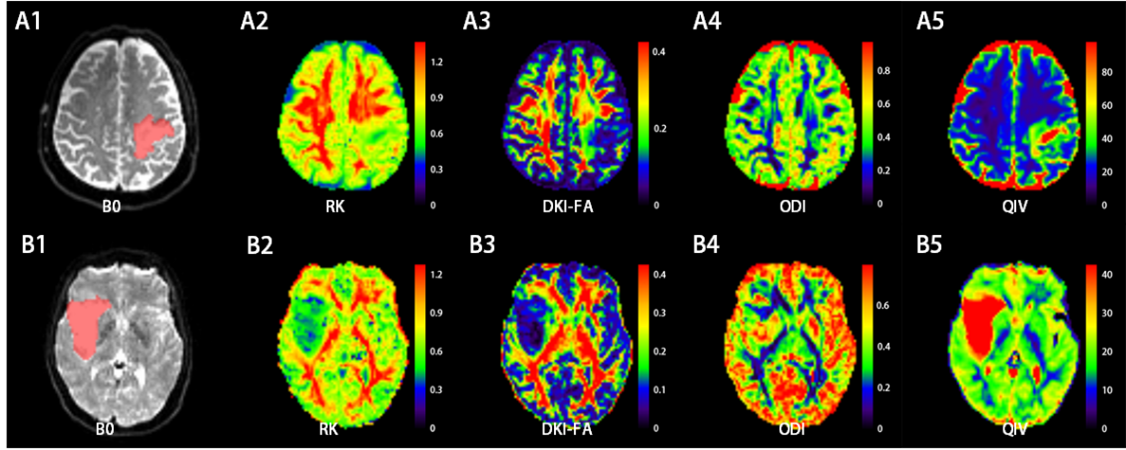
Figure
1. A: a 72 years old male patient with hyperplasia of glial cells in the left
parietal lobe, perivascular lymphocyte mantle formation, and inflammatory cell
infiltration. B: a 47 years old female patient with right insular
oligodendrocyte tumor (WHO grade II). (A,B)1: VOI (red part) was delineated
along the edge of the lesion on the b=0 DWI image, (A,B)2-4: color maps of RK, DKI-FA,
ODI and QIV, respectively.
DOI: https://doi.org/10.58530/2023/3544