3540
Biomolecular basis of changes in CEST Z-spectra of rat spinal cord after injury1Biomedical Engineering, Vanderbilt University, Nashville, TN, United States, 2Vanderbilt University Institute of Imaging Science & Department of Radiology and Radiological Sciences, Vanderbilt University Medical Center, Nashville, TN, United States
Synopsis
Keywords: Spinal Cord, CEST & MT
We identified molecular pools of interest using CEST imaging of rats after spinal cord injury (SCI) that correlate with post-SCI behavioral deficits, and which may indicate products of neuroinflammation. Using tissue neurochemical analysis, we isolated analytes of interest and acquired CEST Z-spectra from solutions of the chemicals to elucidate the source of the CEST pool concentration changes. Several candidates present in the tissue samples showed similar (overlapping) Z-spectra around 3.0 ppm. These results suggest that CEST imaging is not specific for identifying concentration changes of individual molecules of interest.Introduction
Spinal cord injuries (SCI) trigger a range of complex pathological mechanisms. Numerous processes are driven by the neuroinflammatory response1, including glutamate excitotoxicity and pro-inflammatory cytokine release, which are present during the acute and secondary pathological stages post-injury, and are commonly targeted for SCI drug treatments2. We have previously identified molecular pools of interest using CEST imaging in rat SCIs that correlate with post-SCI behavioral deficits, and which may be linked to biomolecules involved in the neuroinflammatory response3. However, the biological basis of the molecular pool concentration changes is not understood. The goal of this study is to use tissue neurochemical analysis to isolate analytes of interest from samples of injured cords and acquire CEST Z-spectra from in-vitro solutions of the identified chemicals to elucidate the source of the molecular pool changes observed in rat SCI CEST data.Methods
In-vitro aqueous solutions were created similar to procedures outlined in Lee et. al.4 Solutes of interest (glutamate, taurine, GABA, lysine and arginine) were dissolved in deionized water and pH adjusted to create 100 mM concentration samples for imaging in 1.5 mL Eppendorf tubes. Combination mixtures of the different solutes of interested were also created.CEST imaging data were collected on a BrukerTM horizontal 9.4T scanner using a CEST sequence with a 2s rectangular irradiation pulse at 1uT power, followed by a 2-shot spin-echo echo-planar sequence (TR/TE = 3000/29.59ms; FOV = 32×32 mm2; Matrix size = 96 x 96; Slice thickness = 3mm (axial), 0.8mm (coronal)). 33 RF offset frequency points were chosen to densely sample around pools of interest between -5.0 to 5.0 ppm. In-vivo rat SCI scans were acquired in the axial orientation with one slice rostral and one caudal to the injury site, and 1 coronal slice through the center of the spinal cord. Z-spectra of the solutions were acquired using the same imaging protocol using 1 axial slice.
Z-spectra were obtained from regions of interest (ROIs) in the spinal cord and fitted to a 6-Lorentzian pool model, corresponding to proton pools at -3.5 and -1.6 ppm (Nuclear Overhauser Effect NOE), 0 ppm (water), 2.0 and 3.0 ppm (amine), and 3.5 ppm (amide). Z-spectra were also generated for each solution, along with calculation of MTR asymmetry using the following standard equation:
$$MTRasym(Δppm) = S(-Δppm) - S(Δppm)/S0$$
Injured SC tissue and normal rat SC tissue samples were submitted to the Vanderbilt Neurochemistry Core lab for neurochemical quantification via liquid chromatography/mass spectroscopy. Analytes of interest present in the SCI tissue were sorted based on concentration.
Results
The CEST axial orientation Z-spectra showed that the amplitude of the NOE peak (-1.6 ppm) during the first week post-op was significantly lower for SCI rats compared to sham rats (Figure 1)3. The Z-spectra spatial profiles in the coronal orientation showed that the amplitude of the 3.5 ppm CEST pool increases during week 1 post-injury for the SCI rats at the epicenter and rostral to the SCI, as shown in Figure 2. There were not significant changes in other peaks including around 3.0 ppm.Neurochemical analysis of SCI tissue identified the analytes of interest with the highest concentrations within the injured tissue. Table 1 lists the top 5 chemicals of interest, which includes important molecules involved in the neuroinflammatory process, such as glutamate, taurine, and GABA. The results show location dependent neurochemical concentration changes in SCI tissue.
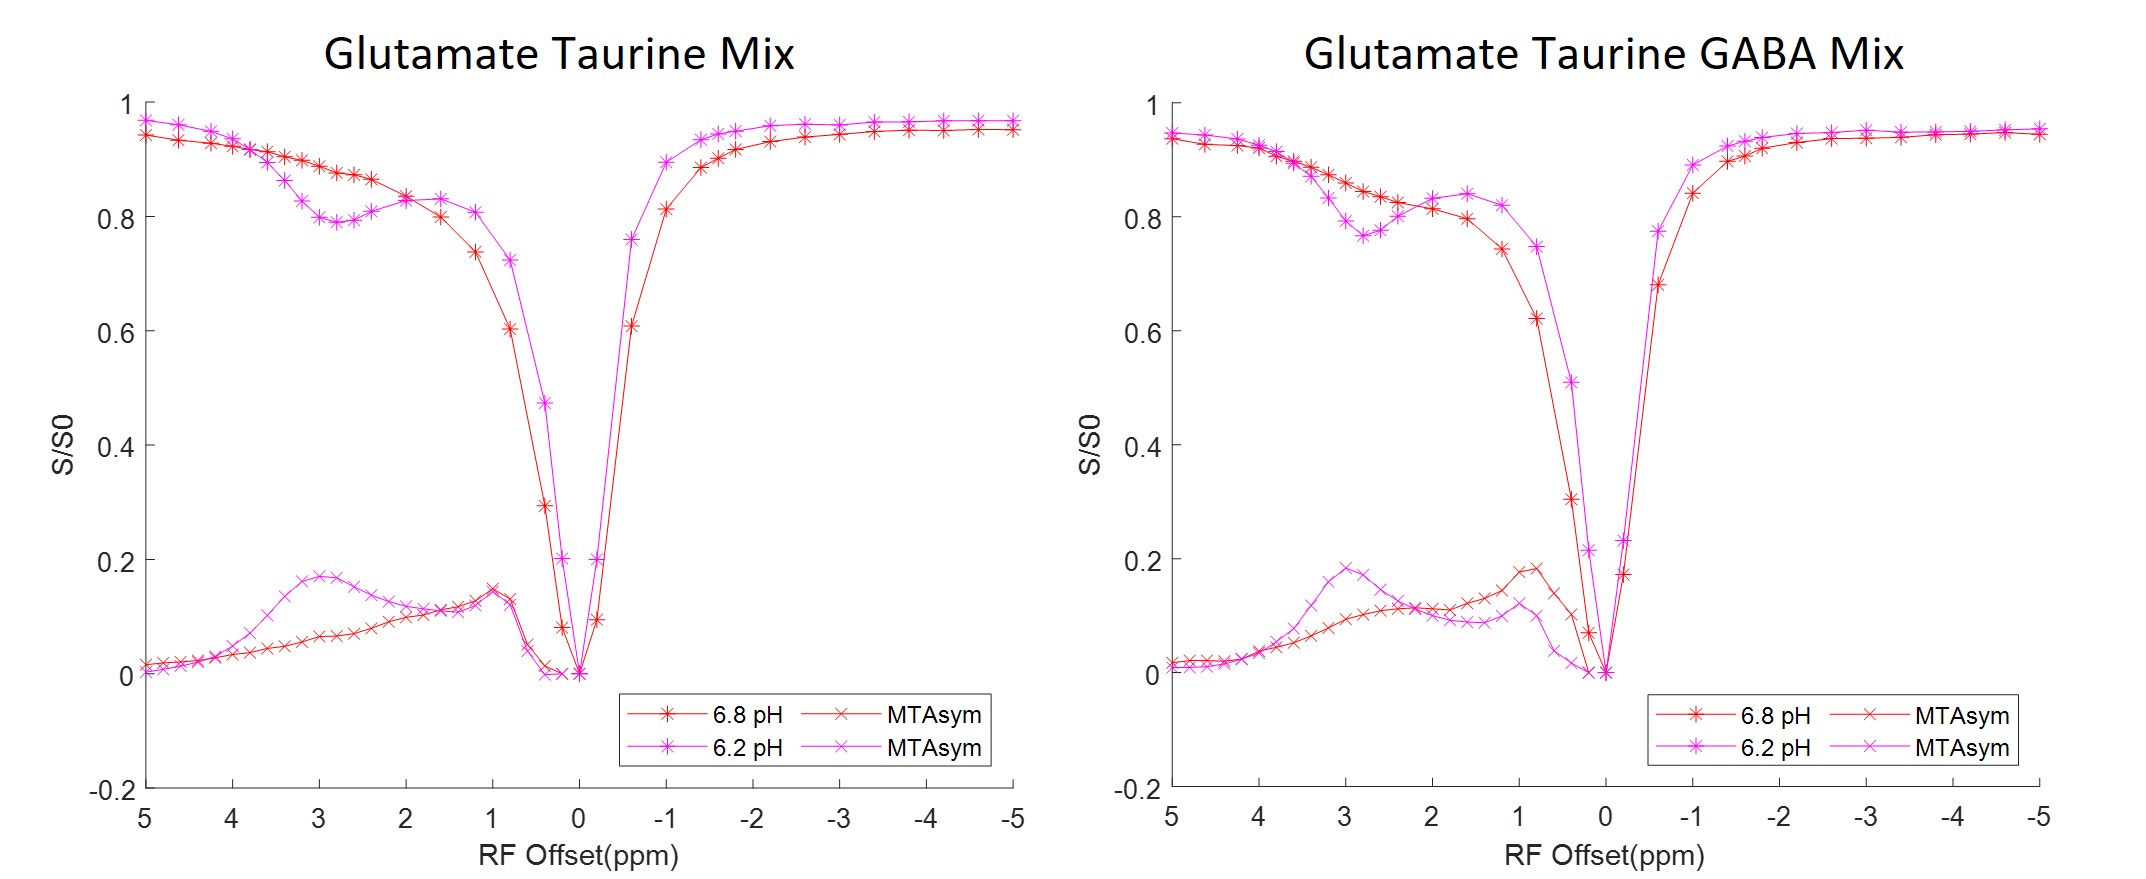
The Z-spectra acquired from each individual solution phantom at 3 different pH levels ranging from 6.2 to 7.4 are shown in Figure 3. Combinations of equal parts glutamate, taurine and GABA mixture solutions were also created at 6.2 and 6.8 pH. The corresponding Z-spectra are presented in Figure 4. All the Z-spectra showed prominent peaks around 3.0 ppm.
Discussion
The solution Z-spectra showed prominent peaks around 3.0 ppm but at the levels of the analytes found in tissue there were no corresponding increases in peaks within the injured cord. This confirms that the 3.5 ppm APT and NOE -1.6 ppm signal components of the Z-spectra in vivo cannot be explained by the analytes identified from neurochemical analysis. Incorporation of a 3.0 ppm component in the Z-spectra fittings potentially allows for monitoring neurochemical concentration changes that are prominent in SCIs, but these results demonstrate that CEST imaging is not sensitive nor specific enough at identifying small molecular concentration changes. The overlapping signals from glutamate, taurine, and GABA, make it impossible to differentiate individual neurochemical concentration changes.Conclusion
The exploratory results from the neurochemical analysis and in-vitro solutions study provided further information about the CEST Z-spectra we acquired from in-vivo spinal cord injured rats. The results are crucial towards improving optimization of the multi-Lorentzian pool fitting model and understanding the biomolecular mechanism behind the in-vivo CEST imaging results. This is important for validation of the CEST imaging biomarkers identified that will be used in future studies of animal models of SCI.Acknowledgements
One DoD grant (SC190134) funded the study. We thank Zou Yue and Chaohui Tang for their help in creating the injury model and assisting MRI scans. We also thank the Vanderbilt Neurochemistry Core lab for performing and processing the spinal cord tissue neurochemical analyses.References
1. Profyris, C. et al. Degenerative and regenerative mechanisms governing spinal cord injury. Neurobiol. Dis. 15, 415–436 (2004).
2. Badhiwala, J. H., Ahuja, C. S. & Fehlings, M. G. Time is spine: A review of translational advances in spinal cord injury. Journal of Neurosurgery: Spine vol. 30 1–18 (2019).
3. Mu, C. et al. Molecular MRI and PET Imaging Detect Biomarkers of Neuroinflammation in Contusion Injured Spinal Cord. in 2022 Joint Annual Meeting ISMRM-ESMRMB & ISMRT 31st Annual Meeting (2022).
4. Lee, J. S., Xia, D., Jerschow, A. & Regatte, R. R. In vitro study of endogenous CEST agents at 3 T and 7 T. Contrast Media Mol. Imaging 11, 4–14 (2016).
Figures
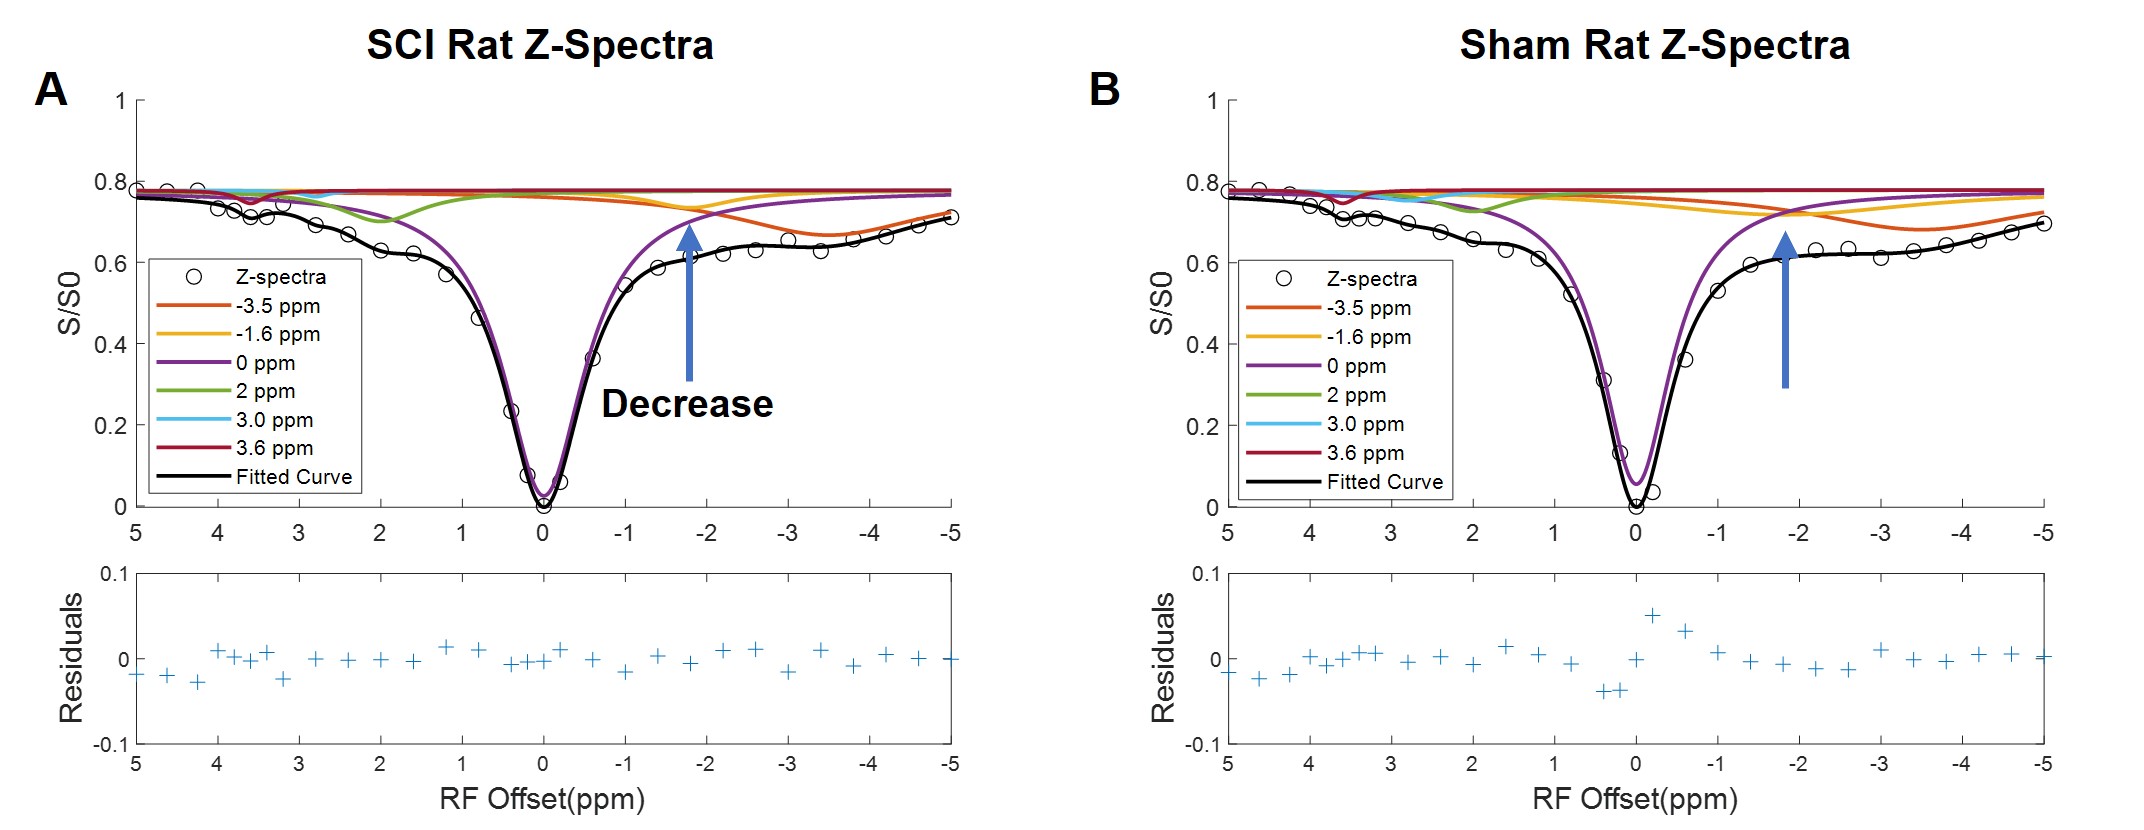
Fig. 1. CEST axial orientation Z-spectra from SCI rat, fitted to 6-Lorentzian pool model. (A&B) SCI and sham injury rat Z-spectra with model fitting Lorentzian curves, rostral to SCI. Decrease in the NOE -1.6 ppm pool was observed in the SCI rats, compared to the sham rat Z-spectra.
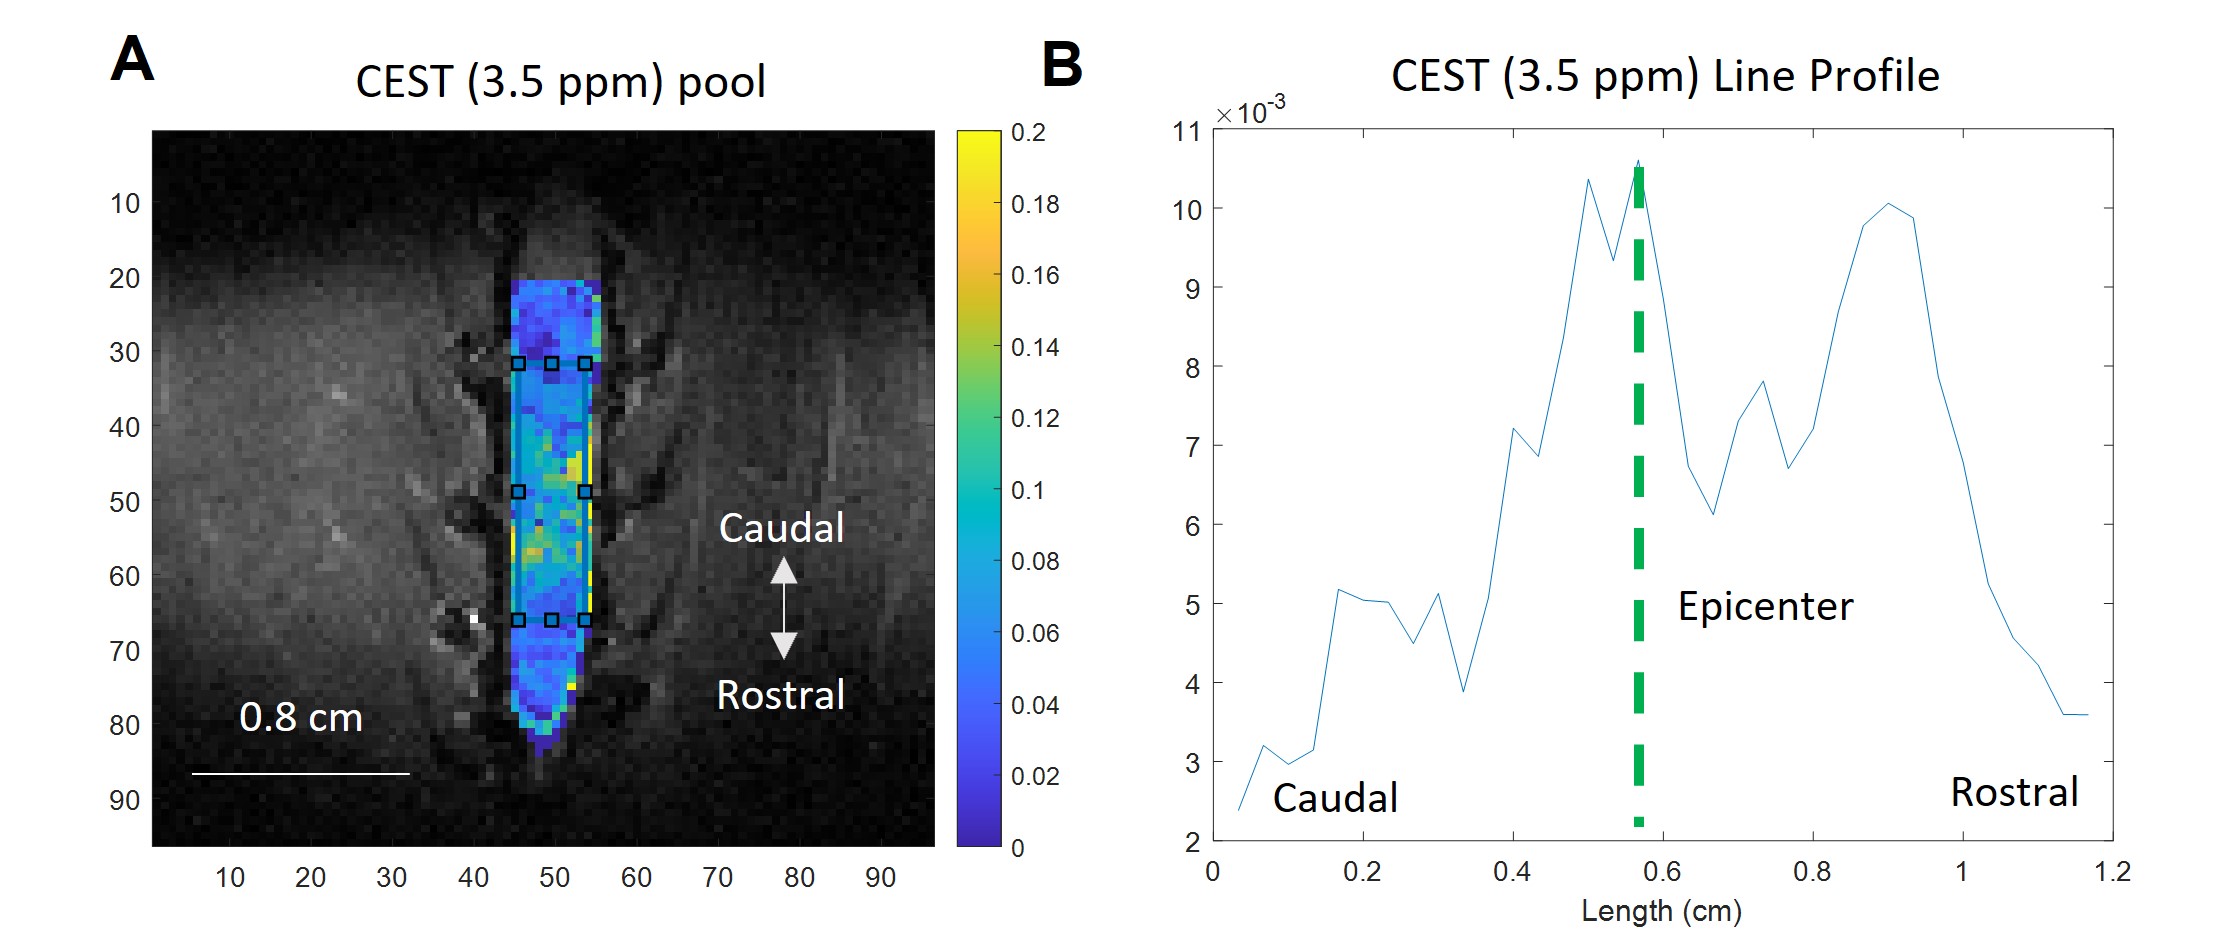
Fig. 2. (A) CEST coronal orientation 3.5 ppm pool map from SCI rat, generated using pixel-by-pixel fitting to 6-Lorentzian pool model. (B) Line profile of 3.5 ppm pool map, generated by defining a rectangular ROI with a fixed length of 1.2 cm, where the anatomical epicenter of the injury is located at the midpoint of the ROI. The line profile is calculated by averaging across the horizontal axis. The CEST (3.5 ppm) pool amplitude increases at the SCI epicenter and rostral to the injury site.
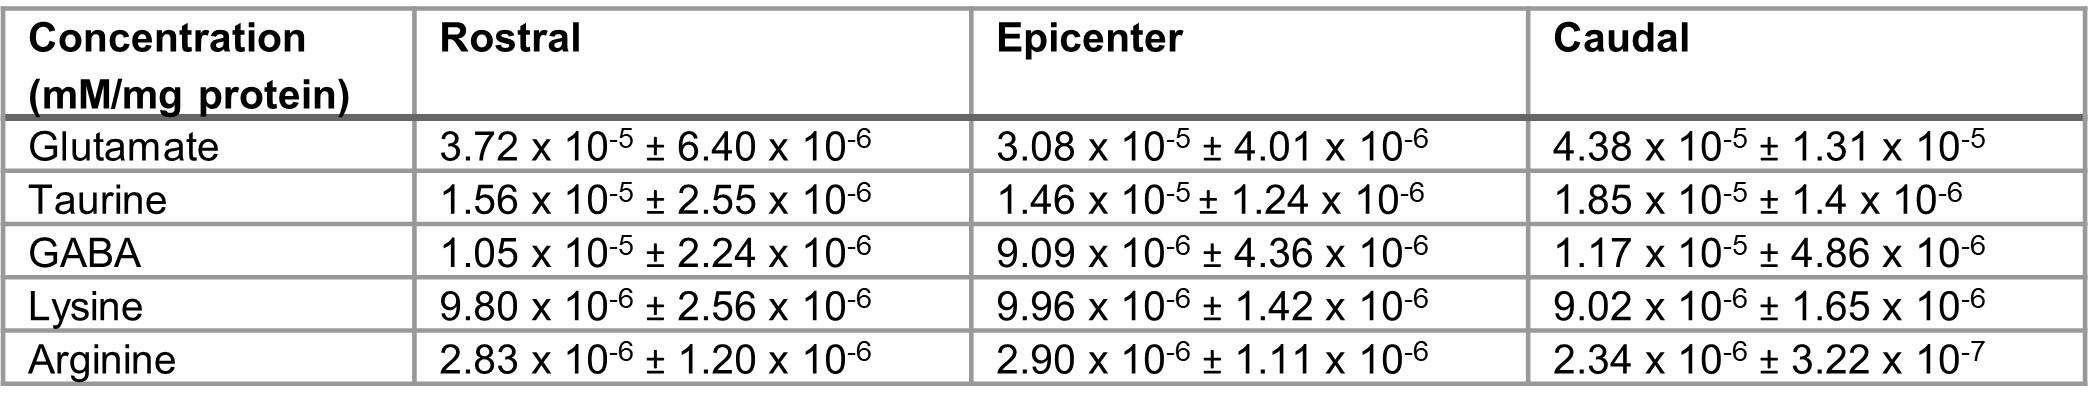
Table 1. Neurochemical analysis of injured rat SC tissue (N = 4). Analytes of interest present in high concentration are shown. Tissue samples were collected from 3 different regions of the lumbar spinal cord, rostral and caudal to the injury epicenter and at the epicenter. Average concentrations and standard deviation are presented.
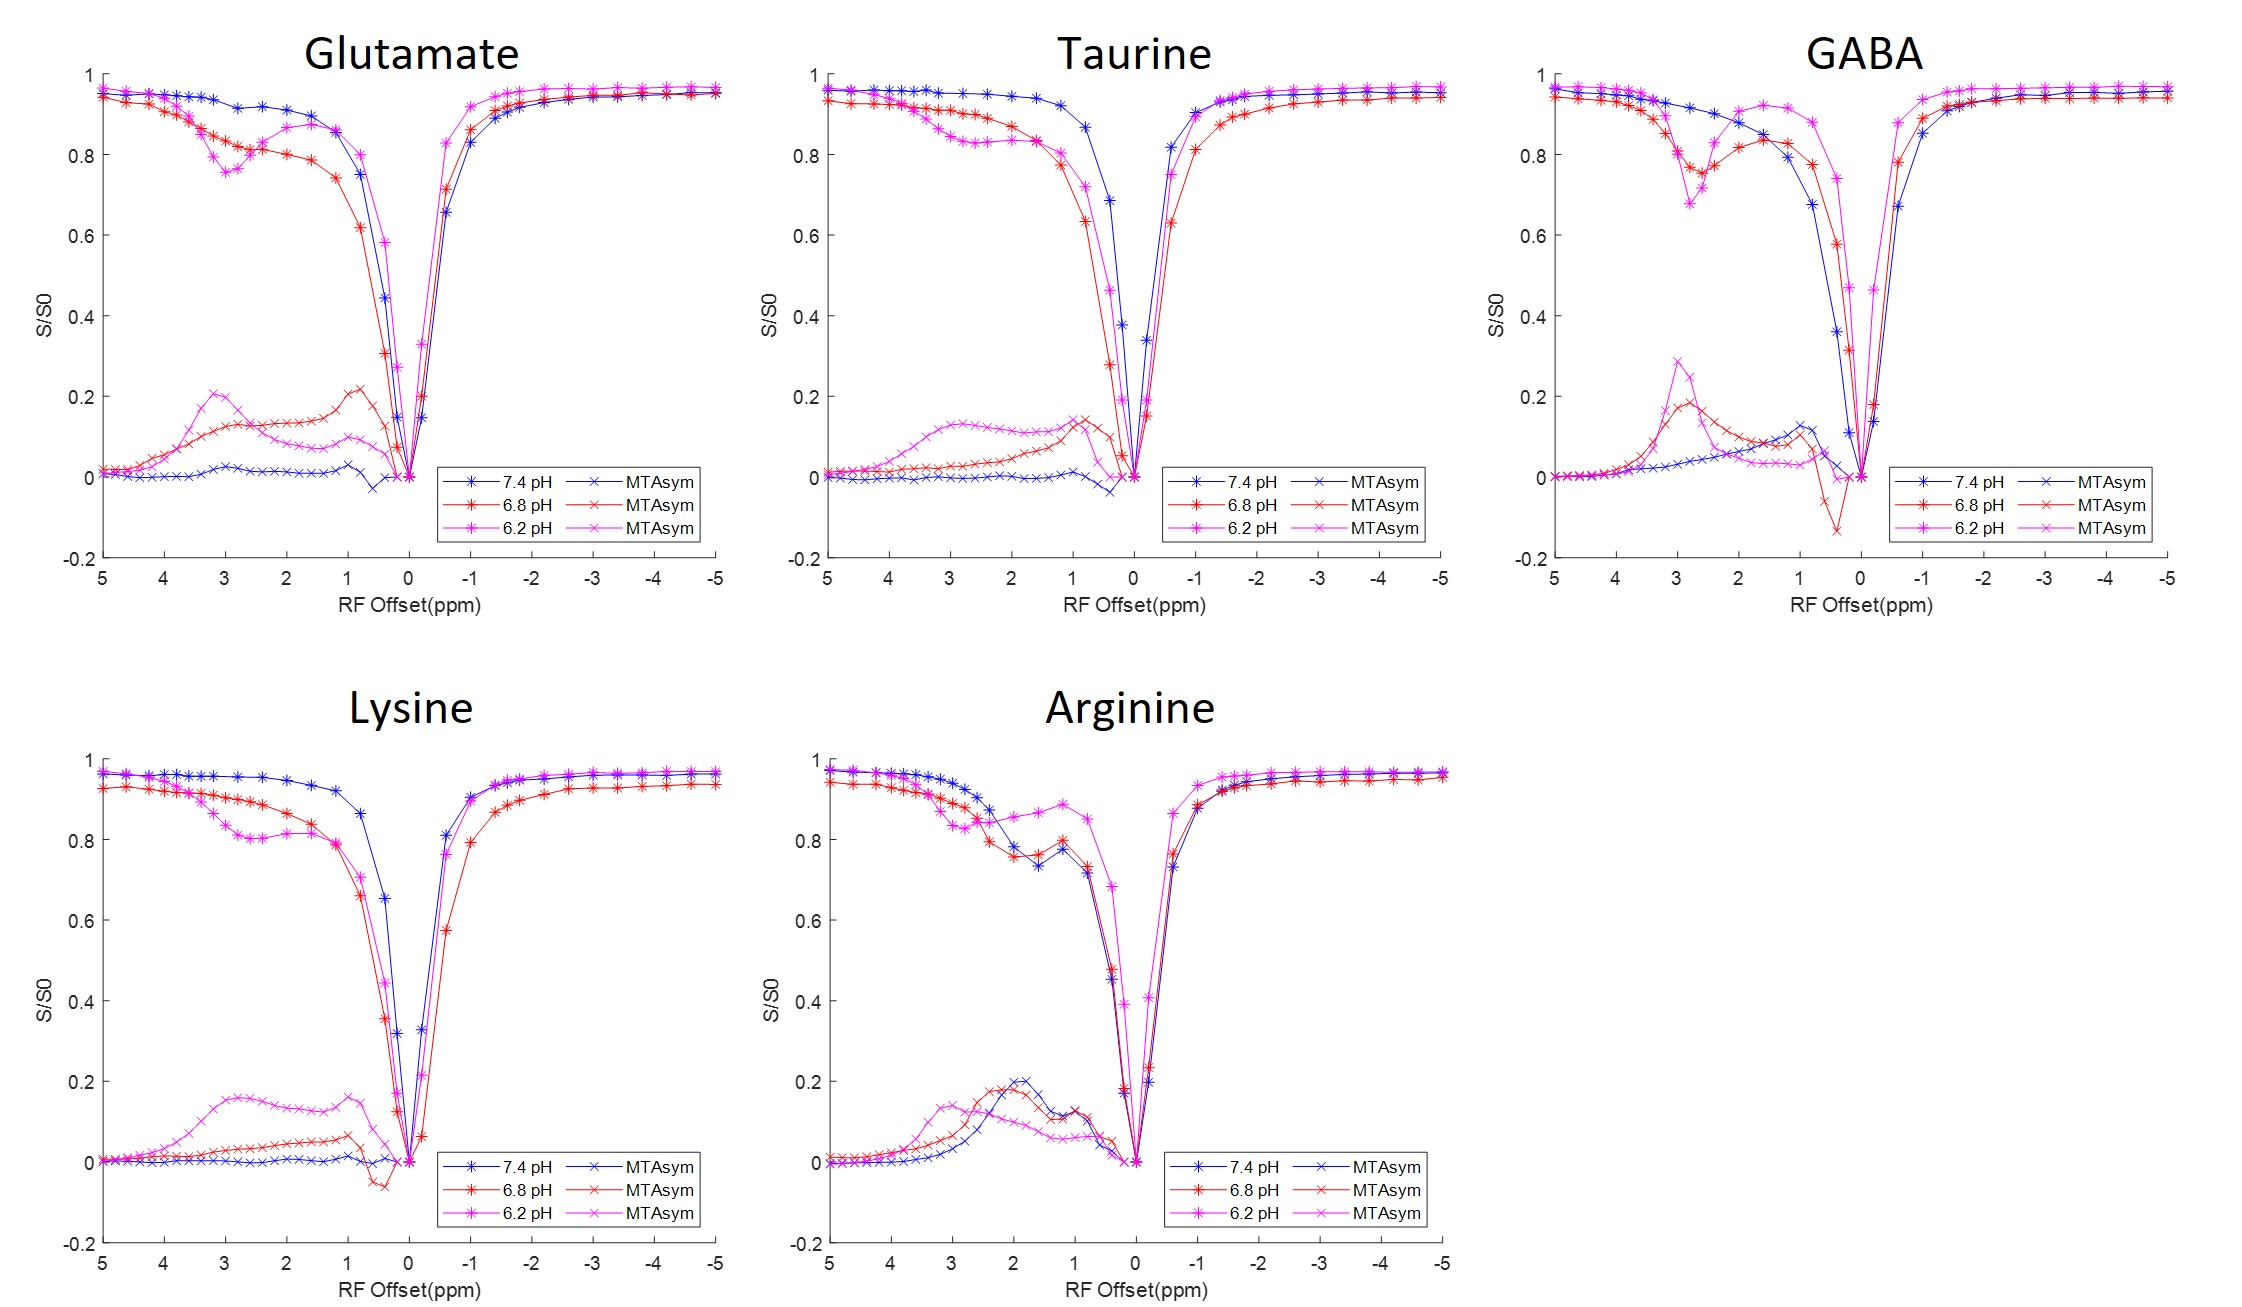
Fig. 3. CEST Z-spectra and calculated MTRasym for aqueous solutions including glutamate, taurine, GABA, lysine, and arginine. The Z-spectra show pool amplitude and MTRasym increase at around 3.0 ppm for most analytes, especially at lower pH levels. Each analyte has unique Z-spectra features that can be differentiated through MTRasym quantification.