3538
Brain MRI lesion heterogeneity and chronic active lesion density identify relapsing-remitting MS 5 years before onset of progressive disease1University of Calgary, Calgary, AB, Canada
Synopsis
Keywords: Multiple Sclerosis, Brain
Multiple sclerosis (MS) is a severe and heterogeneous disease. While disease worsening is common, the pattern of worsening varies between subjects. Mechanisms are unclear. This study assessed lesion heterogeneity and chronic active lesion activity in relapsing-remitting MS (RRMS) 5 years before conversion to secondary progressive MS (SPMS) as compared to stable disease. Based on brain MRI texture analysis and z-score of core versus rim diffusion in lesions, SPMS-converting patients have greater lesion damage and chronic active lesion density than stable patients 5 years prior. Combined approaches may help identify RRMS patients at high risk of worsening for early management.Introduction
Multiple sclerosis (MS) is a common and disabling disease of the central nervous system characterized by progressive worsening throughout the disease course and across clinical forms1. However, the pattern of worsening varies between subjects. Exact mechanisms are unclear. Most people start with the relapsing-remitting form (RRMS). Without management, 50% of RRMS worsens to secondary progressive form (SPMS) in 10-15 years where there is no effective treatment2. Focal lesions remain to be the hallmark of MS pathology, and the extent of chronic active lesions is a potentially new marker of MS progression3. Further, advanced MRI texture analysis and diffusion imaging techniques can detect diverse MS pathologies invisible to human eyes4-6. Based on these methods, this study aimed to assess the degree of lesion damage and presence of chronic active lesions in RRMS patients 5 years before conversion to SPMS.Methods
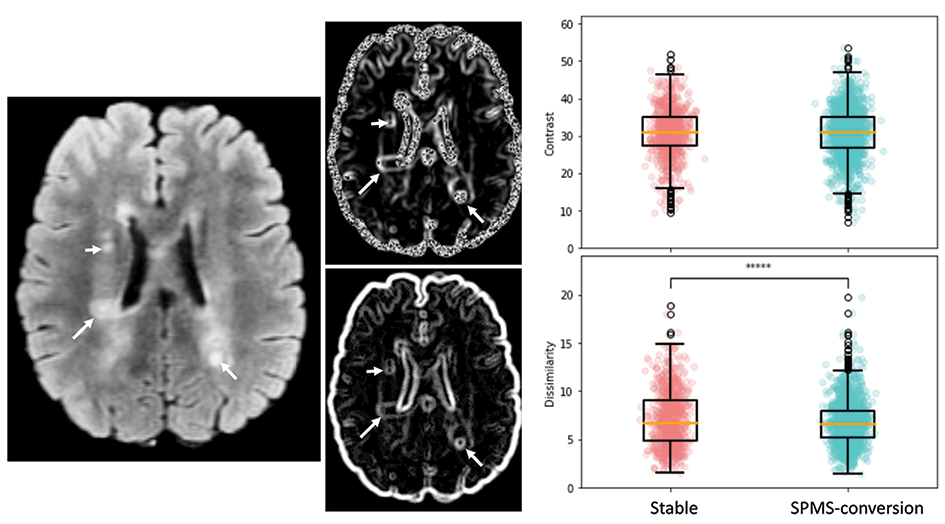
This study used data obtained from a clinical trial in RRMS of domperidone, a candidate remyelination agent. Study screening involved >200 patients, all under standard clinical care and treatment. At 5-year follow-up, 11 of the RRMS patients worsened to SPMS. To compare, 11 other RRMS patients with matching age, sex, disease duration, disability score, and treatment type at screening but stayed stable over the same follow-up period were identified. All groups had screening brain MRI at a 3T scanner (GE Healthcare, Milwaukee, USA), including T1-weighted and FLAIR images, and diffusion tensor imaging (DTI). T1 MRI used a MPRAGE sequence with 1-mm isotropic voxels, TR=8ms and TE=3ms. FLAIR MRI applied a spin-echo inversion recovery sequence with TR=~6000 ms; TE=127ms; matrix=512x512, and FOV=24x24 cm2. Diffusion MRI applied a spin-echo echo-planar sequence with TR=8000 ms; TE=~61ms; matrix=120x120, FOV=24x24 cm2, slice thickness=2mm, 3 b0, and 45 b=1000 s/mm2 directions.All images were preprocessed. This started with brain extraction and intra-patient co-registration (to pre-contrast T1-weihted MRI) using FSL (FMRIB, Oxford, UK). Lesion identification used the prepared T1 and FLAIR images based on a semi-automatic software (SPM, v12). Texture analysis focused on FLAIR MRI following noise reduction with median and mean filters implemented in ImageJ (NIH, v1.50I). Texture calculation applied an optimized statistical method known as gray level co-occurrence matrix (GLCM), with 2 histology-verified texture measures derived: contrast and dissimilarity, indicating tissue coarseness and heterogeneity respectively7. Lesion texture averaged from all calculated directions was extracted (Figure 1).
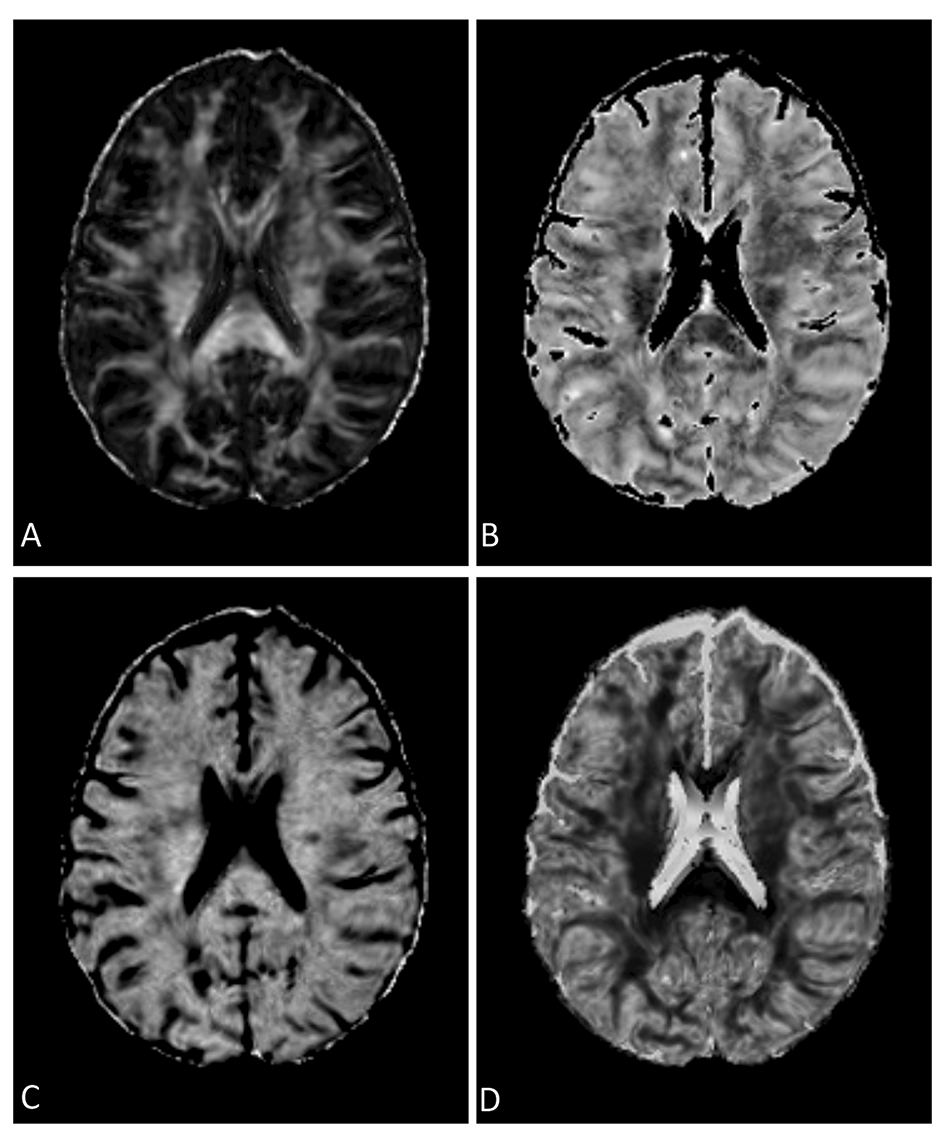
The DTI images were then corrected for noise and bias field8,9. Further, to enable high angular resolution diffusion imaging (HARDI) analysis, new diffusion data at b=2000 s/mm2 were predicted from b1000 data using an in-house deep learning algorithm10. DTI analysis focused on fractional anisotropy (FA) using FSL. HARDI analysis applied the ActiveAx method implemented in the accelerated microstructure imaging with convex optimization (AMICO) method for crossing fibers to estimate axonal diameter, intracellular volume fraction (ICVF), and orientation dispersion (ODI)11. All variables were transformed to the MNI-152 space for consistency using the ANTs technique (Figure 2).
Determining chronic active lesion activity used a z-score scheme developed recently based on diffusion measures of core-rim dichotomy of the lesions12. Lesion rim was an one-voxel-thick mask, and the remaining voxels formed the core. A z-score was computed using this equation: (mean core-mean rim)/standard deviation rim. A non-zero z-score indicated unequal core and rim pathology, and hence chronic active lesions. To improve reliability, quantitative comparisons focused on z scores ranged 0.5 to 1.5.
Results
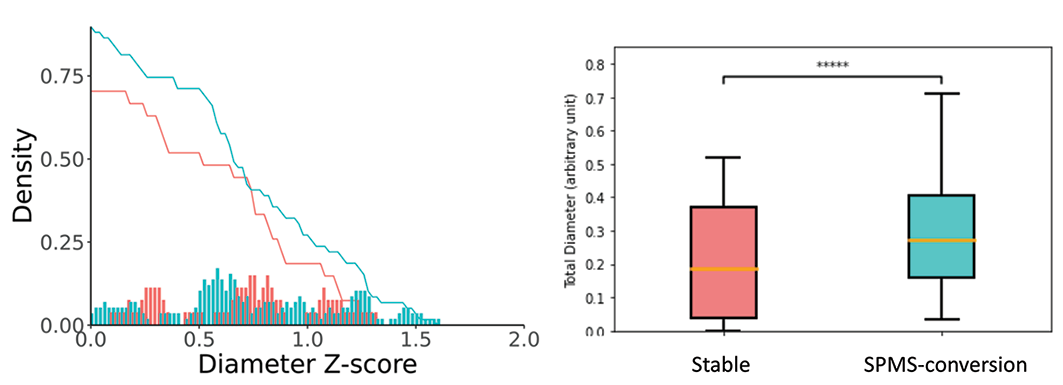
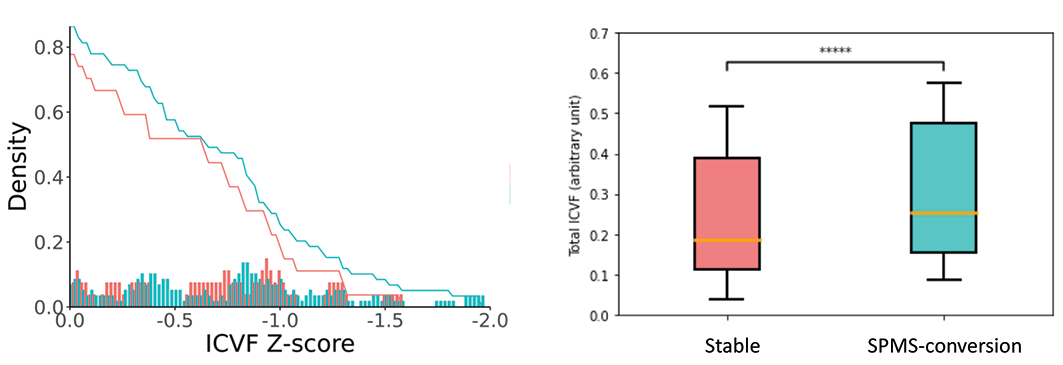
The mean screening age was 55 years for both groups, 4 males each. Between SPMS-converted and stable groups, the disability score was 3.8 versus 3.2, and disease duration was ~16 versus 19 years. Paired Student’s t-test showed that lesion texture dissimilarity was greater in SPMS-converted than stable RRMS [mean (standard deviation) = 7.12 (2.9) versus 6.71 (2.2), p=0.0003]. Contrast was not different [30.87 (6.6)versus 30.78 (6.4), p=0.7] (see Figure 1). The FLAIR lesion number was less in SPMS-converted than stable group [74 (82) and 149 (158)]. In z score analyses, there was greater chronic lesions in SPMS-converted than stable RRMS patients, based on both axonal diameter and ICVF HARDI measures (p<0.0001; Figures 3&4). The z-score distributions based on other diffusion measures were not significant or inconsistent.Discussions
Previously postmortem brain MRI studies confirmed that texture contrast and dissimilarity were top-performing measures in differentiating de- and re-myelinated lesions in MS7. The greater dissimilarity in SPMS-converted than stable patients here at screening may suggest greater demyelination, which appears detectible 5 years before clinically significant disease progression. Likewise, ICVF is a measure of neurite density, such as myelin content13. With demyelination, the neuronal signal-transmitting capacity reduces and axonal diameter might modify to compensate. Therefore, the overall findings in this study may suggest an early significant increase in demyelination that drives the accelerated worsening in at-risk RRMS subjects.Conclusion
Significant pathological changes seem to occur in RRMS patients 5 years before conversion to SPMS, which is detectable using robust brain MRI texture analysis and diffusion processing methods. With the availability of >14 approved therapies for RRMS, early identification of patients who have a high risk of SPMS development would allow early aggressive treatment to improve prognosis.Acknowledgements
We thank the patient volunteers for their participation in the study. This research involves funding from the MS Society of Canada and Canadian Institutes of Health Research.References
1. Bagnato F, Gauthier SA, Laule C, et al. Imaging Mechanisms of Disease Progression in Multiple Sclerosis: Beyond Brain Atrophy. J Neuroimaging 2020; 30: 251–266.
2. Dutta R, Trapp BD. Relapsing and progressive forms of multiple sclerosis. Curr Opin Neurol 2014; 27: 271–278.
3. Absinta M, Sati P, Masuzzo F, et al. Association of Chronic Active Multiple Sclerosis Lesions with Disability in Vivo. JAMA Neurol 2019; 76: 1474–1483.
4. Haralick RM, Shanmugam K, and Dinstein IH. Textural features for image classification. IEEE Transactions on systems, man, and cybernetics. 1973; 6: 610-621.
5. Zhang Y, Zhu H, Mitchell JR, et al. T2 MRI texture analysis is a sensitive measure of tissue injury and recovery resulting from acute inflammatory lesions in multiple sclerosis. Neuroimage 2009; 47: 107-111.
6. Harrison DM, Caffo BS, Shiee N, et al. Longitudinal changes in diffusion tensor-based quantitative MRI in multiple sclerosis. Neurology 2011; 76: 179–186.
7. Hosseinpour Z, Jonkman L, Oladosu O, et al. Texture analysis in brain T2 and diffusion MRI differentiates histology-verified grey and white matter pathology types in multiple sclerosis. Journal of Neuroscience Methods 2012; 379: 109671.
8. Veraart J, Fleremans E, Novikov DS. Diffusion MRI noise mapping using random matrix theory. Magn Reson Med 2016; 76: 1582–1593.
9. Tournier JD, Smith R, Raffelt D, et al. MRtrix3: A fast, flexible and open software framework for medical image processing and visualisation. Neuroimage 2019; 202: 116137.
10. Murray C, Oladosu O, Zhang Y. Prediction of new diffusion MRI data is feasible using robust machine learning algorithms for multi-shell HARDI in a clinical setting. In: International Society of Magnetic Resonance in Medicine 31st annual meeting. London, 2022.
11. Daducci A, Canales-Rodríguez EJ, Zhang H, et al. Accelerated Microstructure Imaging via Convex Optimization (AMICO) from diffusion MRI data. Neuroimage 2015; 105: 32–44.
12. Oladosu O, Liu W-Q, Brown LN, et al. Advanced diffusion MRI and image texture analysis detect wide-spread brain structural differences between relapsing-remitting and secondary progressive multiple sclerosis. Front Hum Neurosci. In press.
13. Zhang H, Schneider T, Wheeler-Kingshott CA, et al. NODDI: practical in vivo neurite orientation dispersion and density imaging of the human brain. Neuroimage 2012; 61: 1000-16.
Figures