3537
Novel contribution of non-enhanced MRI to neuroradiologists for detecting neuromyelitis optica spectrum disorder-associated optic neuritis1Radiology, Tongji Hospital, Tongji Medical College, Huazhong University of Science and Technology, Wuhan, China
Synopsis
Keywords: Neuroinflammation, Neuroinflammation
The sensitivity of MRI in detecting optic neuritis (ON) including neuromyelitis optica spectrum disorder-associated ON (NMOSD-ON) is inadequate, and the diagnostic criteria have limitations due to inherent defects in signal intensity. In this study, we quantitatively assessed the role of intrathecal cerebrospinal fluid and diameter and curvature of anterior visual pathway in the diagnosis of NMOSD-ON by nomogram using non-enhanced MRI. The altered MRI parameters showed significant associations with visual functional system scores. Our study elucidates the novel contribution of non-enhanced MRI in the detection of NMOSD-ON, which assists to solve the problem of insufficient sensitivity of MRI for ON.Introduction
Optic neuritis (ON) is the first clinical symptom in more than half of NMOSD patients and persistent and profound visual loss is a hallmark of it[1]. The neuroimaging feature of NMOSD-ON published by the International Panel for NMO Diagnosis (IPND) is unilateral or bilateral increased T2 signal or T1 gadolinium enhancement within optic nerve or optic chiasm[2], which may have some limitations due to inherent defects in signal intensity. While the enlargement of optic nerve subarachnoid space, the bending of the optic nerve sheath and optic atrophy have received more and more attention in optic neuropathy[3-5]. The purpose of this study was to improve the accuracy of the diagnosis of NMOSD-ON through quantifying the features of anterior visual pathway more than just signal intensity in NMOSD patients with and without ON by non-enhanced MRI. This will assist neuroradiologists to evaluate optic nerve involvement and its extent in NMOSD from more perspectives in their daily work.Methods
Patients: Sixty-four NMOSD (46 NMOSD-ON; 18 NMOSD-NON) participants and twenty-seven healthy volunteers were recruited. All patients underwent a complete neurologic examination including disability assessment through the Expanded Disability Status Scale (EDSS). Imaging: MR examinations were performed on 3T scanners (Discovery 750, GE Healthcare, Milwaukee, WI, USA) with 32Ch head coils. The imaging protocol included the axial, coronal and sagittal T2-weighted IDEAL. Data processing: All measurements were obtained using the ANALYZE image software package, integrated in the GE HDAW v. 4.4 workstation (GE Health-care). The optic nerve sheath diameter (ONSD), optic nerve diameter (OND) and signal intensity ratio (SIR) were measured at 3 mm and 6 mm behind the eyeball on coronal T2 IDEAL water images; the optic nerve subarachnoid space (ONSS) was calculated using ONSS = ONSD−OND. The optic nerve sheath tortuosity (ONST) was defined as the length of the optic nerve central line segment (intraorbital segment for all eyes in this study) divided by the distance between 2 endpoints of the line segment (minimum path in the axial MRI image). We outline the temporal and nasal boundaries of the optic nerve in MATLAB, and the ratio is automatically calculated by the custom-written application. In addition, the diameter of the intracranial segment of the optic nerve (IOND) and optic tract (OTD) was also measured.All statistical analyses were performed with the SPSS statistical software package (version 25, IBM Corp., Armonk, NY, USA) and R version 4.2.0 (R Foundation). On the basis of the results from the regression analysis, we constructed a nomogram for ON probability.Results
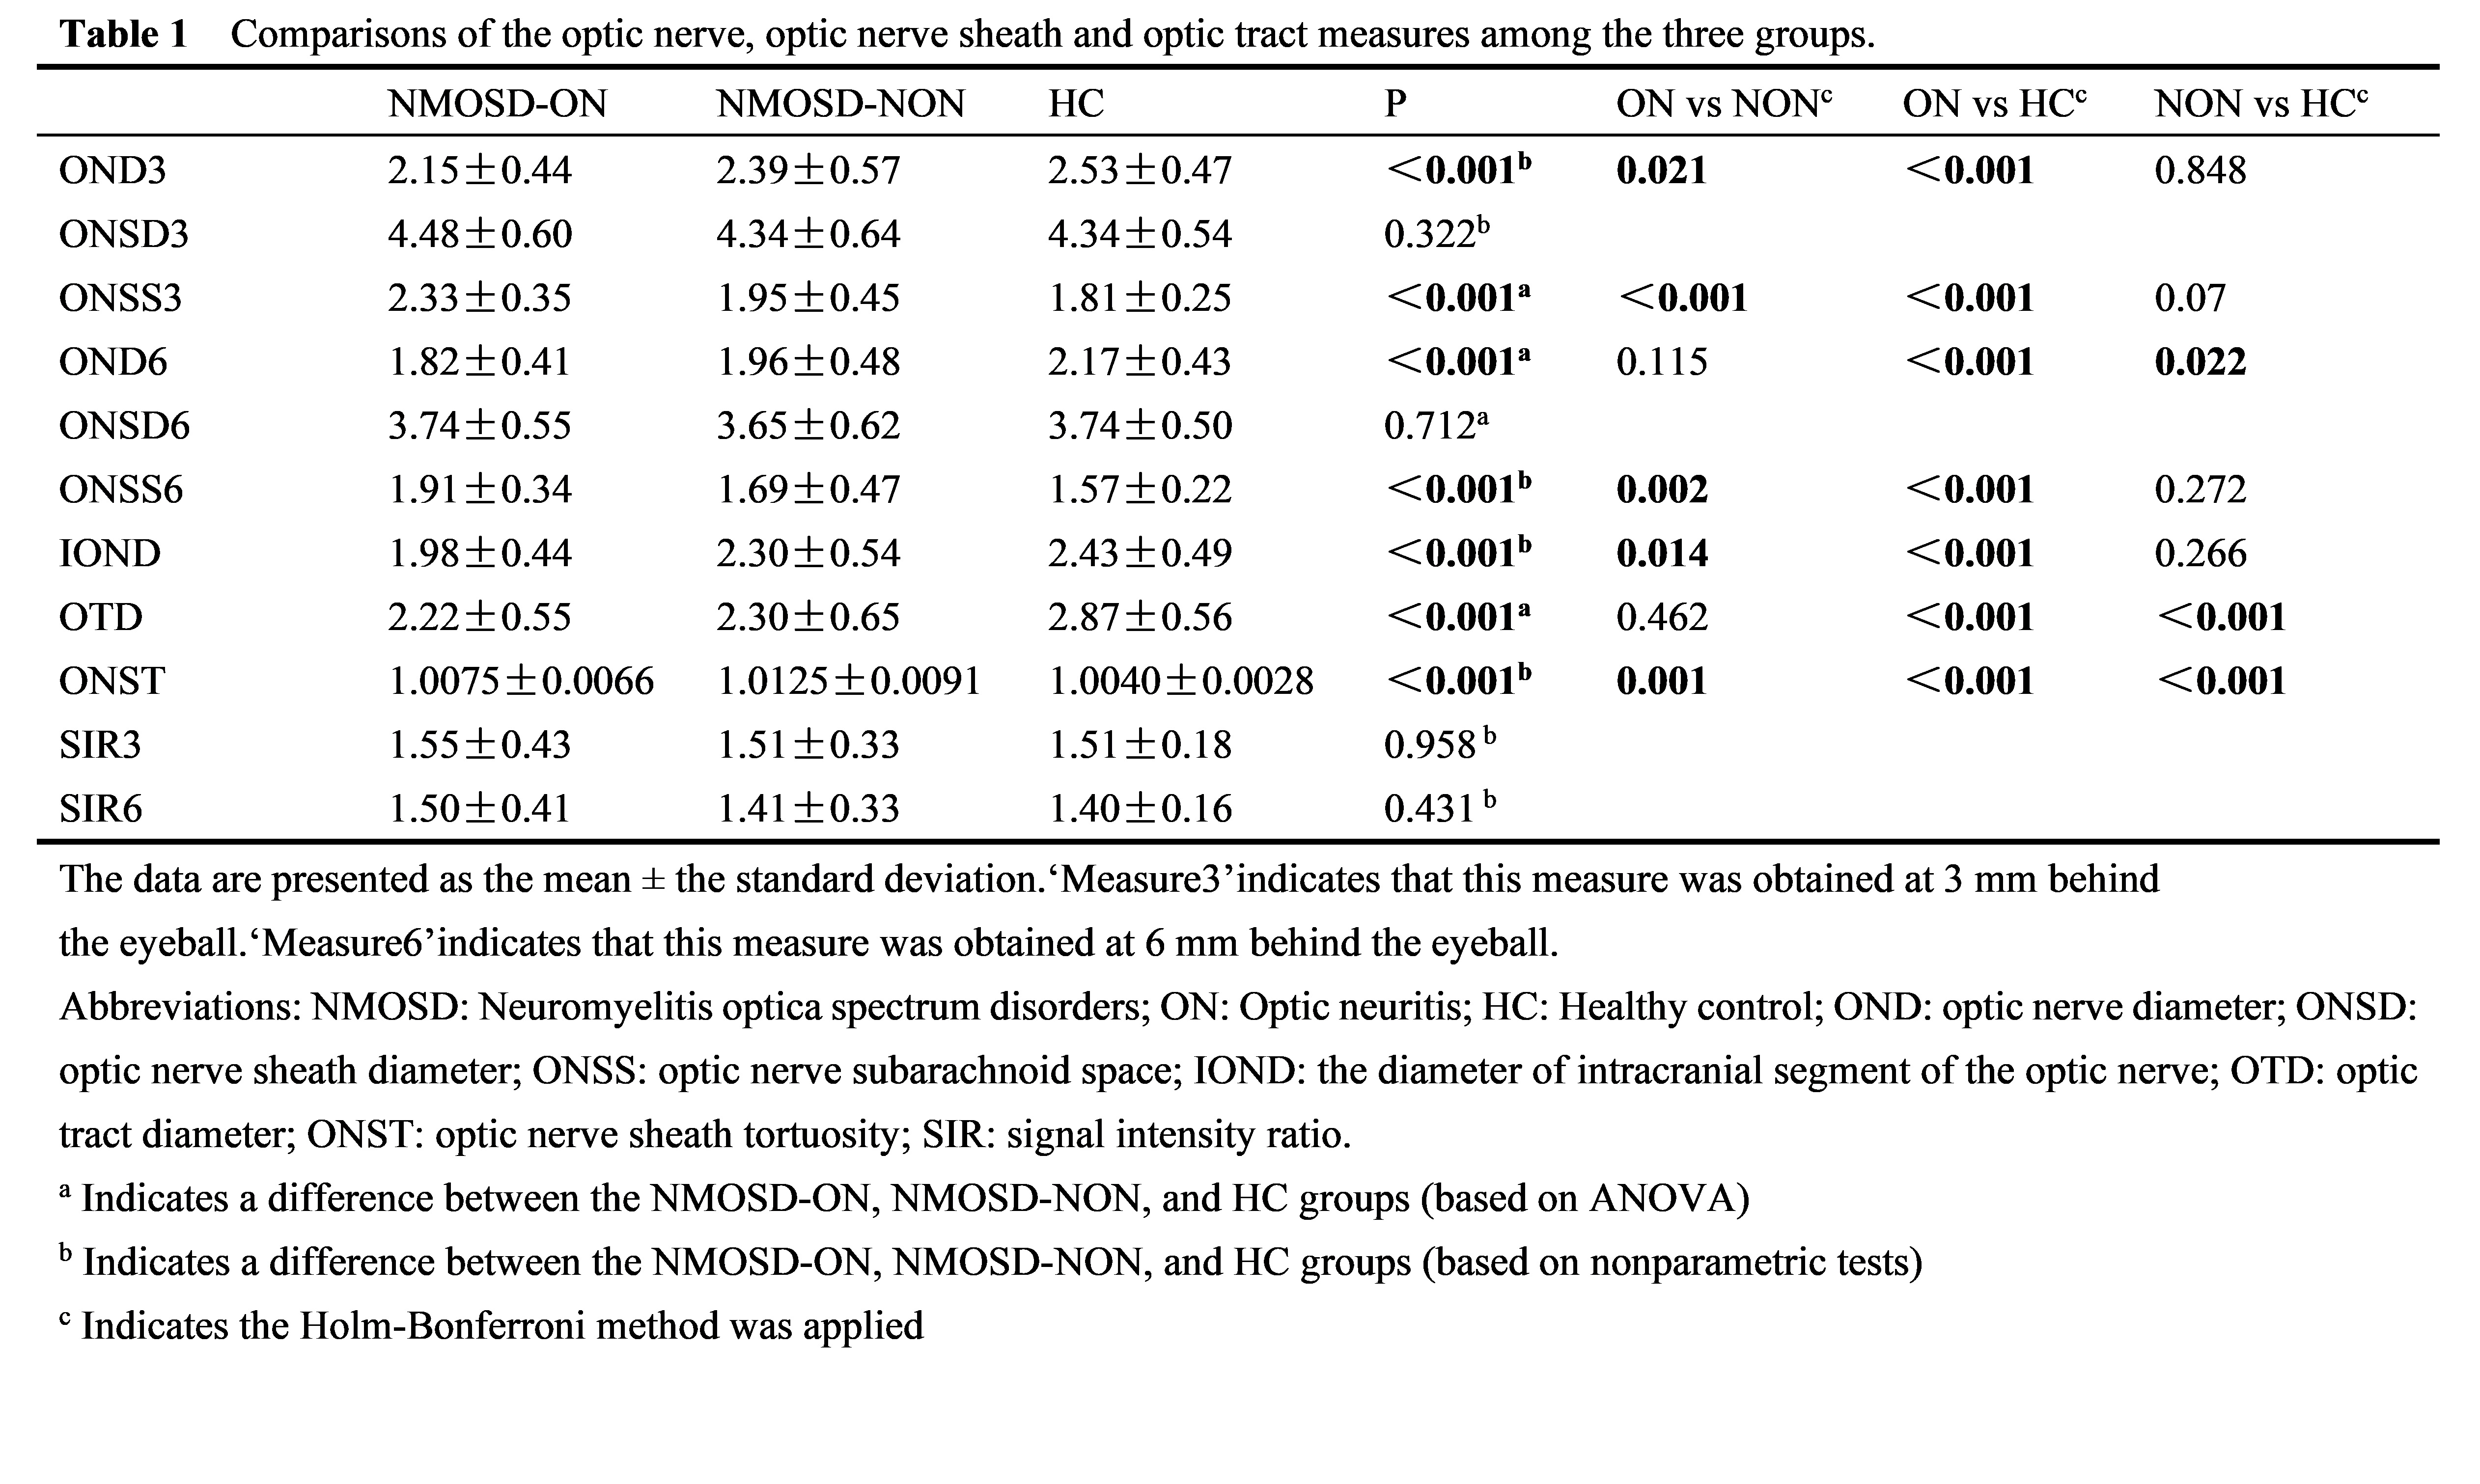
1) The OND3 and IOND were reduced in the NMOSD-ON group than in the NMOSD-NON and HC groups. NMOSD-ON and NMOSD-NON groups exhibited reduced OND6 and OTD compared to the HC group. Compared with the NMOSD-NON and HC groups, ONSS3 and ONSS6 in the NMOSD-ON group were increased(Table 1).2) There was a tendency of gradually increased ONST from controls, NMOSD-ON and NMOSD-NON(Table 1).
3) There were no differences in SIR among the three groups (Table 1).
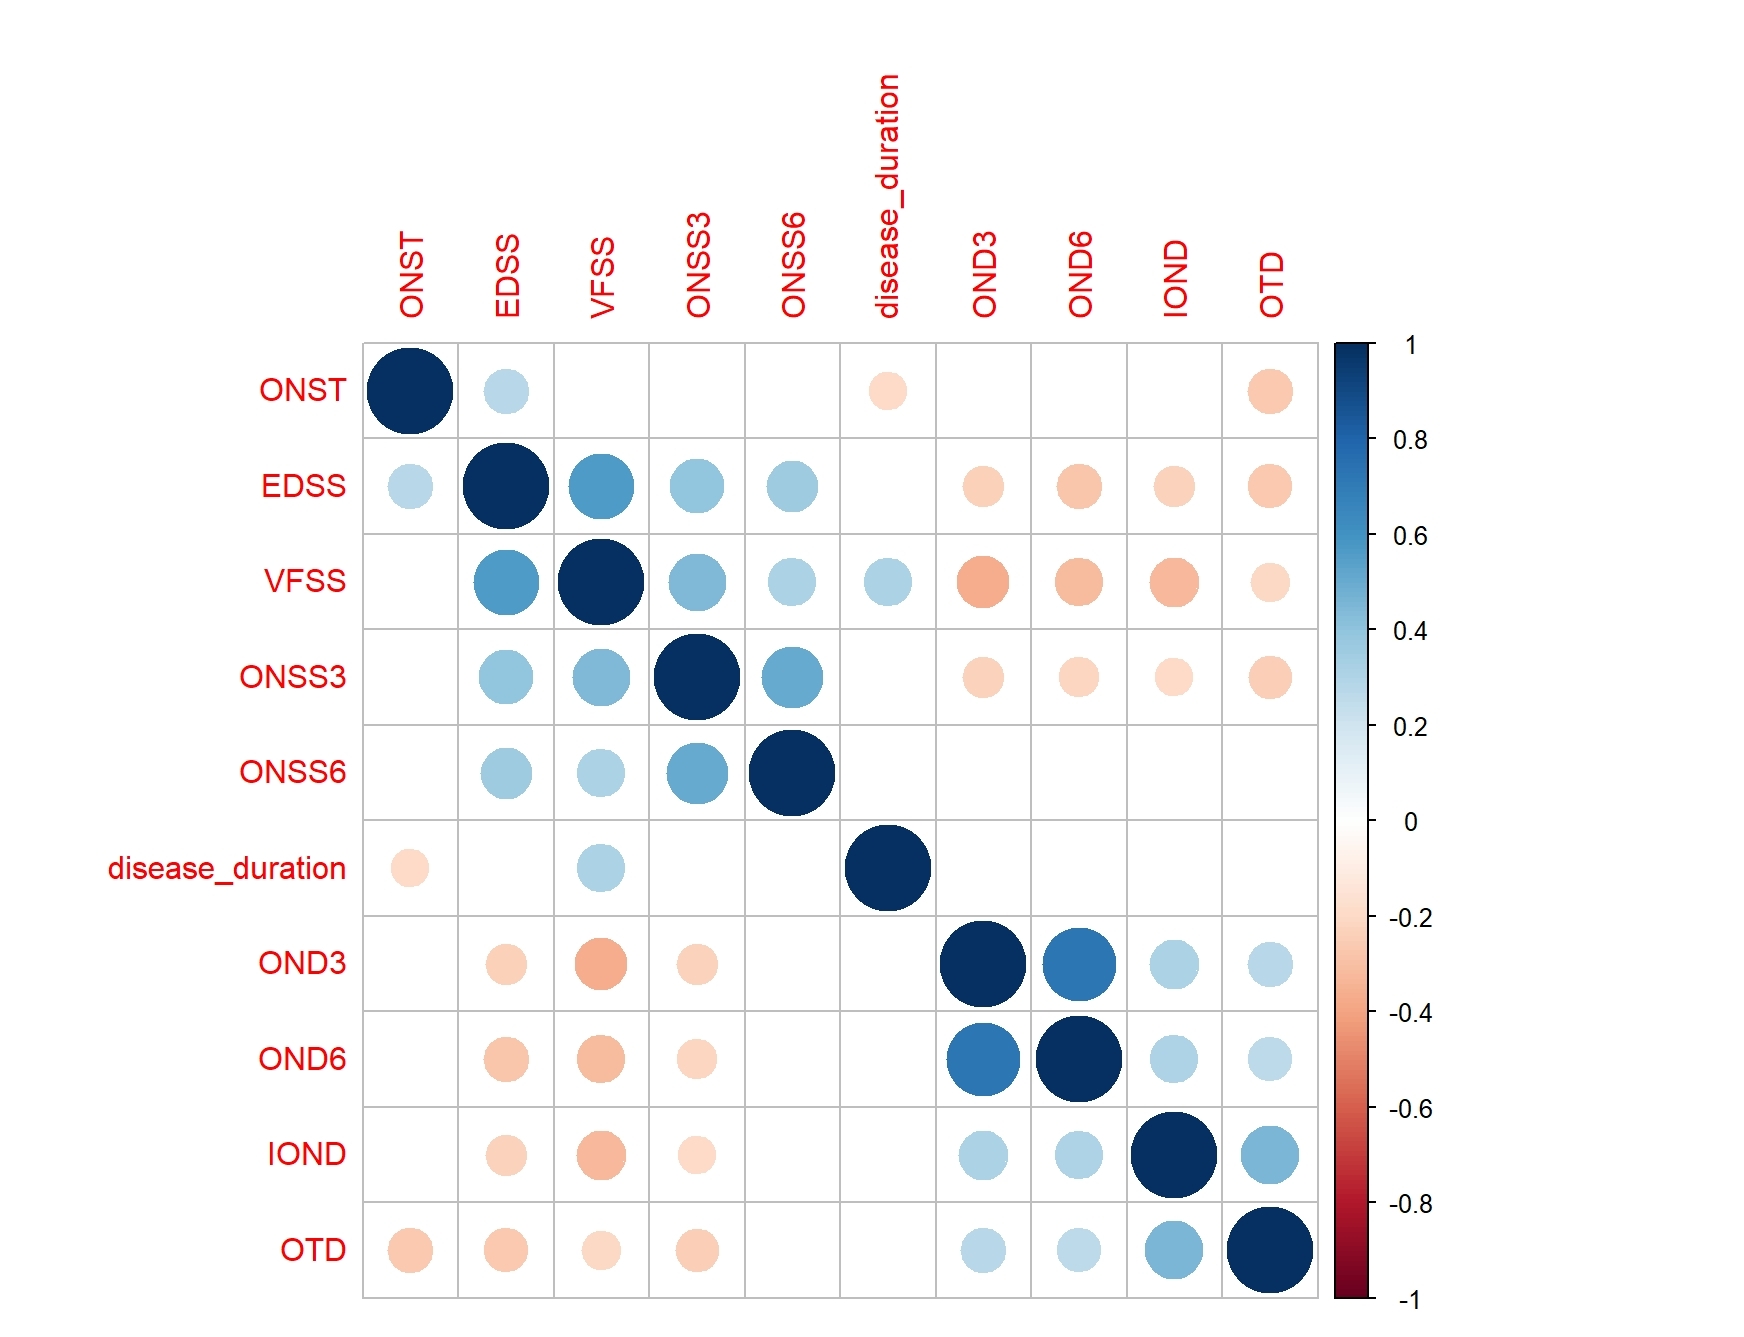
4) The visual FS score was negatively correlated with OND3, OND6, IOND, ONST and positively correlated with ONSS3 (Figure 1).
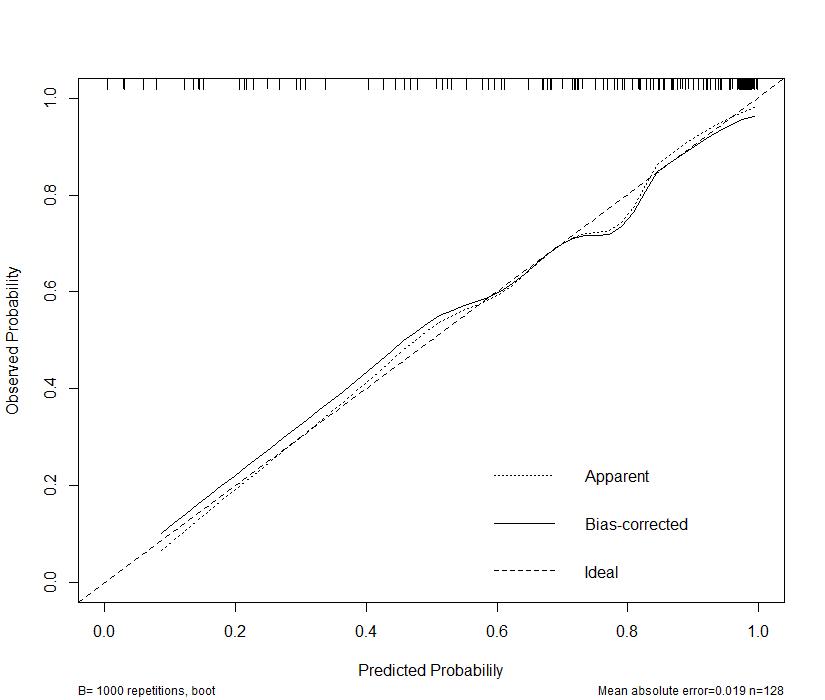
5) Disease duration, ONSS3, IOND and ONST were identified and entered into the nomogram.The nomogram showed a robust discrimination, with the C-index of 0.874(Figure2,3).
Discussion
We created an intuitive and simple graph of a statistical prediction model that quantifies the risk of ON, thereby supporting clinicians when making a diagnosis of ON for patients with NMOSD. Importantly, our nomogram predicts patient-specific probabilities of ON with optimal discrimination and excellent calibration, and the C index is 0.874. This overcomes the inaccuracy of diagnosis caused by the instability of signal strength. Our study found that NMOSD-NON also had changes in ONST and OTD. According to the speculation of previous study, the pathogenesis of the anterior visual pathway in NMOSD may be caused by some neurodegenerative processes, including primary neuroaxonal pathology via AQP4 antibody mediated pathology of astrocytes, independent of a history of ON[6]. This primary astrocytopathy may be responsible for the changes in the NMOSD-NON group. This pathological change is limited to the optic pathway, whereas ON could involve the optic nerve sheath[6], leading to the thickening of the sheath and the increase of elastic resistance, thus further cause a less profound increase in ONST than in the NON group. Our study observed an increase in the CSF in the optic nerve sheath in the ON group, which may be due to the obstruction of ocular glymphatic circulation in ON patients, resulting in difficulty in removing autoantibodies from the interstitial fluid, thereby exacerbating the disease[7]. In addition, the increase of CSF is also caused by the atrophy and thinning of the optic nerve leading to the enlargement of the subarachnoid space.Conclusion
Evaluation of the optic nerve and its sheath on conventional non-contrast MRI used in our study is available and has high diagnostic value for NMOSD-ON, which assists to solve the problem of low sensitivity of MRI in detecting ON. In addition, the correlation between radiological assessments and clinical visual functional system scores suggests that MRI may serve as a tool to monitor the disease and facilitate better management of optic neuritis.Acknowledgements
This study has received funding by grant from the National Natural Science Foundation of China (No. 81771793).References
1. Jarius, S., et al., Neuromyelitis optica. Nat Rev Dis Primers, 2020. 6(1): p. 85.
2. Wingerchuk, D.M., et al., international consensus diagnostic criteria for neuromyelitis optica spectrum disorders. Neurology, 2015. 85(2): p. 177-89.
3. Wang, X., et al., Optic Nerve Tortuosity and Globe Proptosis in Normal and Glaucoma Subjects. J Glaucoma, 2019. 28(8): p. 691-696.
4. Wu, H., et al., The diagnostic value of the IDEAL-T2WI sequence in dysthyroid optic neuropathy: a quantitative analysis of the optic nerve and cerebrospinal fluid in the optic nerve sheath. Eur Radiol, 2021. 31(10): p. 7419-7428.
5. Schroeder, C., et al., Atrophy of optic nerve detected by transorbital sonography in patients with demyelinating diseases of the central nervous system. Eur J Neurol, 2020. 27(4): p. 626-632.
6. Hokari, M., et al., Clinicopathological features in anterior visual pathway in neuromyelitis optica. Ann Neurol, 2016. 79(4): p. 605-24.
7. Klostranec, J.M., et al., Current Concepts in Intracranial Interstitial Fluid Transport and the Glymphatic System: Part I-Anatomy and Physiology. Radiology, 2021. 301(3): p. 502-514.
Figures