3536
Evaluation of an Image Contrast-Agnostic Brain MRI Segmentation Tool on a Heterogeneous Pediatric Clinical Cohort1Berlin Ultrahigh Field Facility, Max Delbruck Center, Berlin, Germany, 2Department of Paediatric Neurology, Children's Hospital Datteln, Witten/Herdecke University, Datteln, Germany, 3Experimental and Clinical Research Center, Charité - Universitätsmedizin Berlin, Berlin, Germany
Synopsis
Keywords: Neuroinflammation, Segmentation, acute disseminated encephalomyelitis
We evaluated the performance of the brain segmentation tool SynthSeg on a heterogeneous multi-center cohort of pediatric patients with acute disseminated encephalomyelitis. Brain MRI of the patient cohort was acquired at multiple field strengths, with a diverse range of image spatial resolutions, MR sequences, contrasts, and w/wo administration of gadolinium-based contrast agent (GBCA). SynthSeg performance was generally robust to resolution and contrast differences, especially for larger brain structures. Significant differences in some calculated volumes were detected upon pair-wise comparisons among patients with high- vs. low resolution scans, T1- vs. T2-weighed scans, and w/wo GBCA application, acquired on the same day.Introduction
A wealth of value is contained in MRI data archives from routine clinical practice. Aside from diagnostic purposes, retrospective analysis of archived MRI data holds great promise consistent with the FAIR principles for data.1 One challenge with this is the high heterogeneity of clinical MRI data. Important variables such as magnetic field strength, type of pulse sequence and corresponding parameters, are often not controlled as they would be in prospective clinical studies. Recently SynthSeg has been proposed as a convolutional neural network-based segmentation tool for the adult brain, that is agnostic to contrast weighting and spatial resolution.2,3 Here we evaluated the performance of SynthSeg on brain ventricle volume (BVV) changes in pediatric patients with acute disseminated encephalomyelitis (ADEM).4 We analyzed the brains of a heterogeneous multi-center cohort of patients with a diversity of spatial resolutions and contrasts, including contrast enhancement from gadolinium-based contrast agents (GBCA). This large-scale clinical data set affords a unique opportunity to evaluate segmentation robustness, and compare brain structure volume calculations obtained from high- vs. low spatial resolution scans, T1- vs. T2-weighted scans, and scans w/wo GBCA administration, acquired from the same individuals on the same day.Methods
Whole brain MRI scans from pediatric ADEM patients were obtained from 35 neurology clinics in Germany, Austria, Italy, Switzerland and Canada: n=66; 34/66 female; mean age=6.54 years (range 0.66-19.6). This data was obtained from routine clinical practice, and MRI scan parameters varied among centers, with variable timing of follow-up scans.3D whole brain MRI scans of healthy pediatric subjects were obtained from the National Institutes of Health (NIH) Pediatric MRI Data repository, as part of the Adolescent Brain Cognitive DevelopmentSM Study,5 with n=652 subjects, scanned at 3.0T (1mm isotropic resolution), and processed with FreeSurfer v.6.0.6
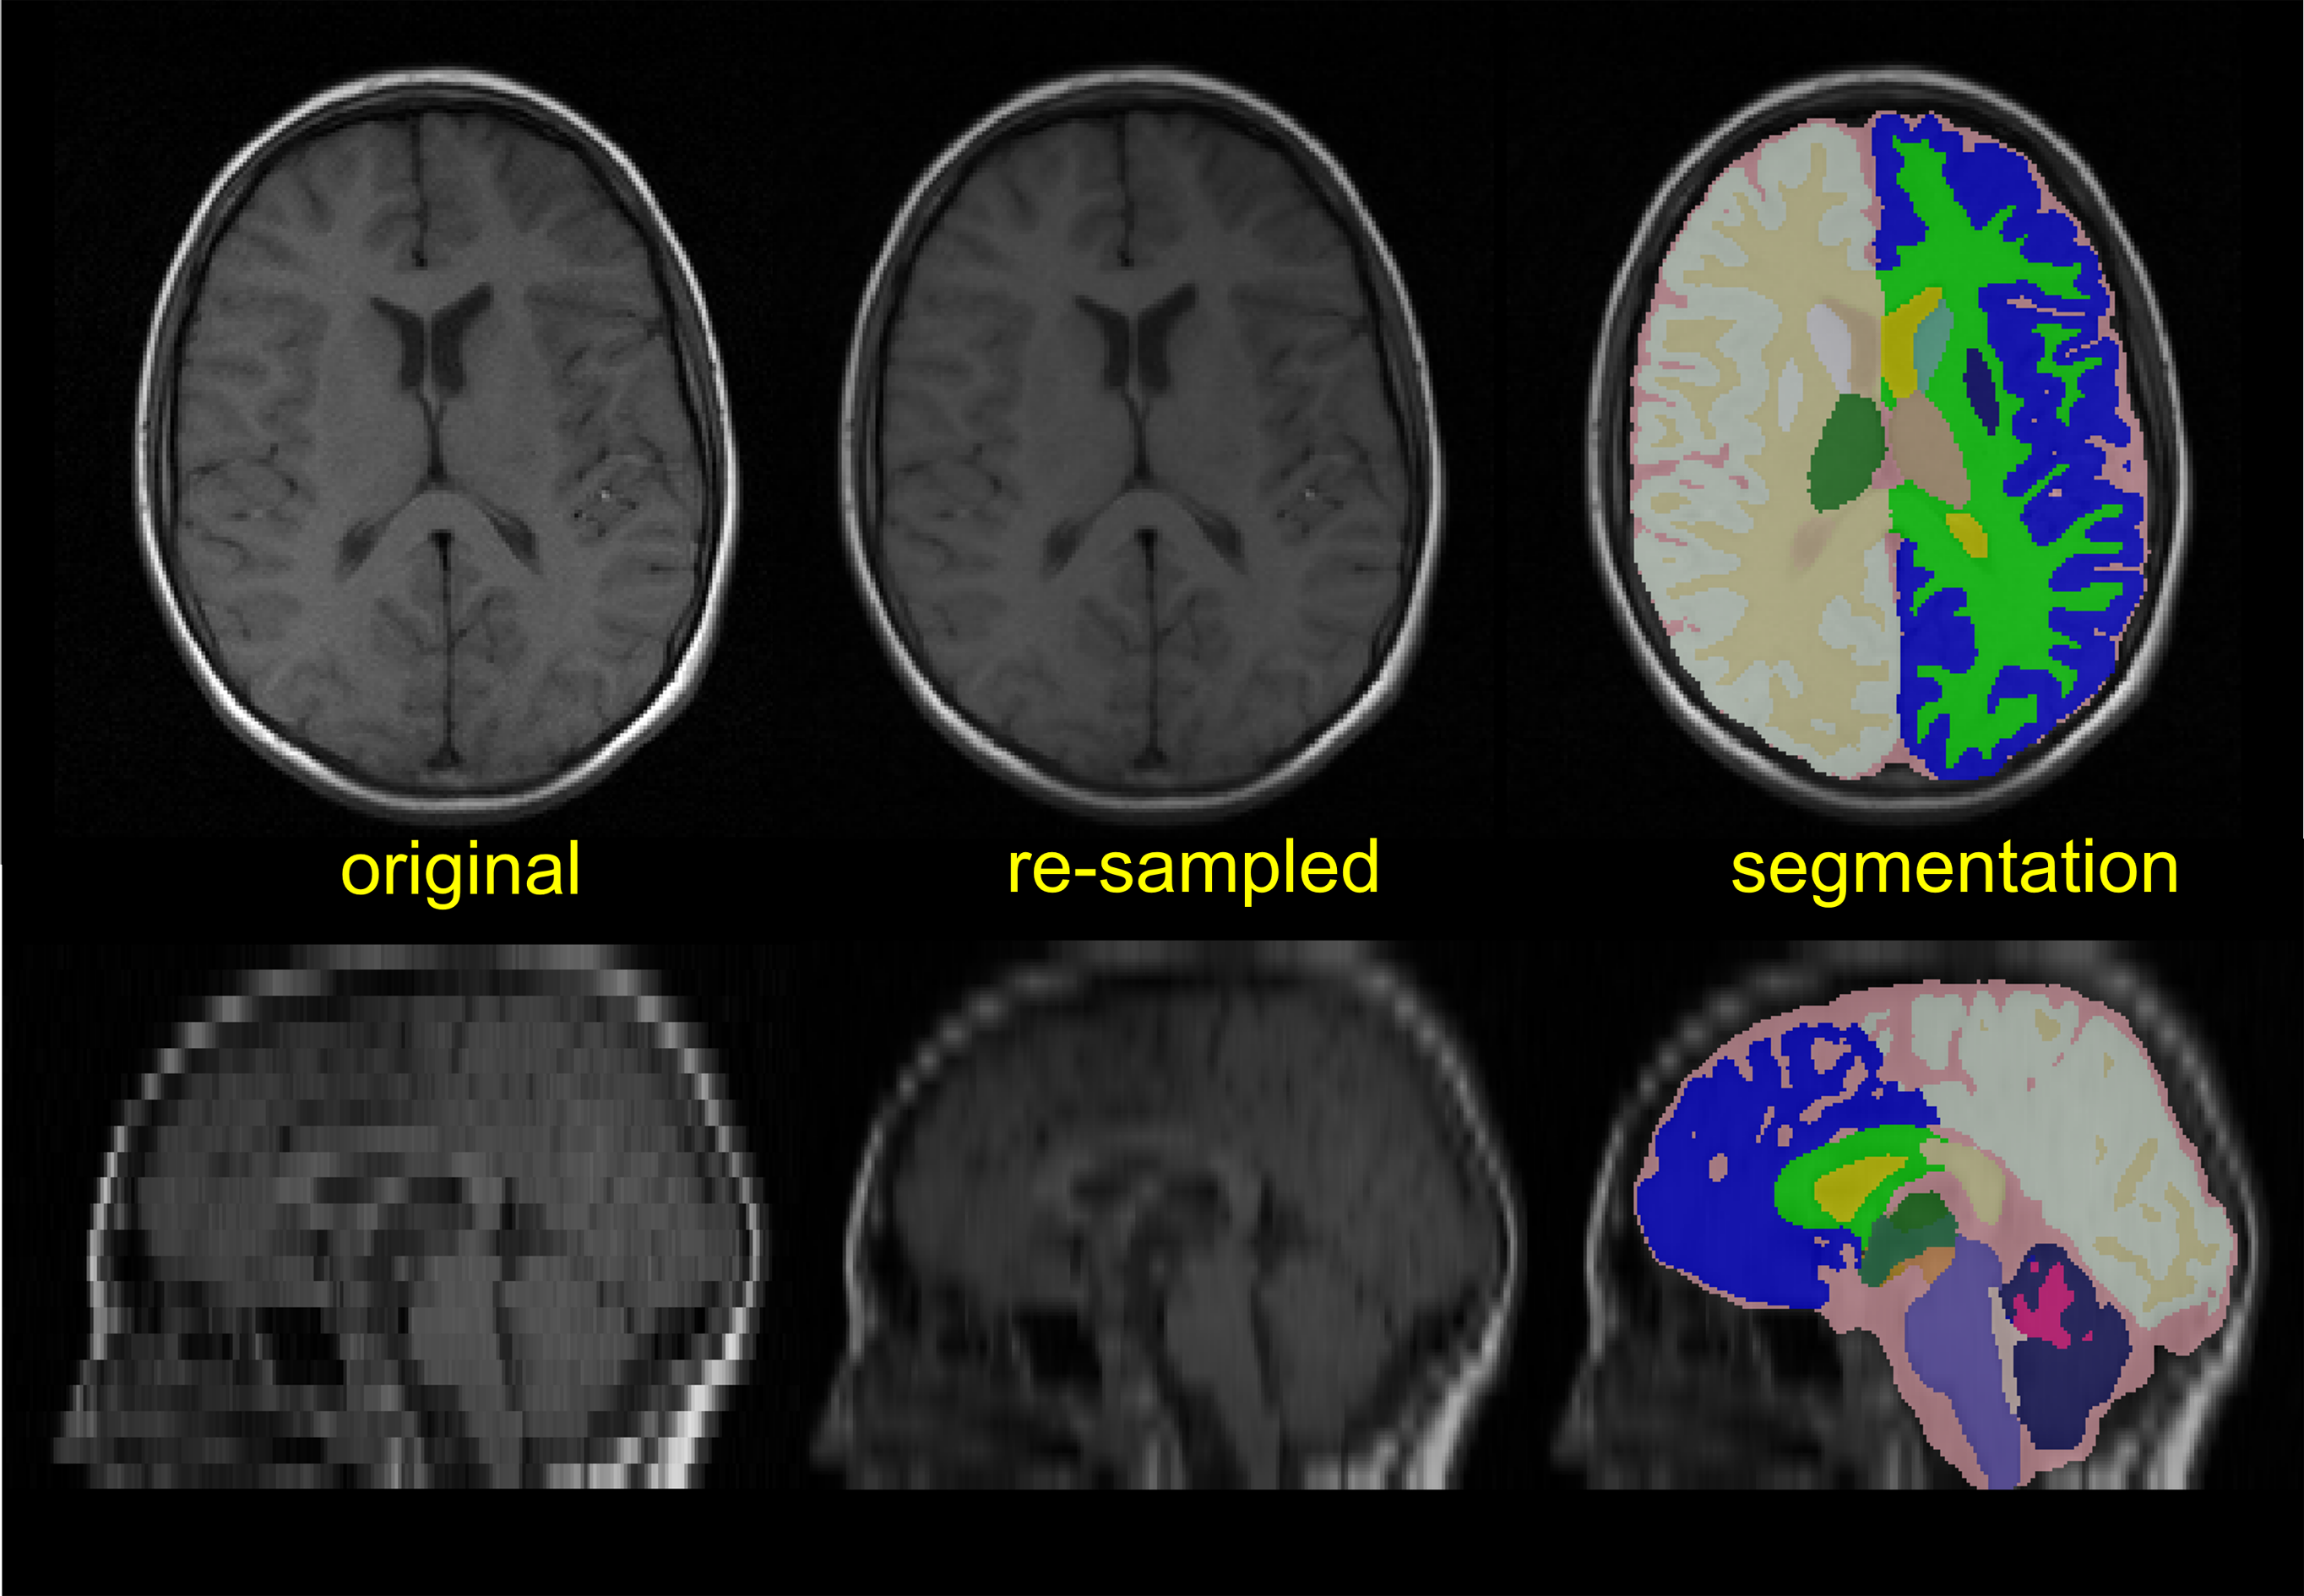
Fully-automated brain segmentation was performed using SynthSeg. A representative example of SynthSeg output is shown in Fig.1; lower spatial resolution scans are re-sampled to 1mm isotropic resolution for segmentation. All patient scans were manually screened, and segmentations examined for quality control. Scans of healthy controls were processed using the same version of SynthSeg to ensure consistency. Data analysis was done using the statistical computing environment R v4.2.1. (*p<0.05; **p<0.01; ***p<0.001)
Results
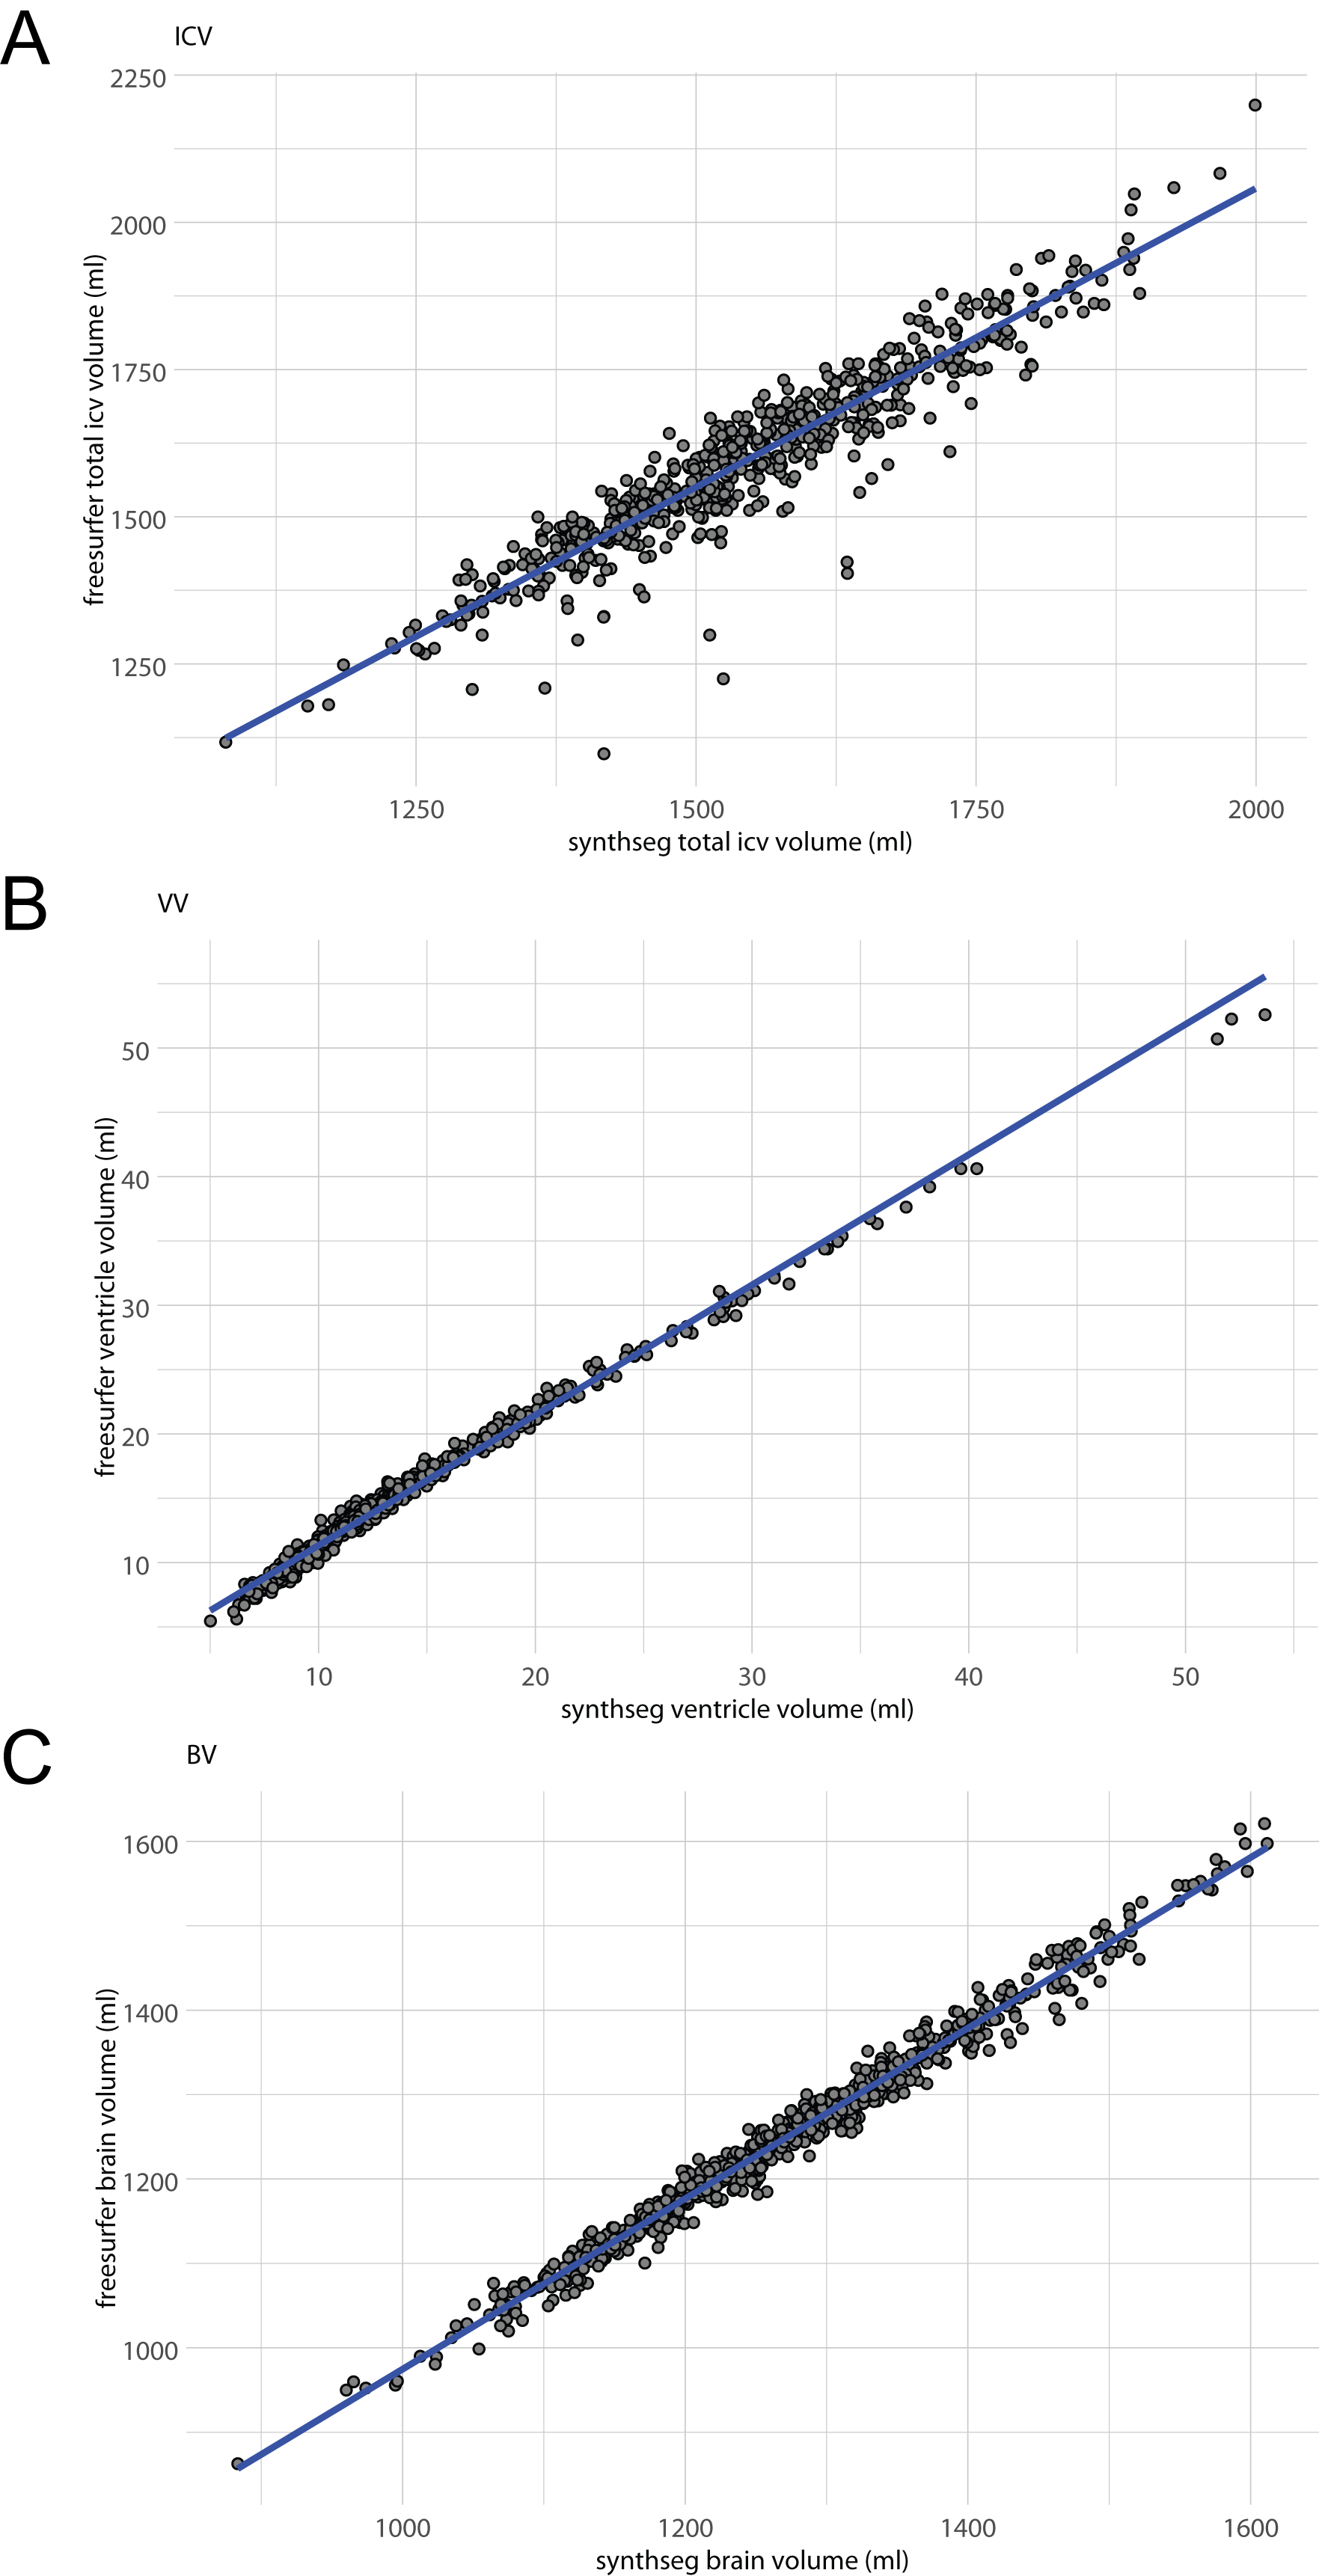
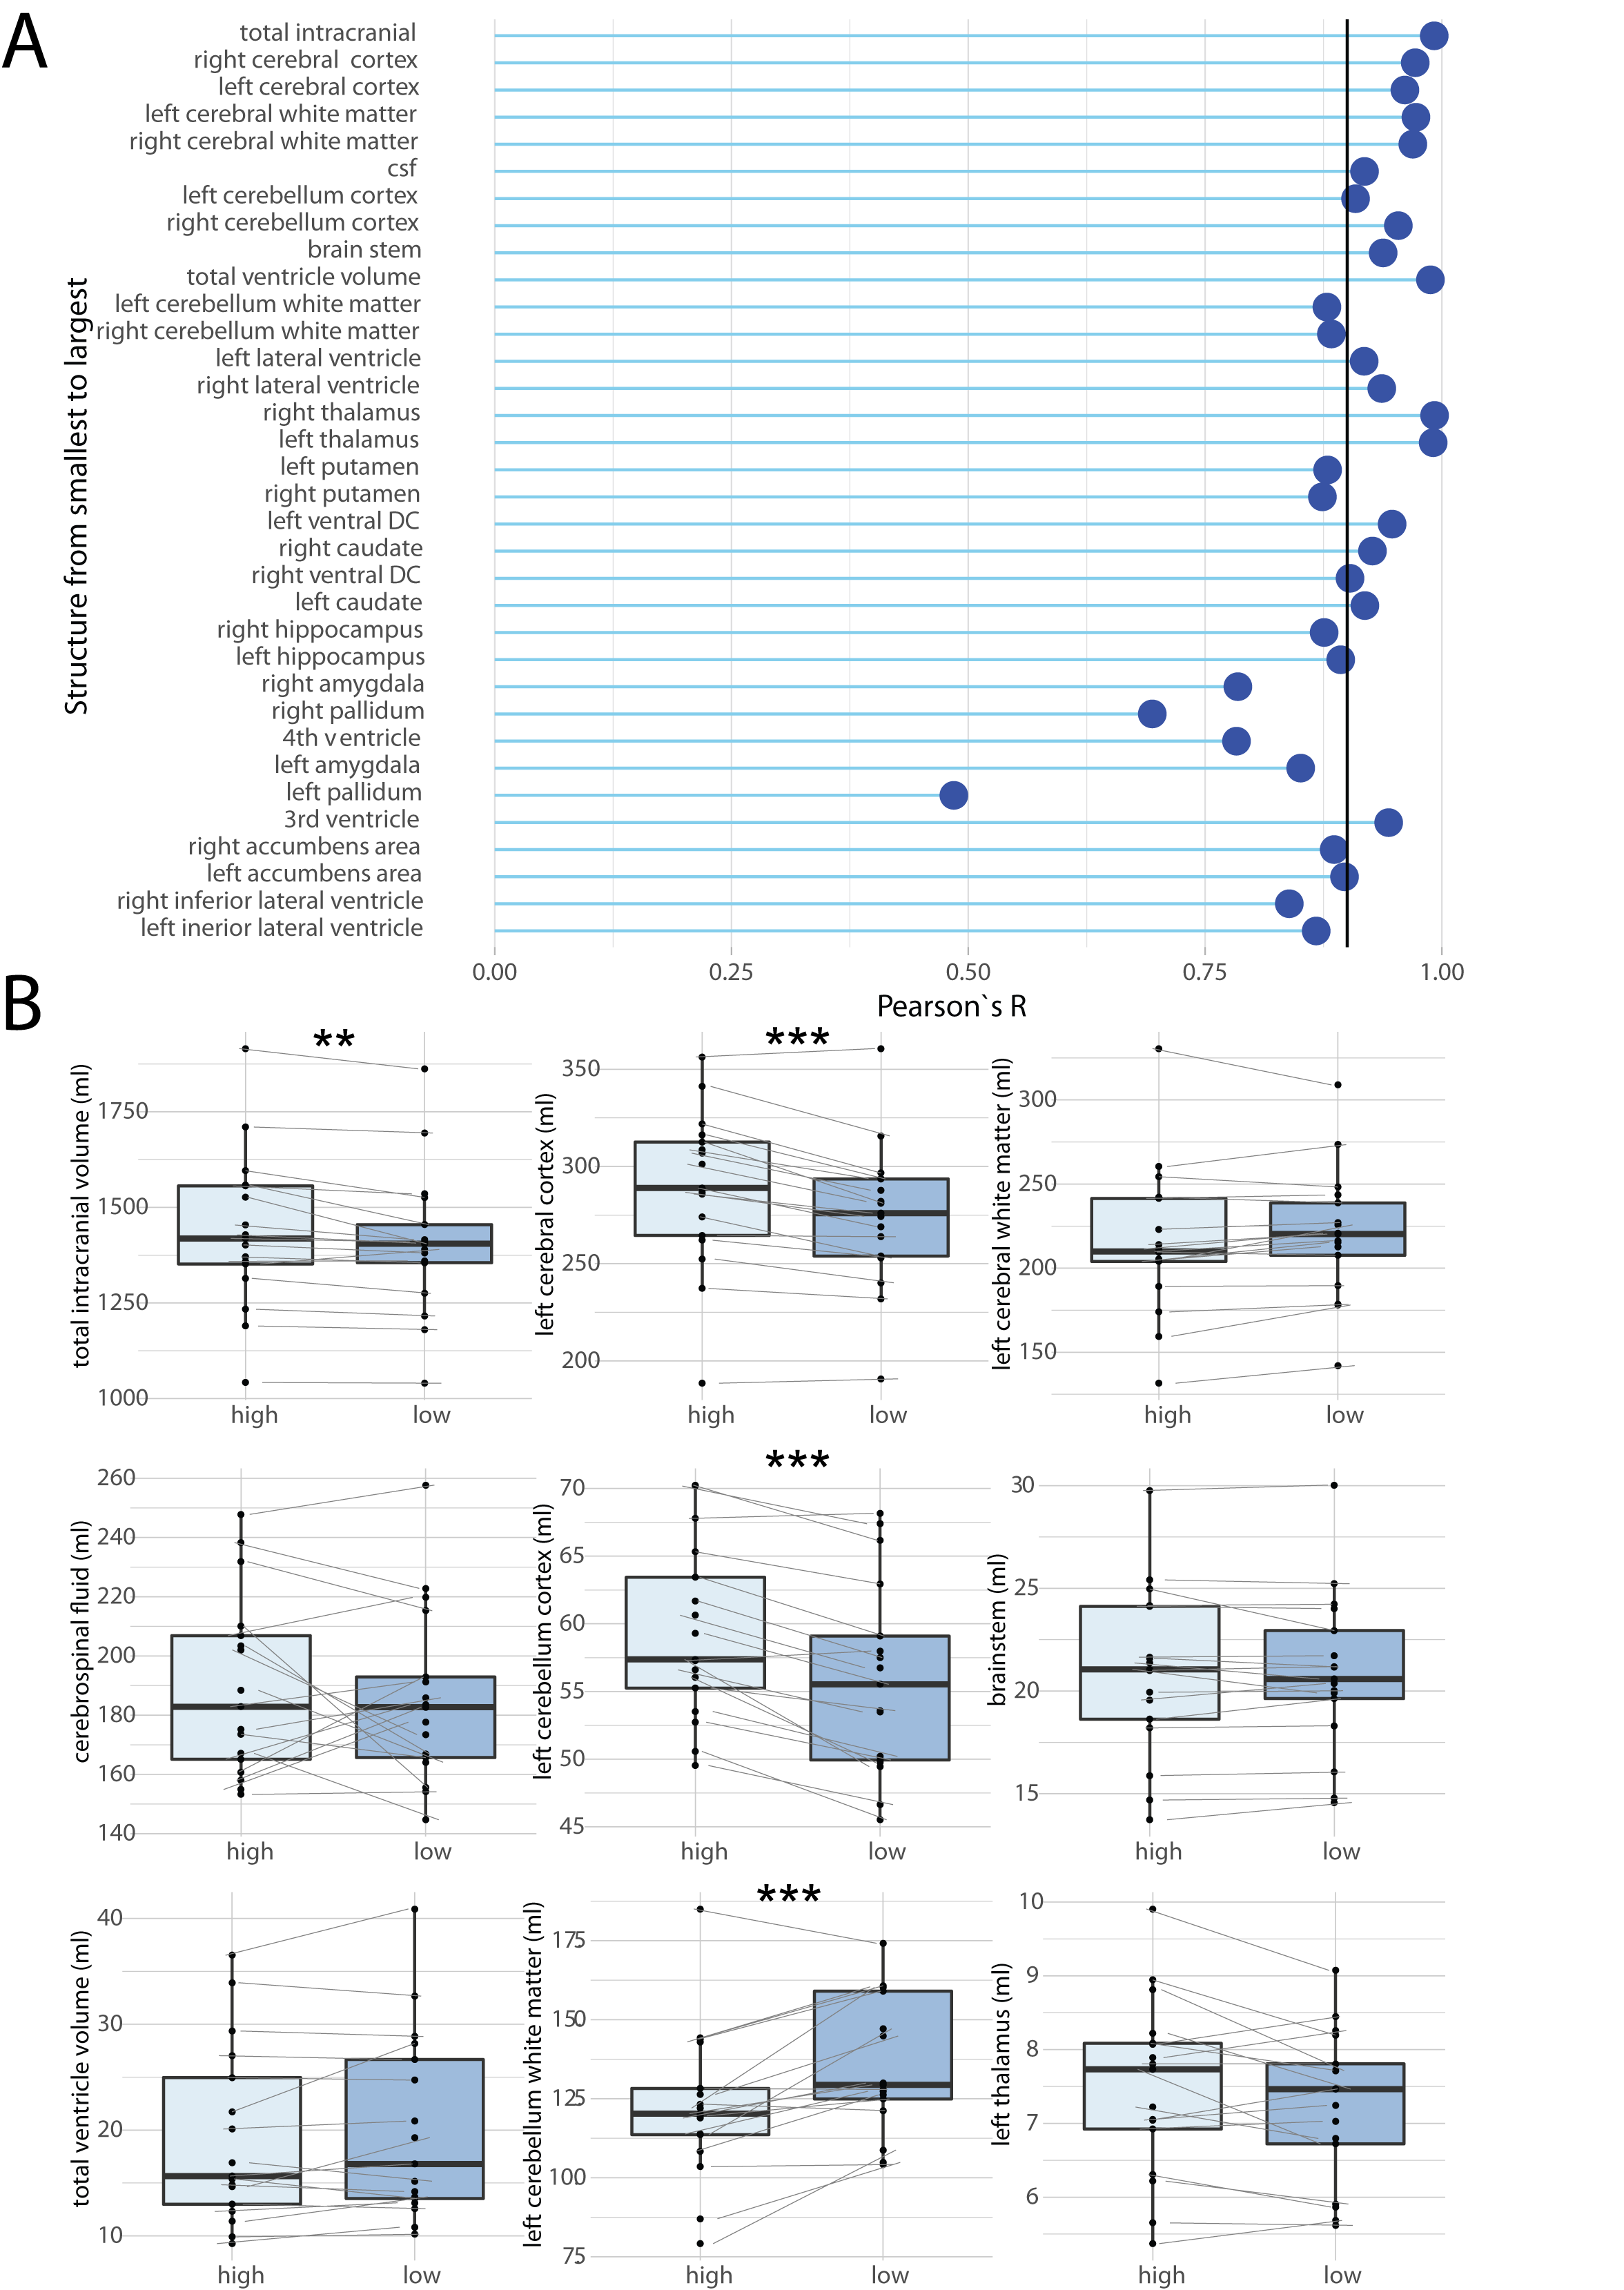
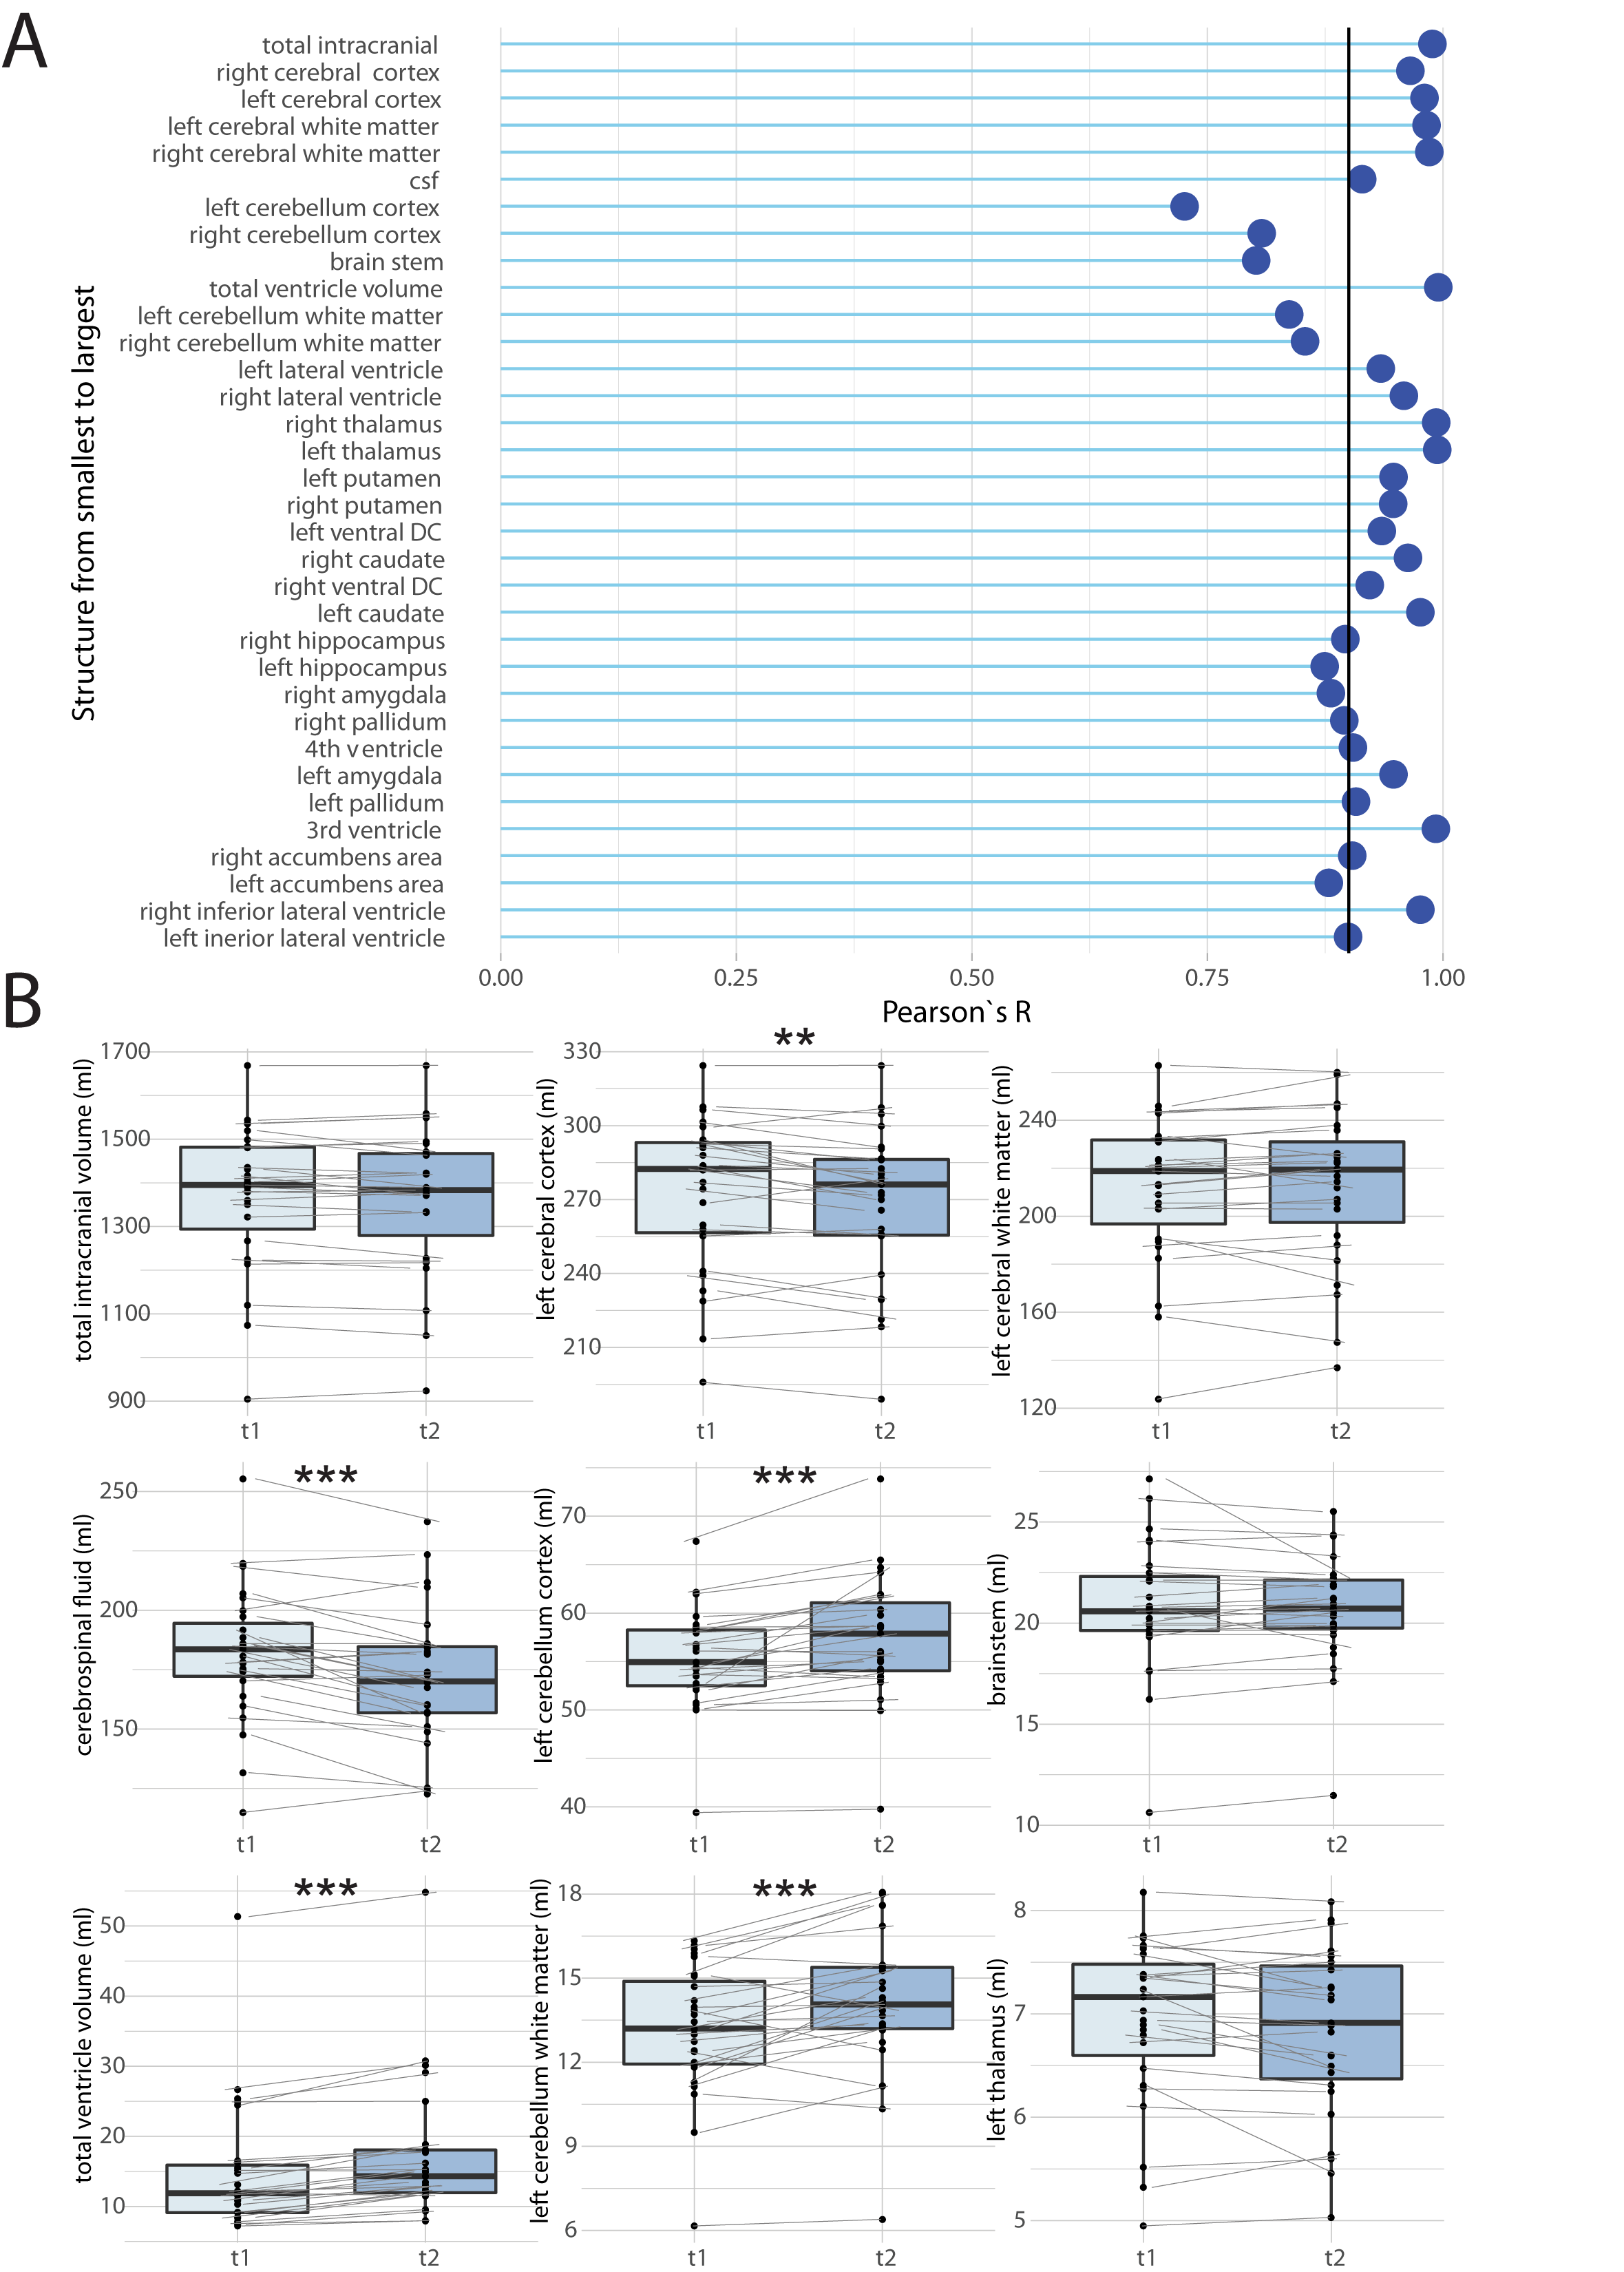
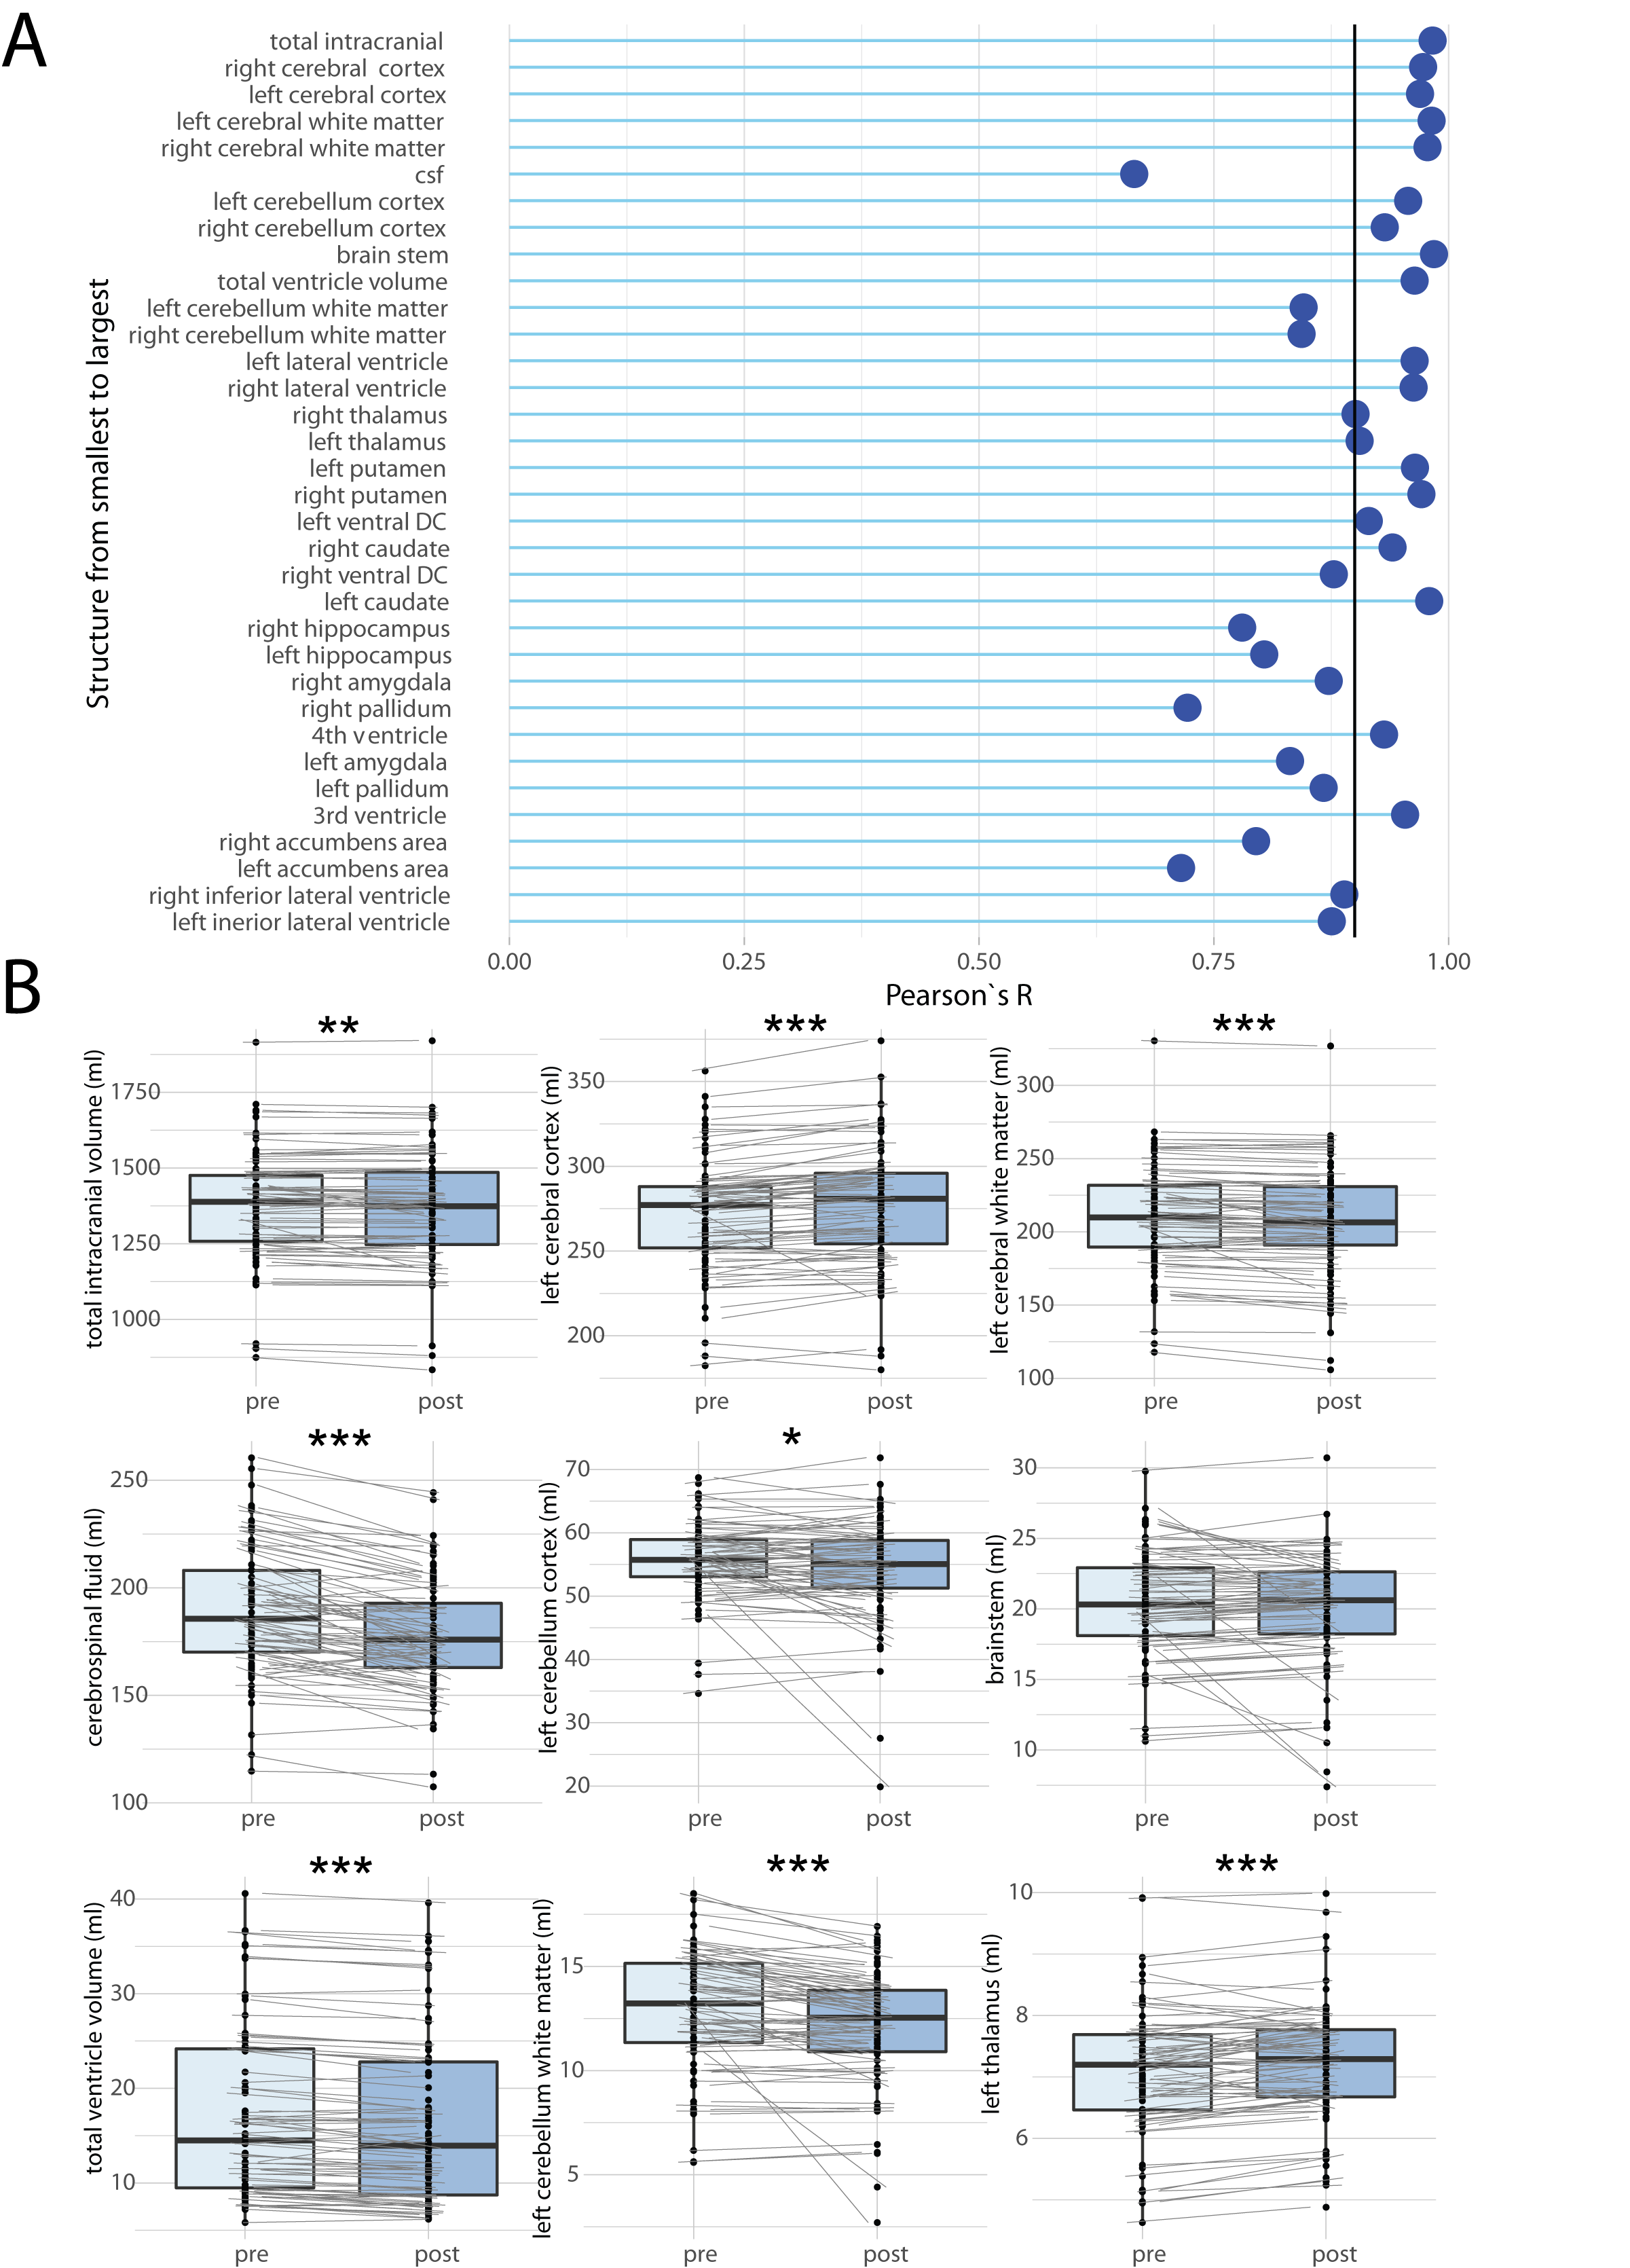
We compared SynthSeg and FreeSurfer on the healthy pediatric cohort with high spatial resolution scans and showed a high correlation for intracranial volume (ICV), BVV and brain volume (BV) (Fig.2A-C). We then examined patients that had both high spatial resolution (~1mm isotropic) and a low spatial resolution (1mm in-plane resolution, 4-5mm slice thickness) scans on the same day (Fig.3). Correlation coefficients for high vs. low spatial resolution scans, for all volumes calculated by SynthSeg are shown in Fig.3A. The correlation was more robust for larger brain structures, and tended to reduce for smaller structures. Pair-wise comparisons revealed significant differences in intracranial volume (-2.2% vs. high resolution), cerebral cortex (-5.2%), cerebellum cortex (-6.0%), cerebellum white matter (+10%) (Fig.3B). Volumes calculated from T1- and T2-weighted images acquired on the same day (equivalent resolution) showed generally high correlation, except for the cerebellum and brainstem (Fig.4A). Pair-wise comparisons revealed significant differences in cerebral cortex (-1.7% vs. T1), CSF (‑5.6%), cerebellum cortex (+3.9%), cerebellum white matter (+6.5%), ventricle volumes (+13.7%) (Fig.4B). Volumes calculated pre- and post-GBCA administration (equivalent contrast and resolution) showed a similar pattern of better correlation for larger structures (Fig.5A), with more significant pair-wise differences: ICV (-0.65% vs. pre-GBCA), cerebral cortex (+1.8%), cerebral white matter (-1.6%) CSF (-6.1%) cerebellum cortex (-2.4%*), cerebellum white matter (-7.3%), thalamus (+1.8%) and ventricle volume (-4.6%) (Fig.5B).Discussion
The performance of an automated segmentation tool (SynthSeg) was evaluated on pediatric brain MRI with a broad range of image contrast and spatial resolution, and was robust despite being developed for use on adults. Performance of SynthSeg was generally more robust for larger brain structures. The BVV and BV volumes from high resolution scans of healthy controls, showed a high correlation between SynthSeg and FreeSurfer, though ICV showed more variance. Although SynthSeg was reported to be ‘agnostic’ to MRI contrast and resolution in adult brains, we detected significant differences in some structures in pediatric brains, between high- and low spatial resolution scans acquired at the same timepoint. It is reasonable to assume that results from high resolution scans are more accurate, since no re-sampling is required. Significant differences were also seen in volumes calculated from T1- vs. T2-weighted images (of equivalent resolution) from the same timepoint, and in comparisons pre- and post-GBCA. For these comparisons there is no ground truth though one may assume that the pre-contrast values are more accurate. Most striking was the larger BVV calculated on T2-weighted scans; caution should be exercised when combining T1- and T2-weighted images in a longitudinal analysis. Ideally, relative changes over time should be assessed using MR images with consistent contrast and resolution. Nevertheless, this is not always possible, and even when appropriate scans are acquired, they sometimes must be excluded due to insufficient quality. Bearing these caveats in mind, SynthSeg may be a suitable tool to extract scientific value from heterogeneous MRI data and bodes very well with the needs of research into diseases and disorders of the brain.Acknowledgements
No acknowledgement found.References
1. Wilkinson, M.D., et al. The FAIR Guiding Principles for scientific data management and stewardship. Sci Data 3, 160018 (2016).
2. Millward, J.M., et al. MRI reveals brain ventricle expansion in pediatric patients with acute disseminated encephalomyelitis. ISMRM online(2020).
3. Billot, B., Colin, M., Arnold, S.E., Das, S. & Iglesias, J.E. Robust Segmentation of Brain MRI in the Wild with Hierarchical CNNs and no Retraining. ( arXiv:2203.01969, 2022).
4. Billot, B., et al. SynthSeg: Domain Randomisation for Segmentation of Brain Scans of any Contrast and Resolution. 19 ( arXiv:2107.09559 2021).
5. Evans, A.C. & Brain Development Cooperative, G. The NIH MRI study of normal brain development. NeuroImage 30, 184-202 (2006).
6. Fischl, B. FreeSurfer. NeuroImage 62, 774-781 (2012).
Figures