3534
Nonsusceptibility frequency shift reveals subtypes of multiple sclerosis lesions and predicts 5-year disappearance of paramagnetic rim1Department of Computer Science and Automation, Technische Universität Ilmenau, Ilmenau, Germany, 2Buffalo Neuroimaging Analysis Center, Department of Neurology at the Jacobs School of Medicine and Biomedical Sciences, University at Buffalo, The State University of New York, Buffalo, NY, United States, 3Department of Neuroimmunology, Medical University of Vienna, Vienna, Austria, 4Jacobs Multiple Sclerosis Center, Department of Neurology, Jacobs School of Medicine and Biomedical Sciences, University at Buffalo, The State University of New York, Buffalo, NY, United States, 5Center for Biomedical Imaging, Clinical and Translational Science Institute, University at Buffalo, The State University of New York, Buffalo, NY, United States
Synopsis
Keywords: White Matter, Multiple Sclerosis
Multiple sclerosis lesions have different types and stages that are challenging to distinguish by conventional MRI. We recently presented DEEPOLE QUASAR, a reconstruction technique that yields nonsusceptibility frequency maps as a novel MRI contrast. In this study, we translate the novel contrast into a tool for multiple sclerosis lesion assessment. We discuss the time course of nonsusceptibility frequency throughout different lesion stages. Within different paramagnetic rim lesions that are typically indistinguishable by conventional MRI, the nonsusceptibility frequency contrast showed hypo-, iso-, and hyperintense subtypes. At a 5-year follow-up, paramagnetic rims disappeared at significantly different proportions between these subtypes.Introduction
Differentiating multiple sclerosis (MS) lesion types and stages remains challenging with conventional MRI and quantitative susceptibility mapping (QSM) but is urgently needed for assessing the efficacy of disease modifying therapies and predicting clinical outcomes. MS lesions have various tissue alterations in the different types and stages, including iron accumulation, inflammation, and demyelination. Uncovering these tissue properties with means of MRI could therefore provide non-invasive markers for lesion classification.Biological tissue affects the magnetic resonance frequency shift, which can be observed through gradient-echo phase MRI. We recently achieved to separate the sources of this frequency shift into magnetic susceptibility, similar to quantitative susceptibility mapping (QSM)1, and nonsusceptibility frequency shifts2,3. The nonsusceptibility frequency shifts are predicted to be sensitive to chemical exchange4 and the tissue’s magnetic microarchitecture5 and might therefore allow for the characterization of protein content and myelin integrity (Fig. 1).
Based on the histological classification of MS lesions8 and the biophysical mechanisms of the tissue alterations at the different stages9–11, we hypothesized that nonsusceptibility frequency follows a information-rich, alternating time course, where the intensity relative to peri-plaque tissue tells the stage. We expected an initial increase of nonsusceptibility frequency as a result of raised chemical exchange12–14 caused by inflammation-related acidification9,15,16 and the larger pool of free proteins. Elevated protein levels are a consequence of (i) the influx of blood plasma after blood-brain barrier breakdown (plasma protein concentration is at least a hundred times higher than that in CSF or brain extracellular fluid17,18), (ii) the immune response8,19, and (iii) disintegration of myelin8,19,20. In addition, the generalized Lorentzian tensor approach predicts that the disintegration of the highly aligned magnetic architecture of myelin also increases the nonsusceptibility frequency10. We expected that during later lesion stages, when the soluble proteins and the vasogenic edema are cleared, the chemical exchange-related effects would slow down and the nonsusceptibility frequency would reverse. The generalized Lorentzian tensor approach also predicts a decrease of the nonsusceptibility frequency with the breakdown of axonal neurofilaments5,10. Fig. 2 illustrates the hypothesized trajectories of the nonsusceptibility frequency next to T1, FLAIR, and magnetic susceptibility.
This work presents the application of nonsusceptibility frequency contrast for MS lesions assessment and introduces a staging system for paramagnetic rim lesions (PRL). From a study with 74 patients, we present the prevalence of lesions in the different stages and the stage-specific proportion of rim disappearance at a 5-year follow-up visit.
Methods
Clinical evaluation and lesion identification: 74 patients with clinically definite6 MS were clinically assessed and imaged by MRI (3T, GE Signa, 3D single-echo spoiled gradient recalled echo) at baseline and 5-year follow-up visits. PRLs were defined on baseline QSM using the proposed NAIMS consensus guidelines. The absence or continued presence of a rim for each baseline PRL was assessed on follow-up QSM.Nonsusceptibility frequency mapping: We used DEEPOLE QUASAR3,7 to calculate nonsusceptibility frequency maps from gradient-echo phase data (Fig. 1).
PRL assessment: Based on the hypothesized temporal evolution of nonsusceptibility frequency in lesions (Fig. 2A), PRLs were classified into three groups according to their appearance on the nonsusceptibility contrast: hyperintense (fρ+), partially hyperintense or fully isointense (fρ=), and with hypointense contrast present (fρ-) (Fig. 2B). The proportion of PRLs in each subtype that lost their rim sign at the 5-year follow-up was calculated and compared using chi-square tests.
Results
PRLs present with different nonsusceptibility frequency contrasts: 165 PRLs were identified on baseline QSMs in 37 of 74 patients. Of those, 36 (21.8%) were fρ+, 97 (58.8%) fρ=, and 32 (19.4%) fρ-.Nonsusceptibility frequency predicts 5-year disappearance of paramagnetic rims: At follow-up, 48 (27.7%) paramagnetic rims disappeared on QSM. Of those, 6/36 (16.7%) were fρ+, 27/97 (27.8%) were fρ=, and 15/32 (46.9%) fρ-. Chi-square tests showed fρ- PRLs had a larger proportion of disappearing rims compared to fρ+ PRLs (p = 0.007) or fρ= PRLs (p = 0.046) (Fig. 3).
Discussion
The nonsusceptibility frequency shift maps revealed PRL subtypes indistinguishable by conventional MRI and QSM. The increased 5-year disappearance proportions from hyper- to hypointense PRLs were in line with our hypothesized time course, suggesting that this novel contrast may be useful for clinical prediction of paramagnetic rim duration and improve the sensitivity of PRLs as a neuroimaging marker of disease modifying therapy efficacy.Conclusion
We have translated the novel nonsusceptibility frequency contrast into a tool for MS lesion assessment. Nonsusceptibility frequency appears to tell apart lesion subclasses that conventional MRI cannot distinguish and illuminate tissue properties previously only observable by histology. Since the DEEPOLE QUASAR method only requires the same input data as QSM, the barrier is low to adopt the method in clinical and research settings.Acknowledgements
Thomas Jochmann and Jack A. Reeves contributed equally.
The local Ethical Standards Committee approved the human experiments, and a written informed consent form was obtained.
The research was supported by the Free State of Thuringia within the ThiMEDOP project (2018 IZN 0004) with funds of the European Union (EFRE), the Free State of Thuringia within the thurAI project (2021 FGI 0008), the German Academic Exchange Service (DAAD PPP 57599925), and an ISMRM Research Exchange Grant awarded to T.J. Research reported in this publication was partially supported by the National Institute of Neurological Disorders and Stroke of the National Institutes of Health under Award Number R01NS114227 (F.S.) and the National Center for Advancing Translational Sciences of the National Institutes of Health under Award Number UL1TR001412 (F.S.). The content is solely the responsibility of the authors and does not necessarily represent the official views of the National Institutes of Health.
References
1. Schweser, F., Sommer, K., Deistung, A. & Reichenbach, J. R. Quantitative susceptibility mapping for investigating subtle susceptibility variations in the human brain. NeuroImage 62, 2083–2100 (2012).
2. Schweser, F. & Zivadinov, R. Quantitative susceptibility mapping (QSM) with an extended physical model for MRI frequency contrast in the brain: a proof-of-concept of quantitative susceptibility and residual (QUASAR) mapping. NMR in Biomedicine 31, e3999 (2018).
3. Jochmann, T., Haueisen, J., Zivadinov, R. & Schweser, F. U2-Net for DEEPOLE QUASAR–A Physics-Informed Deep Convolutional Neural Network that Disentangles MRI Phase Contrast Mechanisms. (2019).
4. Shmueli, K., Dodd, S. J., Li, T.-Q. & Duyn, J. H. The contribution of chemical exchange to MRI frequency shifts in brain tissue. Magnetic Resonance in Medicine 65, 35–43 (2011).
5. Yablonskiy, D. A. & Sukstanskii, A. L. Effects of biological tissue structural anisotropy and anisotropy of magnetic susceptibility on the gradient echo MRI signal phase: theoretical background. NMR in Biomedicine 30, e3655 (2017).
6. Thompson, A. J. et al. Diagnosis of multiple sclerosis: 2017 revisions of the McDonald criteria. The Lancet Neurology 17, 162–173 (2018).
7. Jochmann, T. et al. Quantitative mapping of susceptibility and non-susceptibility frequency with DEEPOLE QUASAR. in International Society of Magnetic Resonance in Medicine (ISMRM) 29th Annual Meeting (2021).
8. Kuhlmann, T. et al. An updated histological classification system for multiple sclerosis lesions. Acta Neuropathol 133, 13–24 (2017).
9. Cadoux-Hudson, T. A. et al. Biochemical changes within a multiple sclerosis plaque in vivo. Journal of Neurology, Neurosurgery & Psychiatry 54, 1004–1006 (1991).
10. Yablonskiy, D. A., Luo, J., Sukstanskii, A. L., Iyer, A. & Cross, A. H. Biophysical mechanisms of MRI signal frequency contrast in multiple sclerosis. Proceedings of the National Academy of Sciences 109, 14212–14217 (2012).
11. Leutritz, T., Hilfert, L., Smalla, K.-H., Speck, O. & Zhong, K. Accurate quantification of water–macromolecule exchange induced frequency shift: Effects of reference substance. Magnetic Resonance in Medicine 69, 263–268 (2013).
12. Mougin, O., Clemence, M., Peters, A., Pitiot, A. & Gowland, P. High-resolution imaging of magnetisation transfer and nuclear Overhauser effect in the human visual cortex at 7 T. NMR in Biomedicine 26, 1508–1517 (2013).
13. Khlebnikov, V. et al. Is there any difference in Amide and NOE CEST effects between white and gray matter at 7T? Journal of Magnetic Resonance 272, 82–86 (2016).
14. Sartoretti, E. et al. Amide Proton Transfer Weighted Imaging Shows Differences in Multiple Sclerosis Lesions and White Matter Hyperintensities of Presumed Vascular Origin. Frontiers in Neurology 10, 1307 (2019).
15. Liepinsh, E. & Otting, G. Proton exchange rates from amino acid side chains— implications for image contrast. Magnetic Resonance in Medicine 35, 30–42 (1996).
16. Zhou, J., Payen, J.-F., Wilson, D. A., Traystman, R. J. & van Zijl, P. C. M. Using the amide proton signals of intracellular proteins and peptides to detect pH effects in MRI. Nat Med 9, 1085–1090 (2003).
17. Leeman, M., Choi, J., Hansson, S., Storm, M. U. & Nilsson, L. Proteins and antibodies in serum, plasma, and whole blood—size characterization using asymmetrical flow field-flow fractionation (AF4). Anal Bioanal Chem 410, 4867–4873 (2018).
18. Wuschek, A. et al. CSF Protein Concentration Shows No Correlation With Brain Volume Measures. Frontiers in Neurology 10, (2019).
19. Stadelmann, C., Timmler, S., Barrantes-Freer, A. & Simons, M. Myelin in the Central Nervous System: Structure, Function, and Pathology. Physiological Reviews 99, 1381–1431 (2019).
20. Mader, I. et al. Proton MR spectroscopy with metabolite-nulling reveals elevated macromolecules in acute multiple sclerosis. Brain 124, 953–961 (2001).
Figures
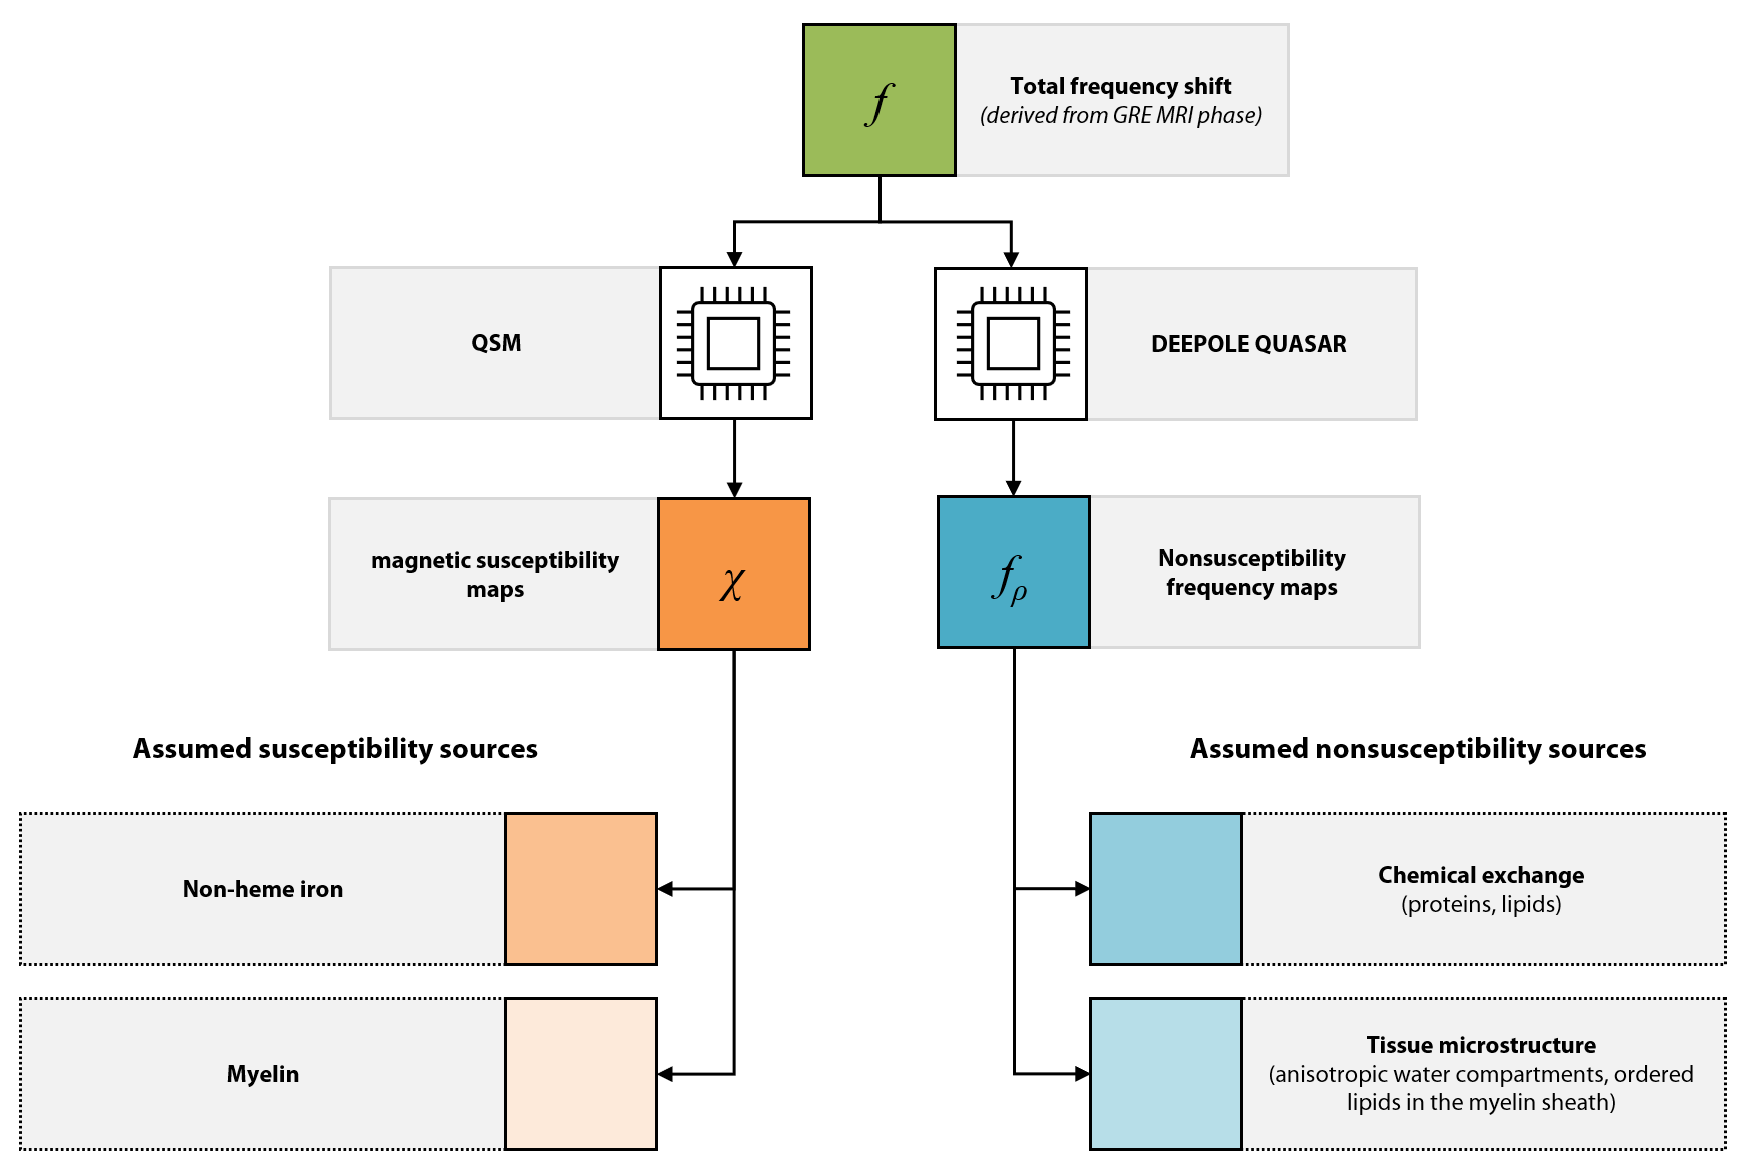
Fig. 1. DEEPOLE QUASAR maps nonsusceptibility frequency shifts, complementary to the magnetic susceptibility from quantitative susceptibility mapping (QSM). The assumed sources of magnetic susceptibility contrast are iron and myelin content. The assumed sources of nonsusceptibility frequencies are chemical exchange with proteins and lipids and tissue microstructure, particularly in the myelin sheaths.
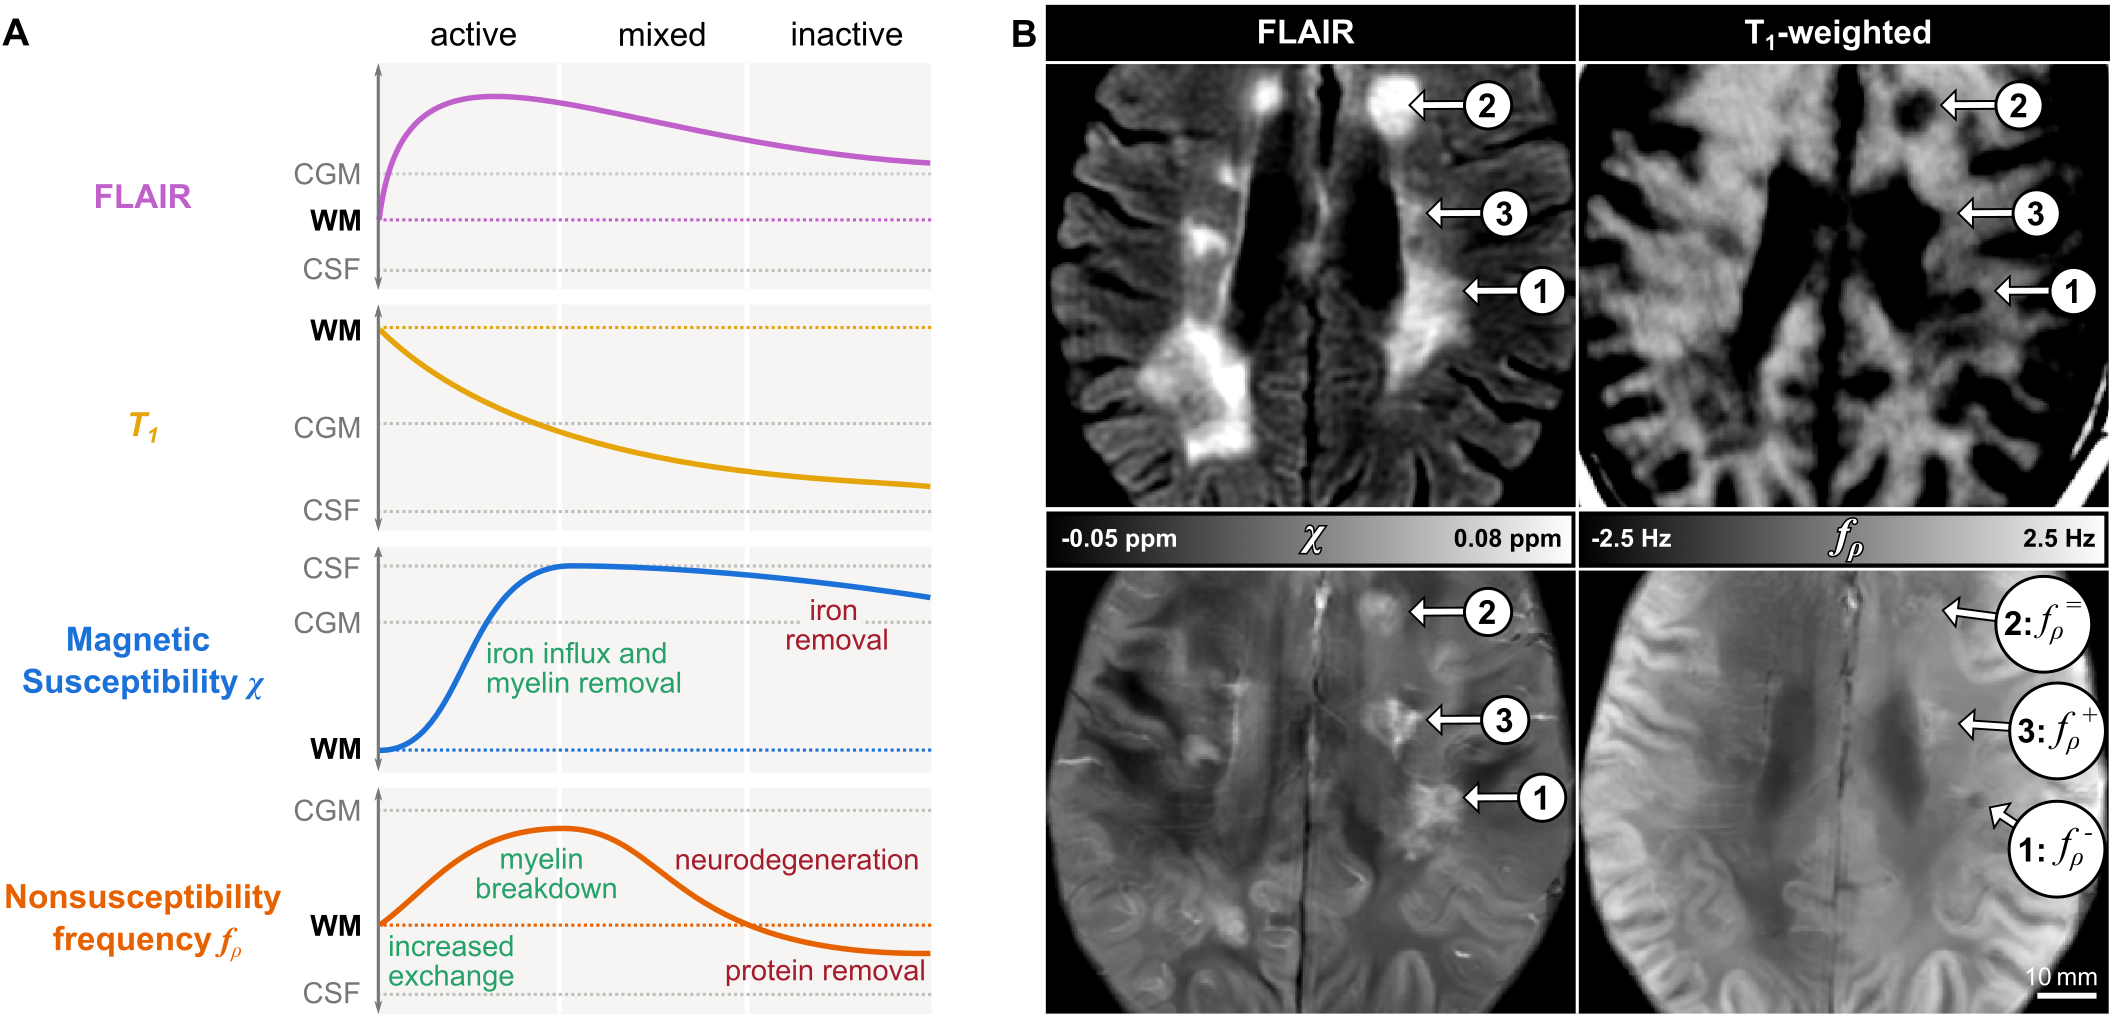
Fig. 2. A) Schematic of the time courses of FLAIR intensities and T1 (without contrast agent) and hypothesized time courses of χ and fρ in MS lesions. After the initial rise together with χ, fρ decreases towards the inactive stage and even changes its sign. B) Staging system based in the nonsusceptibility frequency contrast, fρ: we classified lesions as hyperintense (fρ+), partially hyperintense or fully isointense (fρ=), and with hypointense contrast present (fρ-).
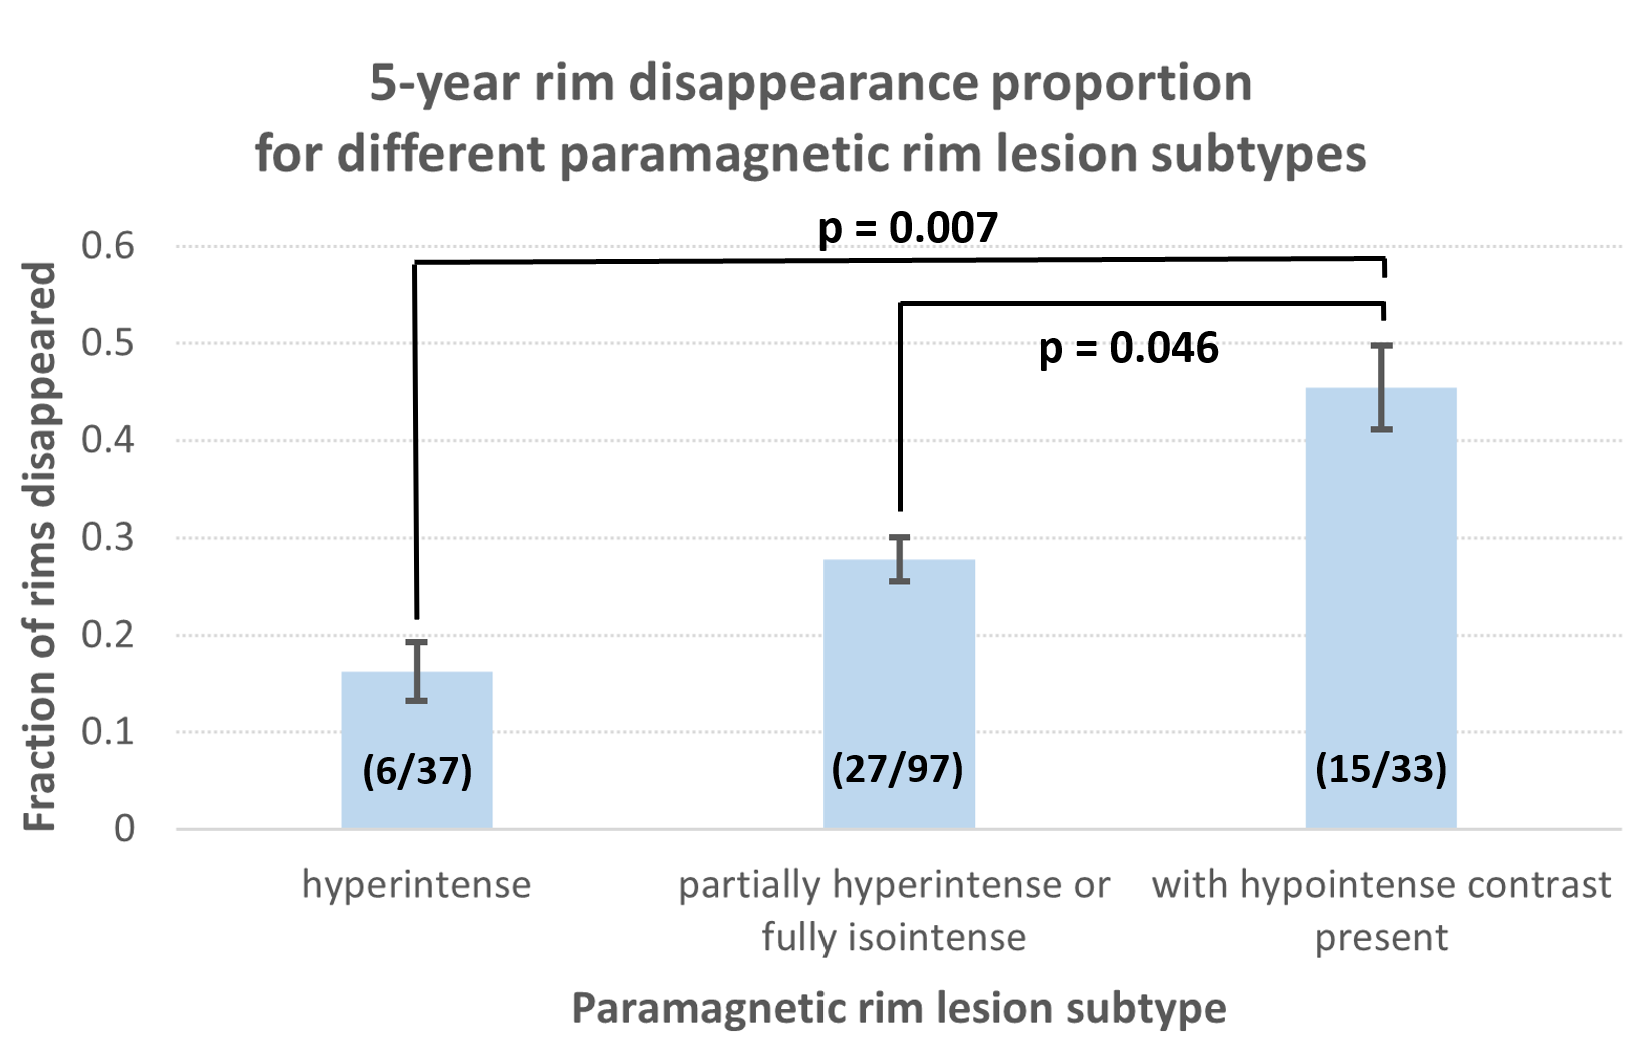
Fig. 3. Subtypes and 5-year disappearance proportions of paramagnetic rims. Error bars denote standard deviation. We found substantial numbers of each of the three classification categories, suggesting previously unobservable subtypes of paramagnetic rim lesions. PRLs with hypointense contrast present disappeared in significantly higher proportions than hyperintense lesions and partially hyperintense or fully isointense lesions. These observations suggest clinical potential for lesion staging and outcome prediction.