3533
Novel MRI techniques for the Assessment of Activated Innate Immunity in Progressive Multiple Sclerosis1UCAIR, Department of Radiology and Imaging Sciences, University of Utah, Salt Lake City, UT, United States, 2Department of Neurology, University of Utah, Salt Lake City, UT, United States
Synopsis
Keywords: Multiple Sclerosis, Molecular Imaging, USPIO
While the specific pathologic mechanisms that underpin ongoing axonal loss in progressive forms of MS are not fully characterized, ongoing innate immune activation in chronic MS lesions, particularly activated microglia and macrophages, has been proposed to be a prevailing mechanism of axonal loss in the progressive phase of disease. Ultrasmall superparamagnetic iron oxide particles have been introduced as a potential MRI biomarker for macrophage activity in focal MS lesions. This work presents a Feromoxytol enhanced MRI to measure perilesional activated microglia and macrophages in progressive MS. which is anticipated to reflect risk for ongoing loss of CNS axons and neurons.
PURPOSE
Multiple sclerosis (MS) is a chronic immune-mediated disease of the central nervous system (CNS) with an incompletely understood pathology. MS is characterized by relapses and progression. Multifocal CNS lesions exhibit demyelination, inflammation, reactive gliosis, axonal loss and neuronal damage.1 Axonal loss and neuronal damage are generally believed to represent the pathologic correlate of progressive disease.2 While the specific pathologic mechanisms that underpin ongoing axonal loss in progressive forms of MS are not fully characterized, ongoing innate immune activation in chronic MS lesions, particularly activated microglia and macrophages, has been proposed to be a prevailing mechanism of axonal loss in the progressive phase of disease.3 However, research efforts to identify patients with the target pathology or serve as clinical trial outcome measures are hindered from the lack of efficient biomarkers.4 Conventional MRI typically demonstrates multifocal white matter (WM) lesions, which show only moderate correlation with clinical disability.5 Recently, ultrasmall superparamagnetic iron oxide (USPIO) particles have been introduced as a potential MRI biomarker for macrophage activity in focal MS lesions.6,7 This work aims to explore USPIO uptake, particularly ferumoxytol uptake, as a biomarker to measure perilesional activated microglia and macrophages in progressive MS, which is anticipated to more accurately reflect risk for ongoing loss of CNS axons and neurons.METHODS
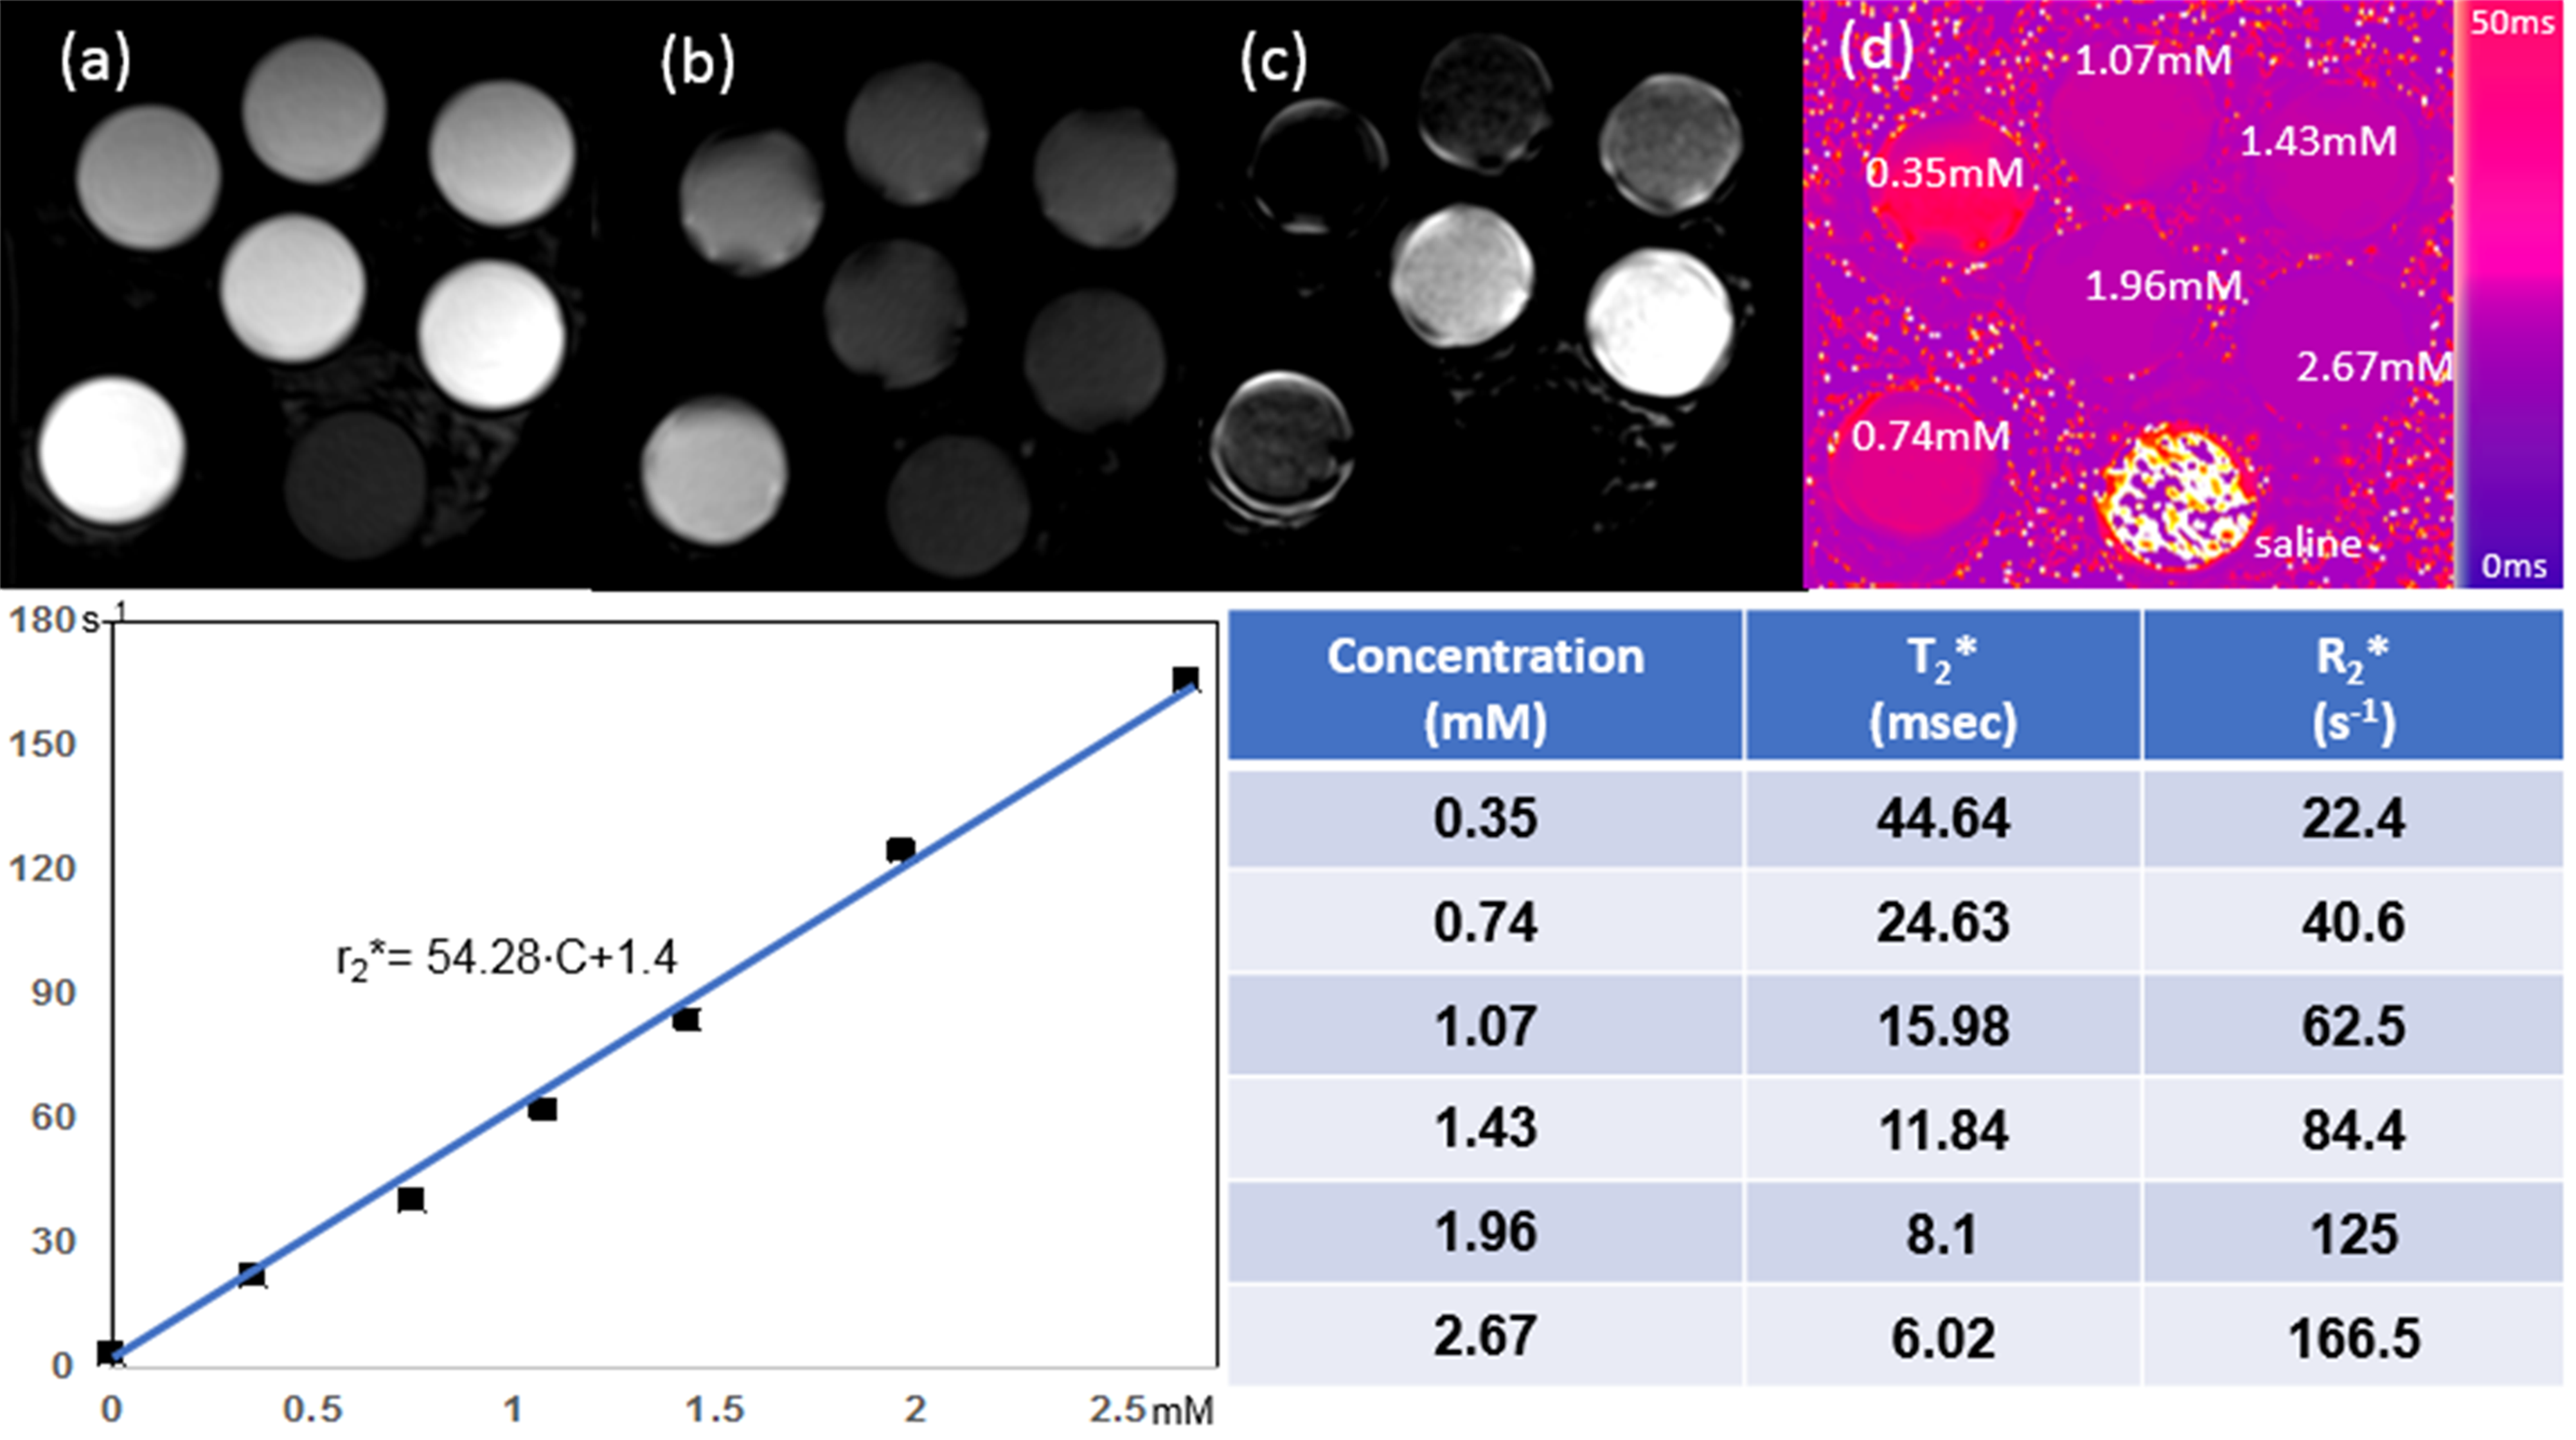
All MRI studies were performed on a 3T MRI scanner with 20 channel head coils. Human studies were approved by the institutional review board and obtained signed consent form.Phantom Test: To measure the relaxation properties of USPIO, ferumoxytol (Feraheme, Covis Pharma, Waltham, Massachusetts, USA) was uniformly mixed with saline solution in 50 mL sample tubes to make six gradually increasing concentrations (C) within the range typically used in clinical imaging (0.35, 0.74,1.07, 1.43, 1.96 and 2.67mM). Ultra-short echo time (UTE) imaging was performed to acquire four multi-echo images with TE of 0.01, 0.18, 4.53, and 5,24ms. T2* maps were calculated by using non-linear fitting of TE and corresponding echo images. The transverse relaxivities of retained ferumoxytol (r2*=s−1mM−1) was estimated from a fitting of T2* and C using the equation 1/T2*=1/T2o*+r2*•C(Eq1).
MS patient Study: Two subjects with PMS or SPMS and ongoing clinical worsening were recruited. Each subject had two separated MRI exams at before (baseline) and 96 hours delayed after feruromytol administration (post-ferumoxytol). After first scan, the subject was infused with ferumoxytol over 30 minutes with a dose of 4 mg/kg. 3D multi-echo gradient echo (3D ME-GRE) sequence was performed with the following parameters: TE=1.08, 3.12, 5.08 7.04 and 9.0, TR=35 ms, and isotropic resolution of 0.8 mm. Imaging Analysis: Two sets of 3D ME-GRE images obtained from two separated MRI scans at baseline and post-ferumoxytol were co-registered prior to computing T2* maps. Co-registered T2* maps were obtained using the fitting as described in the phantom study. ΔT2* maps were calculated from the subtraction of T2* map at baseline and post-ferumoxytol, respectively. T2* and ΔT2* maps were obtained by using routines implemented in Python and ANTs registration tool.8 Ferumoxytol retained lesions were selected at ΔT2* map and saved with ITK-SNAP software.9 The ΔT2* derived ROIs were co-registered with the corresponding T2* maps and 3D T2 FLAIR images.
RESULTS
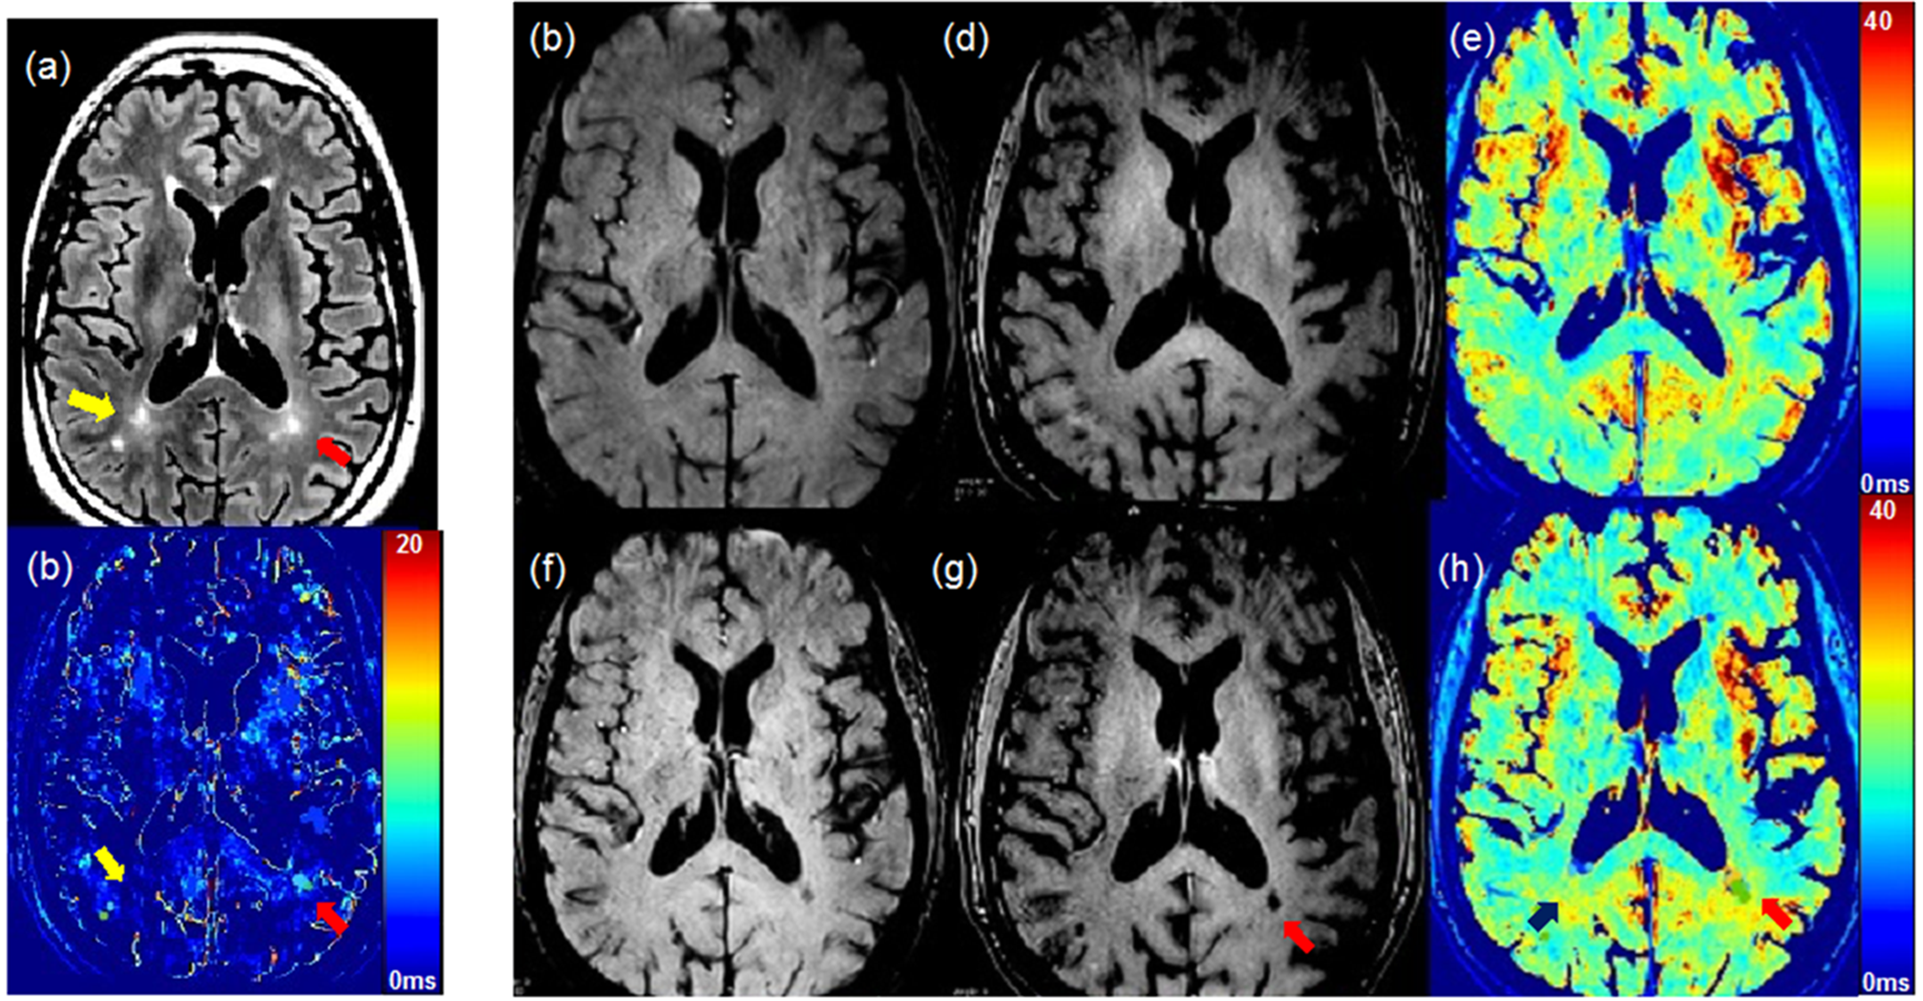
Figure 1(a) and (b) demonstrate the UTE signal intensity vs. TE obtained from the phantom. When short and long echo images were subtracted, only short T2* tubes were enhanced(c). After T2* of each tube was measured, r2* was determined as 54.28 s-1mM-1 based on the slope of the leaner regression between concentration and 1/T2*. This preliminary r2* measurement agrees with previous reports from another study.10 Figure 2 shows ferumoxytol retention in progressive MS brain of a 61-year-old male subject with clinically worsening progressive MS over the preceding 2 years. 3D T2 FLAIR images show the multifocal MS lesions (yellow and red arrows in (a)). Comparing short TE (1.0ms) to long TE (9.0ms) GRE images, we observed the T2* enhanced MS lesion at the long TE image at post-ferumoxytol (red arrow in (g)). The measurement of T2* on the same MS lesion was decreased from 28ms to 18ms (h), while no T2* changes on the MS lesion indicated by the yellow arrow on ΔT2* map (b). Using Eq(1), the concentration of ferumoxytol retained was measured as 0.364mM. We have observed any ΔT2* enhanced lesions from female subject with SPMS.DISCUSSION
This preliminary work demonstrates the variation of ΔT2* among progressive MS lesions, which may reflect ferumoxytol retention in microglia and macrophages. We demonstrate the quantification of ferumoxytol on ΔT2* enhanced MS lesions. Newly developed active lesions in relapsing MS have numerous macrophages within the lesion, while chronic-active lesions in progressive MS have microglia and macrophages mostly restricted to the perilesional area. In future work, we will recruit more subjects with progressive MS and compare this finding to gadolinium-enhanced areas. We will also compare these results to those from subjects with chronic MS but stable neurologic function.CONCLUSION
Imaging activated innate immune cells by using the proposed method, while excluding nonspecific leukocyte infiltration, shows promise as a novel imaging biomarker for chronic-active lesions in progressive MS.Acknowledgements
Supported by Utah CTSI pilot award (NCATS UL1TR002538), with ferumoxytol provided by Covis Pharma US.References
1. Noseworthy JH, Lucchinetti C, Rodriguez M, Weinshenker BG. Multiple sclerosis. N Engl J Med. 2000;343(13):938-952. doi:10.1056/NEJM200009283431307
2. Correale J, Gaitán MI, Ysrraelit MC, Fiol MP. Progressive multiple sclerosis: from pathogenic mechanisms to treatment. Brain. 2017;140(3):527-546. doi:10.1093/BRAIN/AWW258
3. Charil A, Filippi M. Inflammatory demyelination and neurodegeneration in early multiple sclerosis. J Neurol Sci. 2007;259(1-2):7-15. doi:10.1016/j.jns.2006.08.017
4. Hollen CW PSMRJSRI. The Future of Progressive Multiple Sclerosis Therapies. Fed Pract. 2020;37(Suppl 1):S43-S49.
5. Filippi M, Falini A, Arnold DL, et al. Magnetic resonance techniques for the in vivo assessment of multiple sclerosis pathology: Consensus report of the white matter study group. J Magn Reson Imag. 2005;21:669-675.
6. Kirschbaum K, Sonner JK, Zeller MW, et al. In vivo nanoparticle imaging of innate immune cells can serve as a marker of disease severity in a model of multiple sclerosis. Proc Natl Acad Sci U S A. 2016;113(46):13227-13232. doi:10.1073/pnas.1609397113
7. Vellinga MM, Vrenken H, Hulst HE, et al. Use of ultrasmall superparamagnetic particles of iron oxide (USPIO)-enhanced mri to demonstrate diffuse inflammation in the normal-appearing white matter (NAWM) of multiple sclerosis (MS) patients: an exploratory study. Journal of Magnetic Resonance Imaging. 2009;29(4):774-779. doi:10.1002/jmri.21678
8. Avants BB, Tustison N, Johnson H. Advanced Normalization Tools (ANTS) Release 2.x. Published online 2014. Accessed November 6, 2022. https://brianavants.wordpress.com/2012/04/13/updated-ants-compile-instructions-april-12-2012/
9. ITK-SNAP Home. Accessed November 6, 2022. http://www.itksnap.org/pmwiki/pmwiki.php
10. Knobloch G, Colgan T, Wiens CN, et al. Relaxivity of Ferumoxytol at 1.5 T and 3.0 T. Invest Radiol. 2018;53(5):257-263. doi:10.1097/RLI.0000000000000434
Figures