3526
Within-network changes in strength of the default mode network are related to Alzheimer’s Disease biomarkers in APOE e4 carriers1The Cleveland Clinic, Cleveland, OH, United States
Synopsis
Keywords: Alzheimer's Disease, Alzheimer's Disease, APOE
The apolipoprotein E (APOE) ε4 genotype is a genetic risk factor for late onset Alzheimer’s Disease (AD). Consistent differences in network connectivity have been described in ε4 carriers (e4+). Here, we compare resting state connectivity in the default mode network between elderly, cognitively intact e4+ and non-carriers (e4-) and assess the relationship of connectivity to AD-related biomarkers. Regional changes in the e4+ group primarily consisted of weakened connectivity. Connectivity strength in the middle temporal gyrus was negatively related to amyloid PET centiloid score and p-tau in the e4+ group.Introduction
The apolipoprotein E (APOE) ε4 genotype (e4+) is a genetic risk factor for late onset Alzheimer’s Disease (AD). Resting state functional connectivity measured with MRI (rsfMRI) has been shown to be disrupted in AD, with consistent reports of hypoconnectivity in the default mode network (DMN), particularly in the parietal lobes and posterior cingulate cortex (PCC) (1). Results in cognitively intact e4+ adults have been inconsistent, with reports of both stronger and weaker connectivity strength when compared to non-carriers (e4-) (2). Here, we focus on the PCC to compare DMN connectivity between e4+ and e4- groups and assess the relationship of connectivity to AD-related biomarkers.Methods
Two groups of cognitively intact, healthy older adults were included in an IRB-approved protocol. Sixty-five APOE ε4 carriers (e4+; mean age 70.2 ± 4.1; 33 males) and 60 ε4 non-carriers (e4-; mean age 71.9 ± 4.1; 28 males) were scanned on a 3T Siemens Prisma. Scans included a whole-brain anatomical MPRAGE (1mm3 voxel size) and rsfMRI scan with the following parameters: 132 repetitions, axial slices acquired with TE/TR=29ms/2800ms, voxel size=2x2x4mm3. Subjects were instructed to keep their eyes closed during scans and a bite-bar was used to reduce head motion.RsfMRI scans were pre-processed with measured physiologic signal removal, motion correction (3), and spatial filtering (4). The MPRAGE was co-registered to the rsfMRI scan and aligned to Talairach space using non-linear alignment (AFNI). To focus on the DMN, 10mm spheres were placed in the bilateral posterior cingulate cortex (PCC) at coordinates previously identified as part of the DMN (5). PCC ROIs were warped to individual rsfMRI space and a grey matter mask was applied (Freesurfer 7.0). Using in-house software, an automated search between the left and right PCC ROIs was used to locate the grey matter voxels that were most highly correlated across hemispheres. Nine-voxel in-plane seeds were centered at those voxels and used to calculate two whole-brain connectivity z-maps – one for left PCC and one for right PCC.
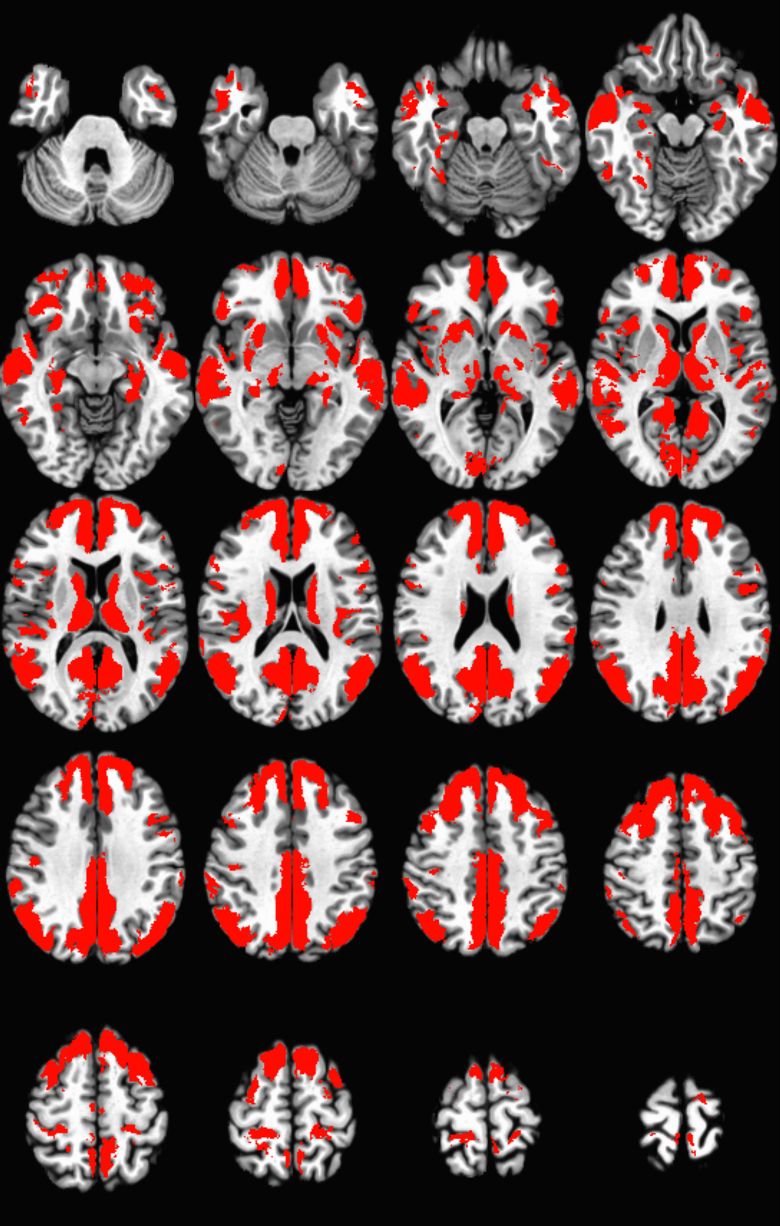
Individual rsfMRI maps were transformed to Talairach space. Group averaged maps were thresholded (p < 0.001, cluster size corrected) and added to produce a mask of regions showing significant connectivity to the PCC (Figure 1). A voxel-wise t-test compared masked regions between e4+ and e4- groups. For each subject, mean connectivity strength was calculated in each region showing significant group differences. Separately for the e4+ and e4- groups, mean connectivity in each significant region was correlated with Aβ PET centiloid values and cerebrospinal fluid (CSF) Aβ42/ Aβ40 ratio, phosphorylated-tau (p-tau 181), and total-tau (t-tau).
Results
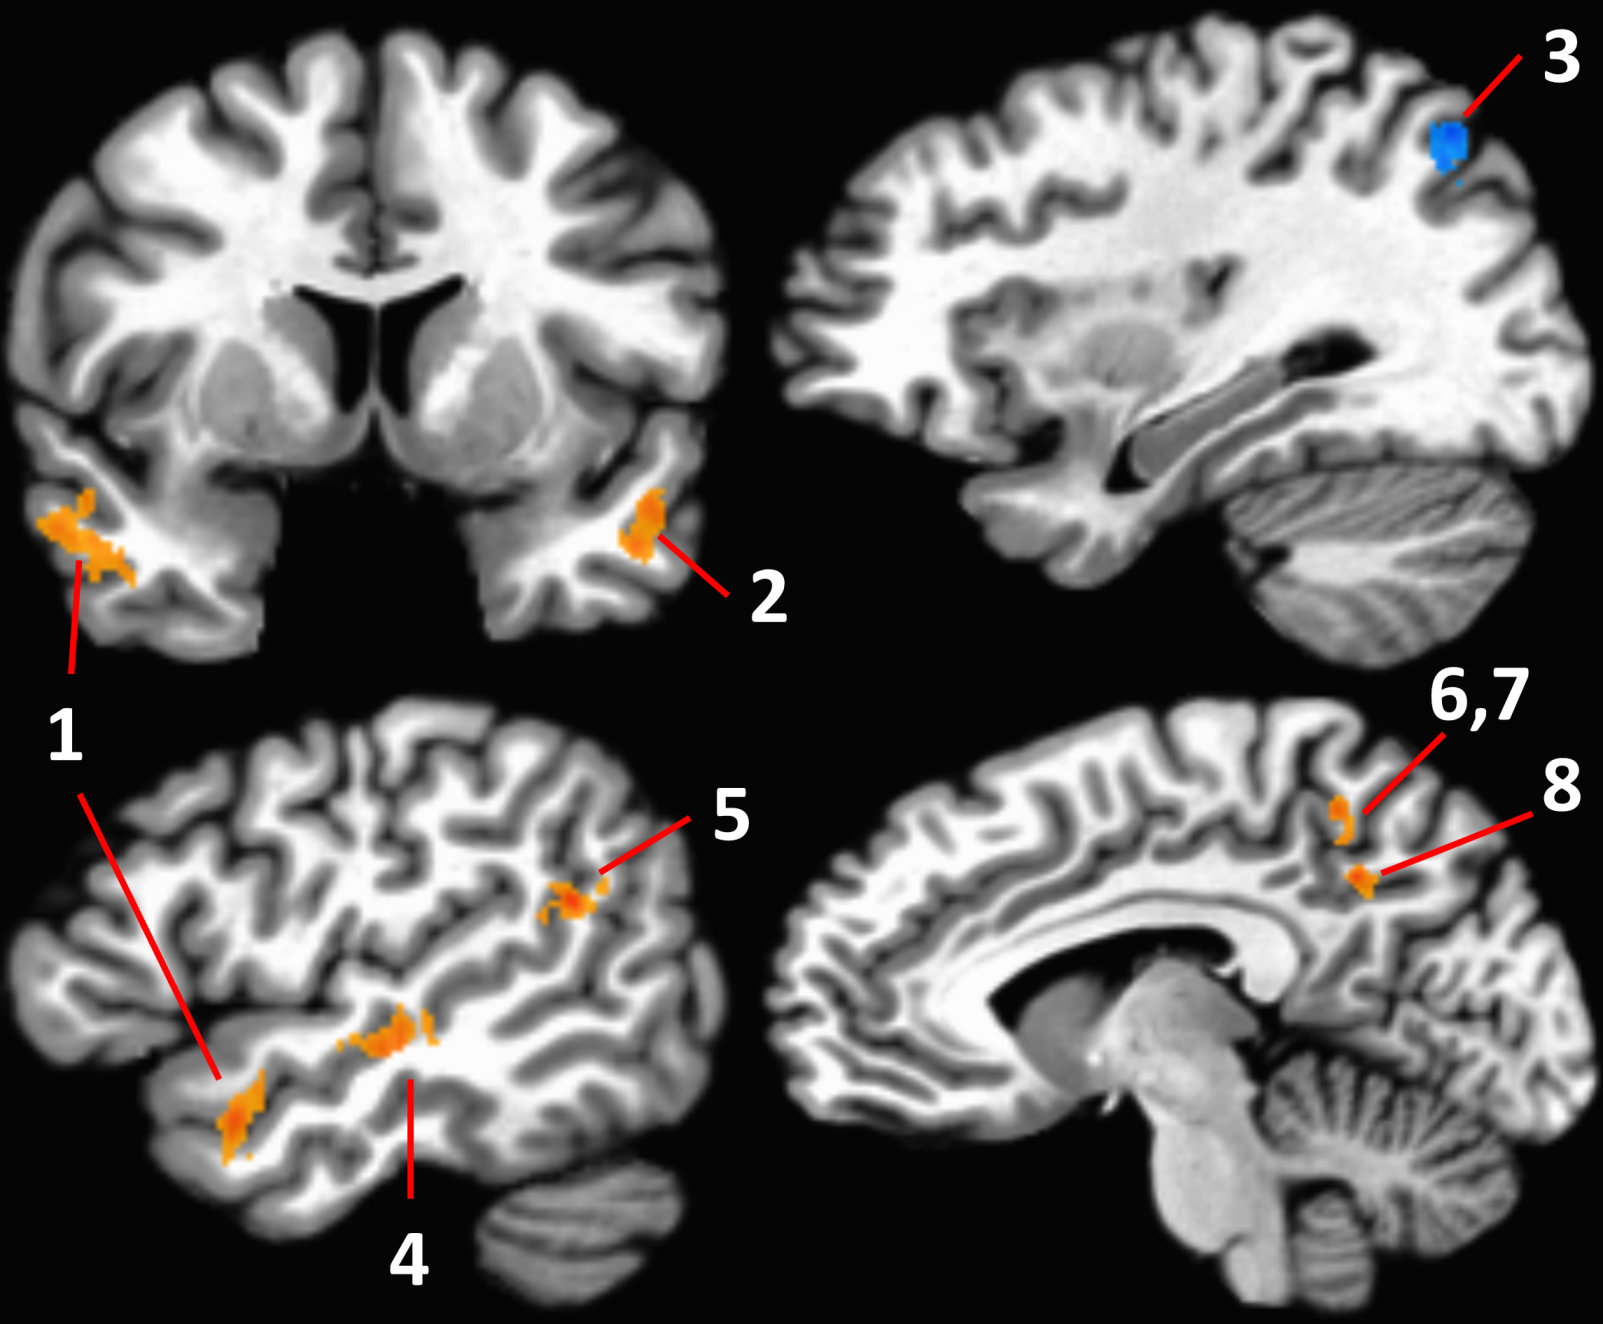
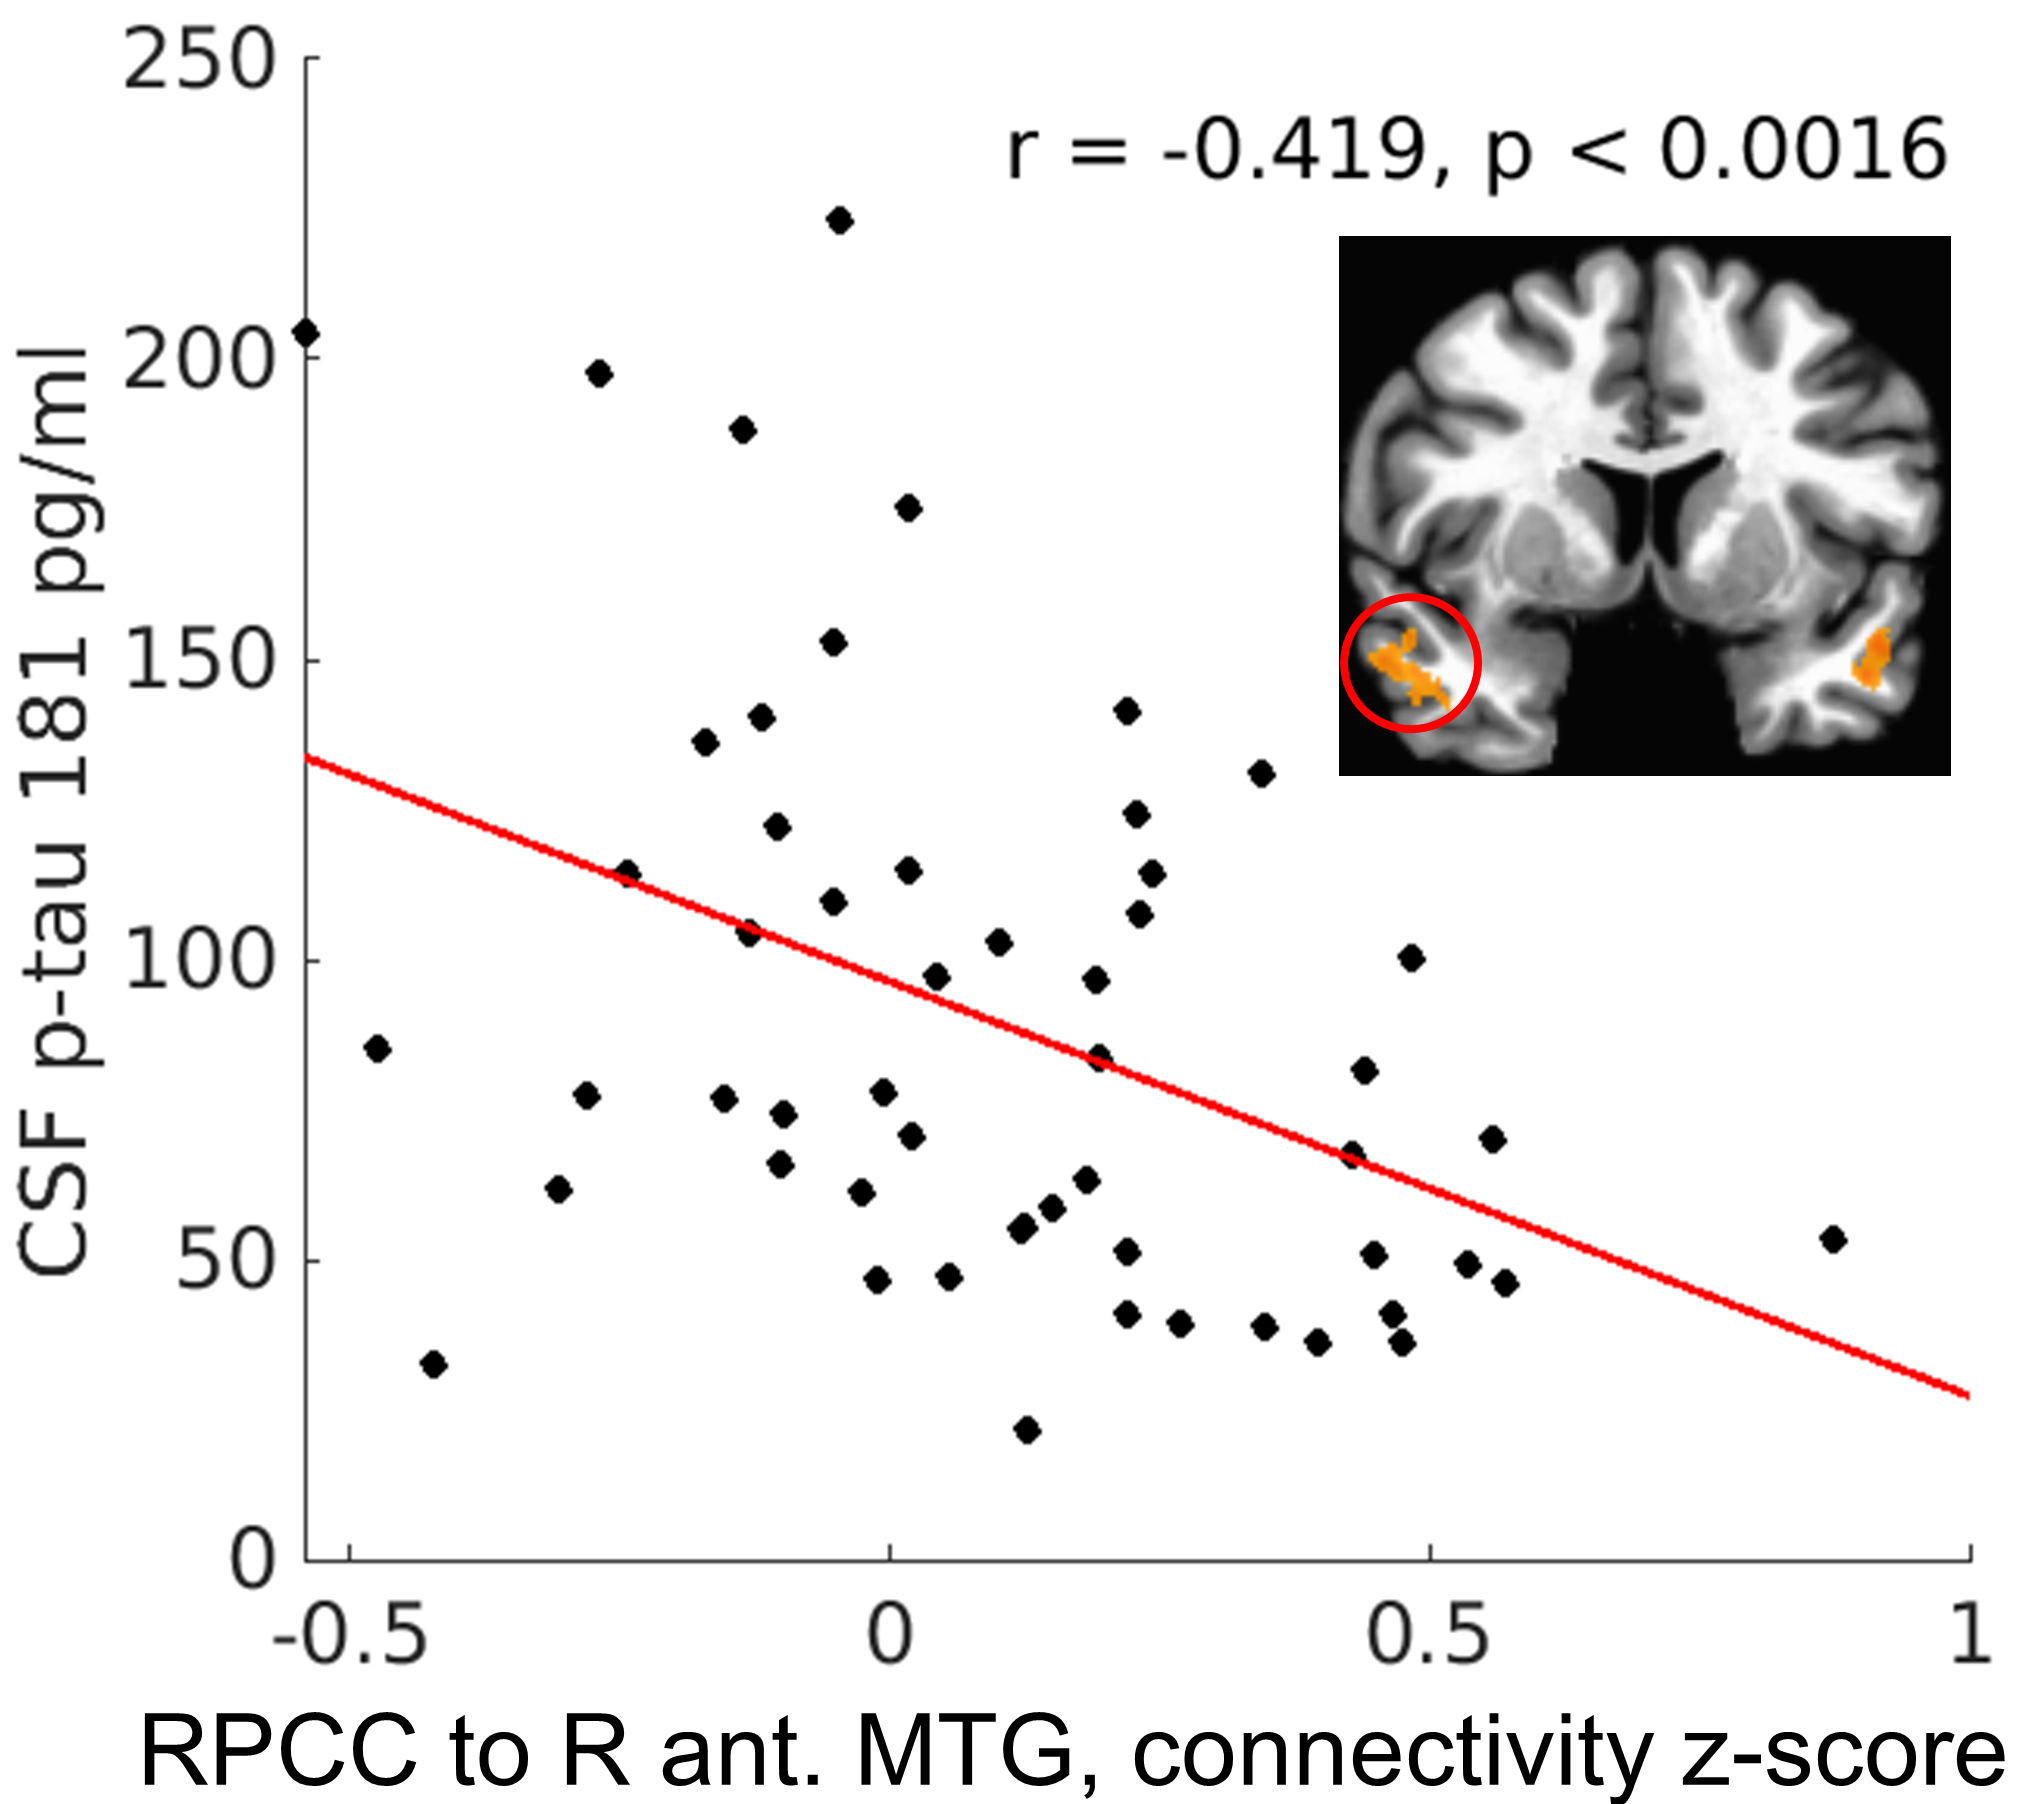
Eight regions showed APOE group differences (p < 0.05, cluster size corrected; Figure 2), with the e4+ group showing significantly weaker connectivity to seven regions and stronger connectivity to one, the right superior parietal lobule. Connectivity strength to the right PCC was significantly different in all eight regions (uncorrected p < 0.0005). All regions showed group differences in connectivity strength to the left PCC at the uncorrected p < 0.05 level, although only the right superior parietal lobule survived the cluster size correction.In the e4+ group, right PCC connectivity to the bilateral anterior middle temporal gyri (Figure 2: ROIs 1 and 2) was negatively related to both centiloid score (p < 0.03) and to CSF p-tau (p < 0.008; Figure 3). Additionally, a slightly more posterior aspect of the left middle temporal gyrus (Figure 2: ROI 4) showed a negative relationship to CSF p-tau (r = -0.30, p < 0.029). For left PCC connectivity, the right anterior middle temporal gyrus showed significant negative relationships to both centiloid score (r = -0.26, p < 0.042) and CSF p-tau (r = -0.31, p < 0.024). No significant correlations were observed between mean connectivity and biomarker values in the e4- group.
Discussion
Our findings are consistent with reports of weakened DMN connectivity in e4+ adults. Although we found increased strength of connectivity to the right superior parietal lobule, we did not replicate previous findings of increased connectivity strength in medial temporal lobe (2). Interestingly, we found that connectivity of the temporal lobe was negatively related to AD biomarkers in the e4+ group, suggesting that differences in connectivity strength may be mediated by amyloid or tau deposition.Acknowledgements
This work was supported by the National Institutes of Health (R01AG022304).References
1. Talwar, P., Kushwaha, S., Chaturvedi, M., Mahajan, V. (2021) Systematic Review of Different Neuroimaging Correlates in Mild Cognitive Impairment and Alzheimer's Disease. Clin Neuroradiol, 31(4):953-967.
2. Foo, H., Mather, K.A., Jiang, J., et al. (2020) Genetic influence on ageing-related changes in resting-state brain functional networks in healthy adults: A systematic review. Neurosci Biobehav Rev, 113:98-110.
3. Beall, E. B. & Lowe, M. J. (2014) SimPACE: generating simulated motion corrupted BOLD data with synthetic-navigated acquisition for the development and evaluation of SLOMOCO: a new, highly effective slicewise motion correction. Neuroimage, 101, 21-34.
4. Lowe MJ & Sorenson JA. (1997) Spatially filtering functional magnetic resonance imaging data. Magnetic Resonance in Medicine, 37(5):723-9.
5. Greicius, M. D., Krasnow, B., Reiss, A. L., & Menon, V. (2003) Functional connectivity in the resting brain: A network analysis of the default mode hypothesis. PNAS, 100(1), 253-258.
Figures