3525
The association of amyloid PET, metabolic brain MRI, and age in Alzheimer's disease and normal controls: An OASIS-3 dataset analysis1Department of Diagnostic and Interventional Radiology, Osaka Metropolitan University, Osaka, Japan
Synopsis
Keywords: Alzheimer's Disease, Alzheimer's Disease
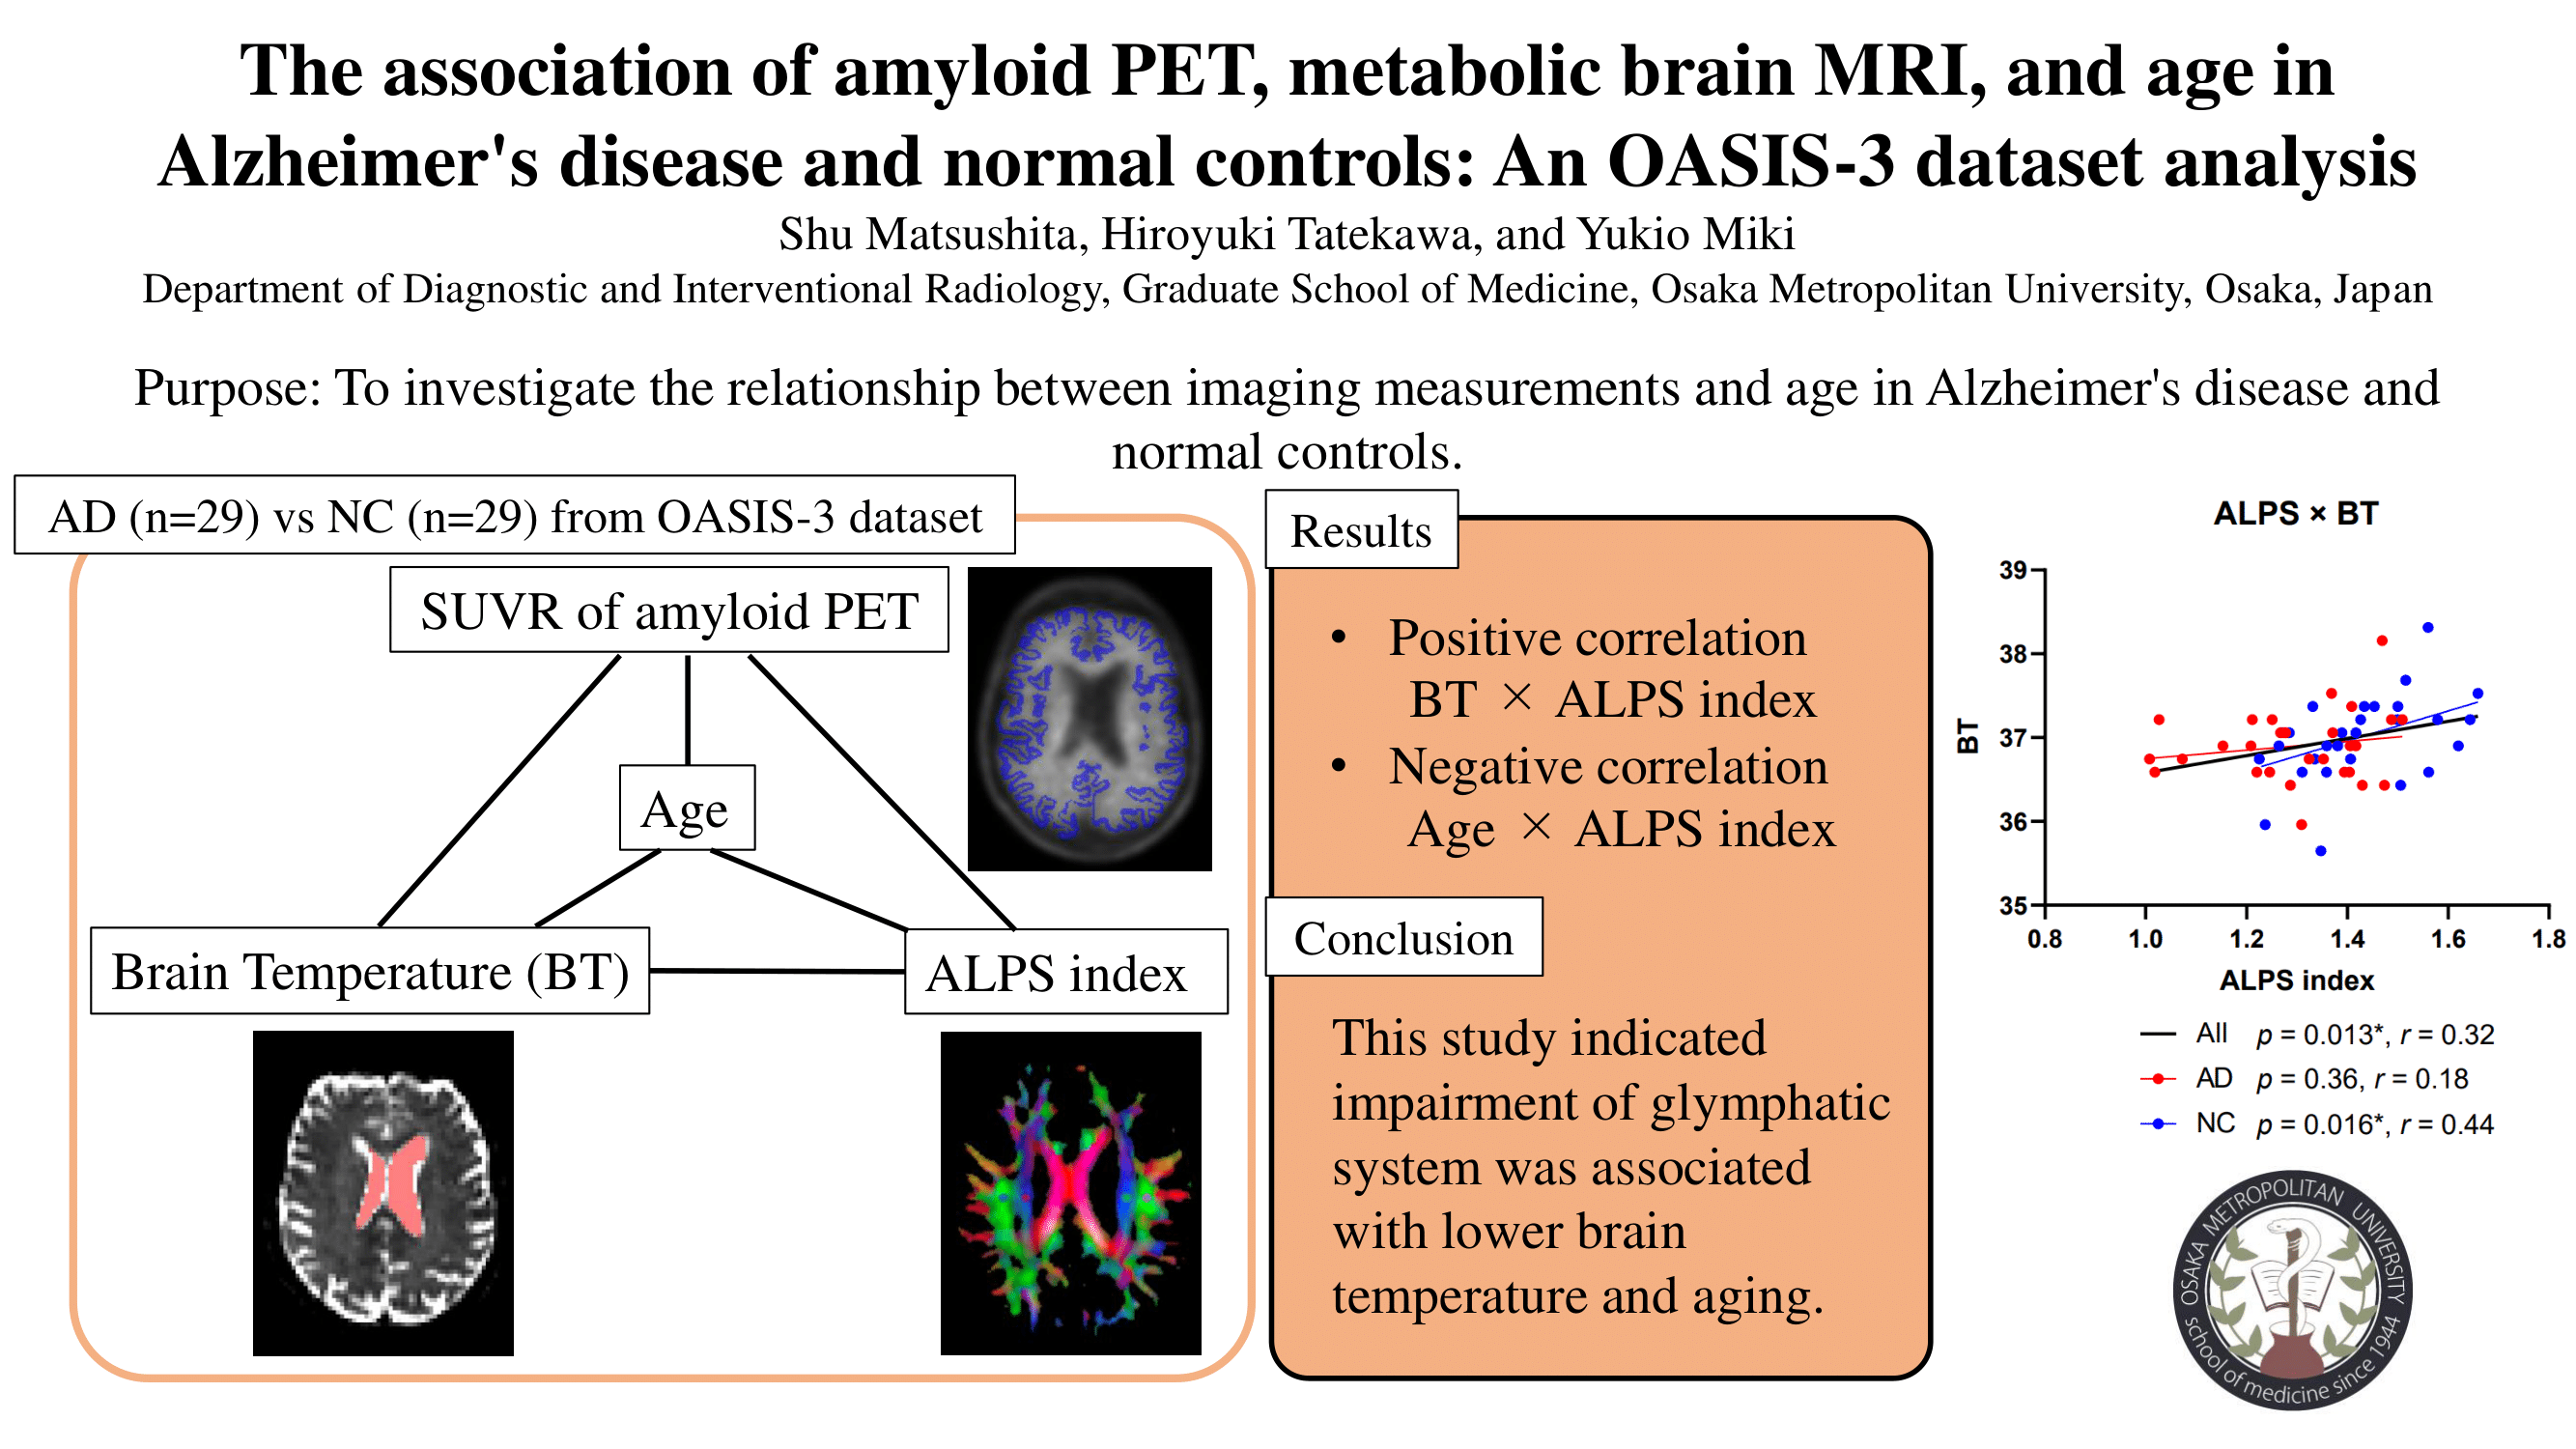
Revealing the association of amyloid PET and metabolic MRI measurements would be useful for future studies or clinical situations that evaluate Alzheimer's disease (AD). We investigated the relationship between imaging measurements and clinical information in 29 AD patients and age- and sex-matched normal controls (NCs) using OASIS-3 dataset. A significant positive correlation was found between brain temperature and index of diffusivity along the perivascular space (ALPS index) among all subjects and NCs, while a significant negative correlation was found between age and ALPS index among all subjects, AD patients, and NCs.Introduction
Brain metabolic imaging metrics are expected to be associated with brain functional activities. However, relationships between the metabolic metrics that can be measured by MRI or amyloid PET are still unclear. Revealing the association of amyloid PET and metabolic MRI measurements would be useful for future studies or clinical situations that evaluate Alzheimer's disease (AD). This study investigated the relationship between imaging measurements and clinical information in patients with AD and normal controls (NCs) using a reliable open-source dataset.Methods
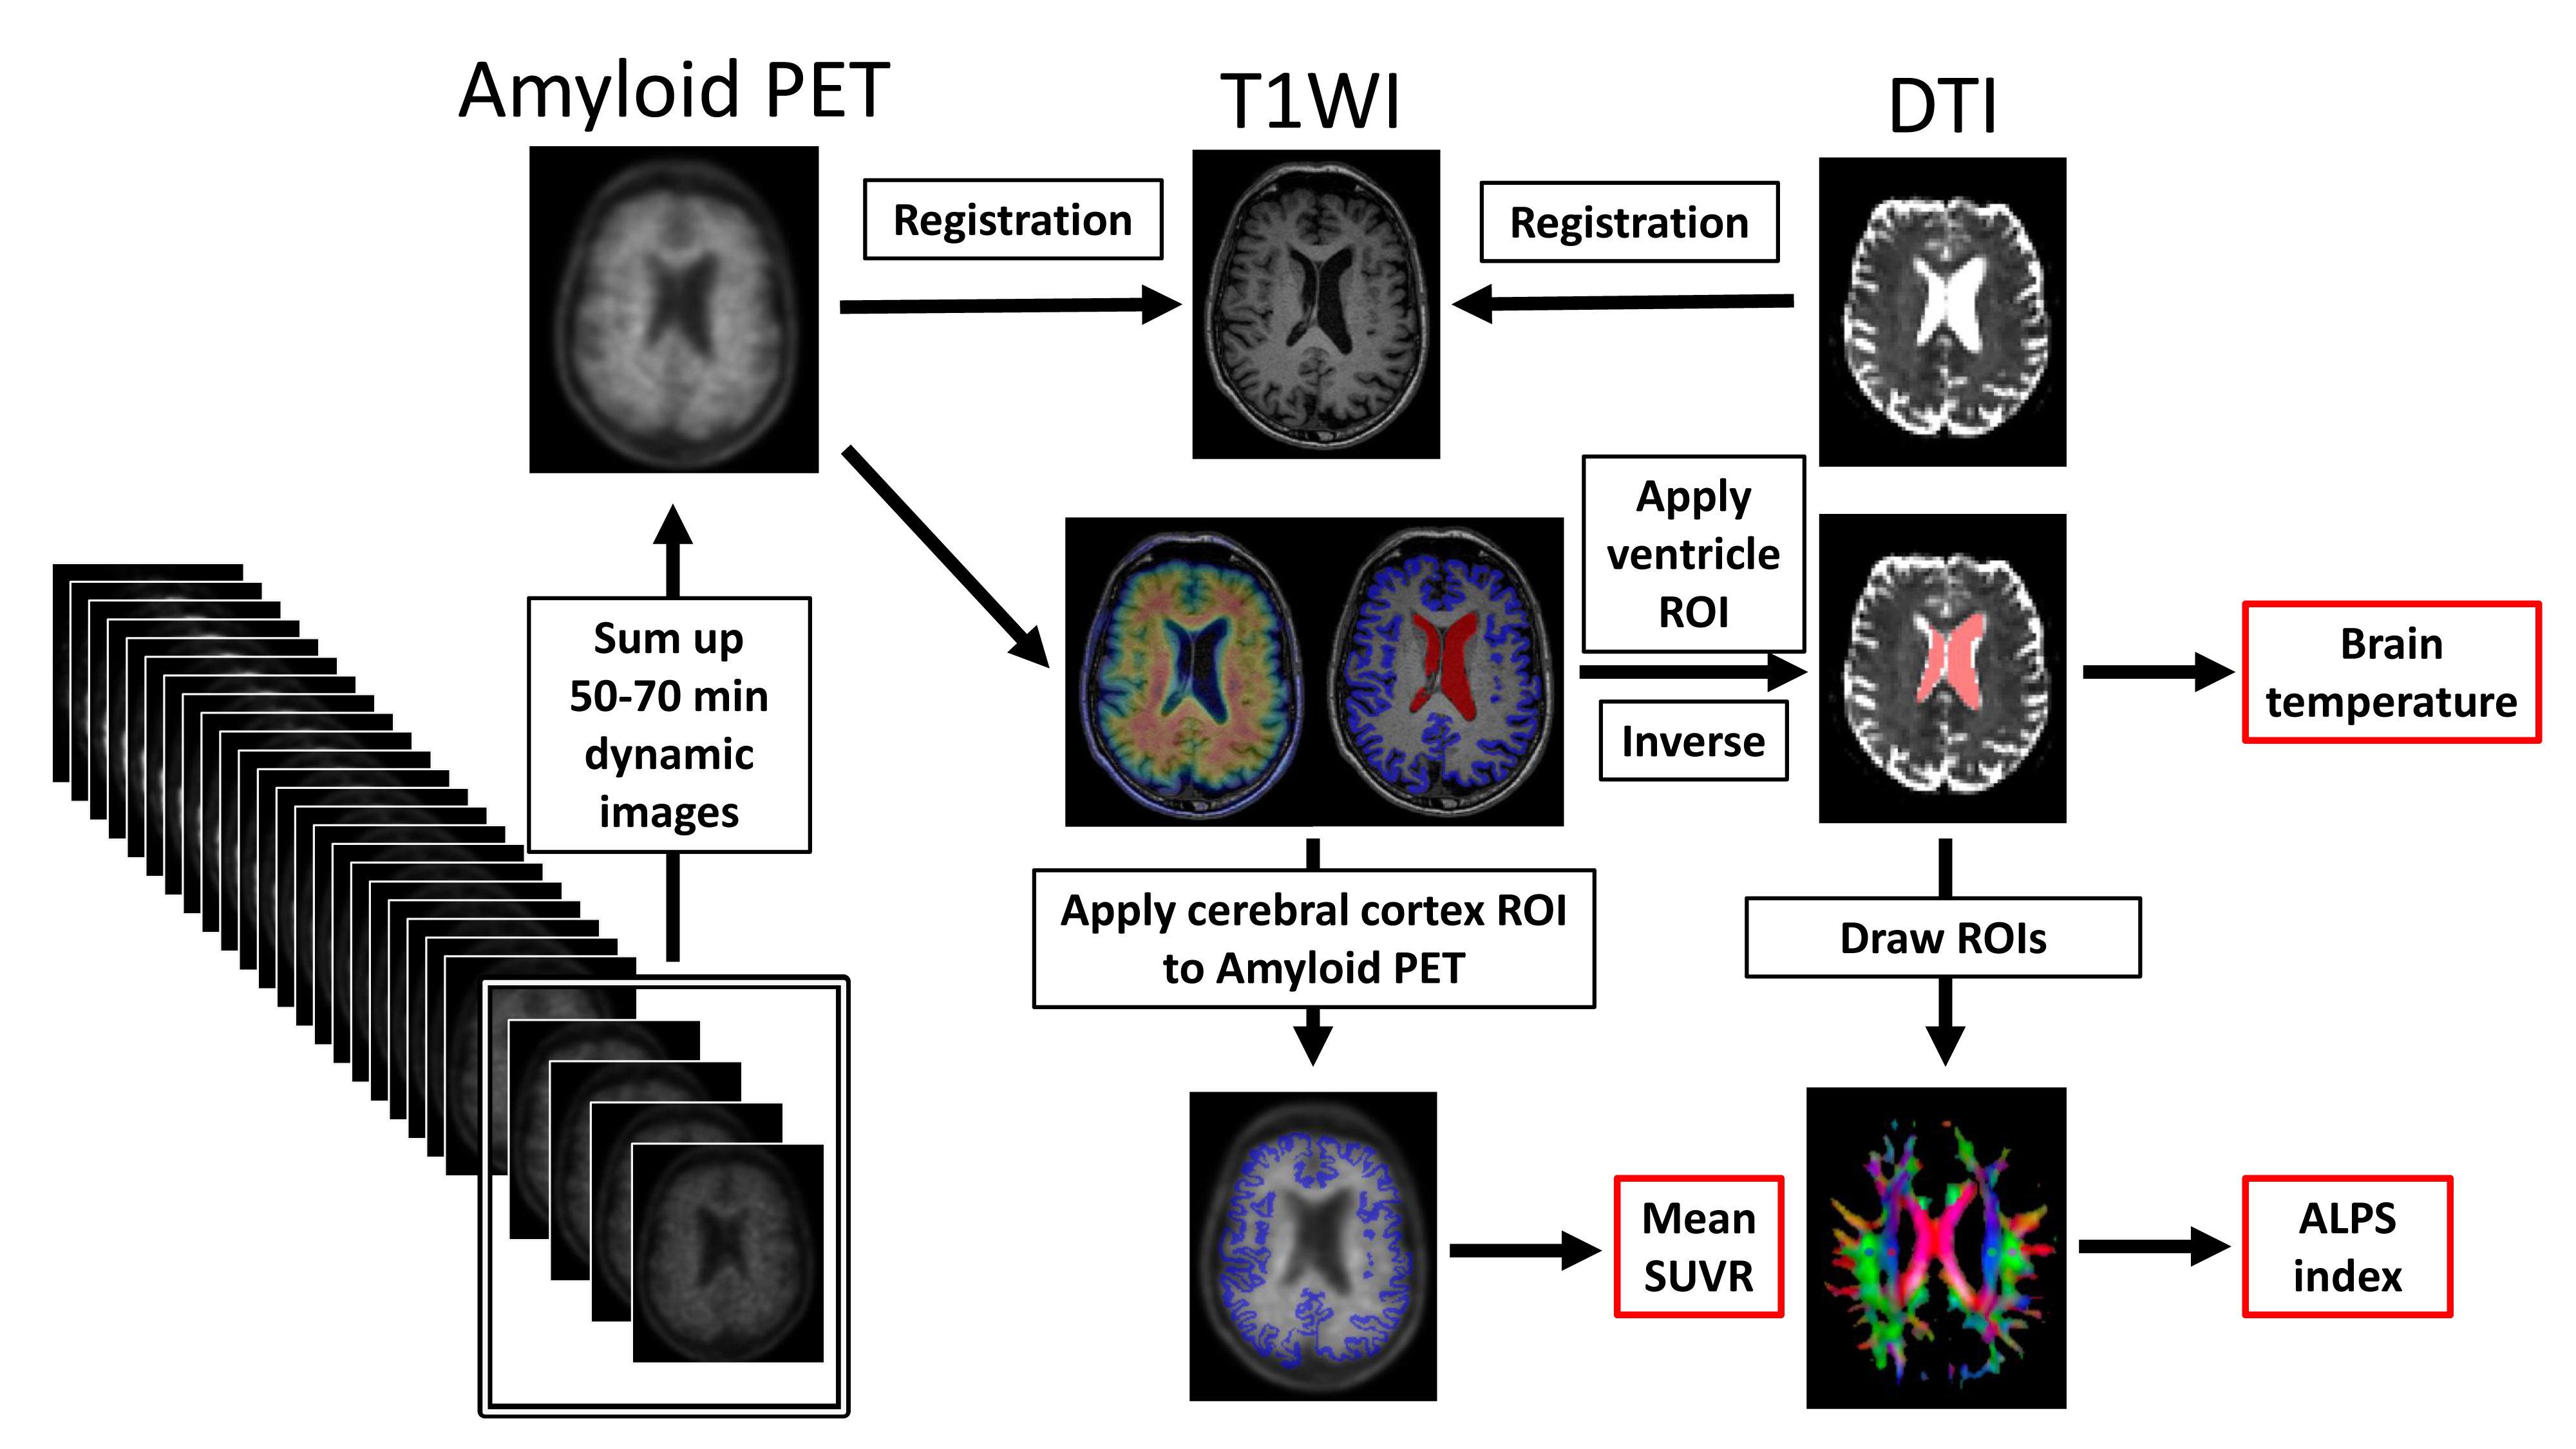
Twenty-nine AD patients with age- and sex-matched NCs were selected from OASIS-3 database. Inclusion criteria were participants who had available 3T DTI data with 64 directions and underwent 18F-florbetapir PET performed on the same day. Anatomical segmentation of MPRAGE images was performed using FreeSurfer software and cerebral cortex ROI was applied to amyloid PET images to calculate standardized uptake value ratio (SUVR). Lateral ventricle ROI was applied by inverse transform matrices to b = 0 s/mm2 DTI images using FSL software in order to calculate brain temperature (BT). The CSF temperature can be estimated using this relationship based on the studies of Mills1 and Kozak et al2 by using the following equation:$$D=ln(S_0/S)/b$$, where D is the diffusion constant (mm2/s), b is the applied diffusion weighting (s/mm2), and S0 and S are the voxel signal intensities of the reference and DWIs, respectively. The D value was converted to the corresponding temperature by the following equation:$$T=2256.74/ln(4.39221/D)–237.15$$, where T is the temperature (°C). The histogram curve was generated in Matlab (Version R2022a; MathWorks, Natick, Massachusetts) using curve-fitting method proposed by Sakai et al3. Then, the most frequent number was set as the BT.Color-coded map and diffusivity maps were created, then 5-mm spherical ROIs were manually placed on the region of the projection and association fibers adjacent to the medullary veins at the level of the lateral ventricle body on the color maps. The diffusion tensor image analysis along the perivascular space (DTI-ALPS) index measures the ratio of the mean of the bilateral x-axis diffusivity in the area of projection fibers (Dx,proj) and bilateral x-axis diffusivity in the area of association fibers (Dx,assoc) to the mean of bilateral y-axis diffusivity in the area of projection fibers (Dy,proj) and bilateral z-axis diffusivity in the area of association fibers (Dz,assoc) and is given by4:$$ALPS index=mean(D_x,proj,D_x,assoc)/mean(D_y,proj,D_z,assoc)$$ Preprocessing overview is shown in Fig. 1.
Imaging metrics, including the mean SUVR of the cerebral cortex, BT and ALPS index were compared between AD patients and NCs. The associations of each imaging measurements, age, sex and presence of Alzheimer's disease were evaluated using Pearson’s or Spearman’s correlation analyses.
Results
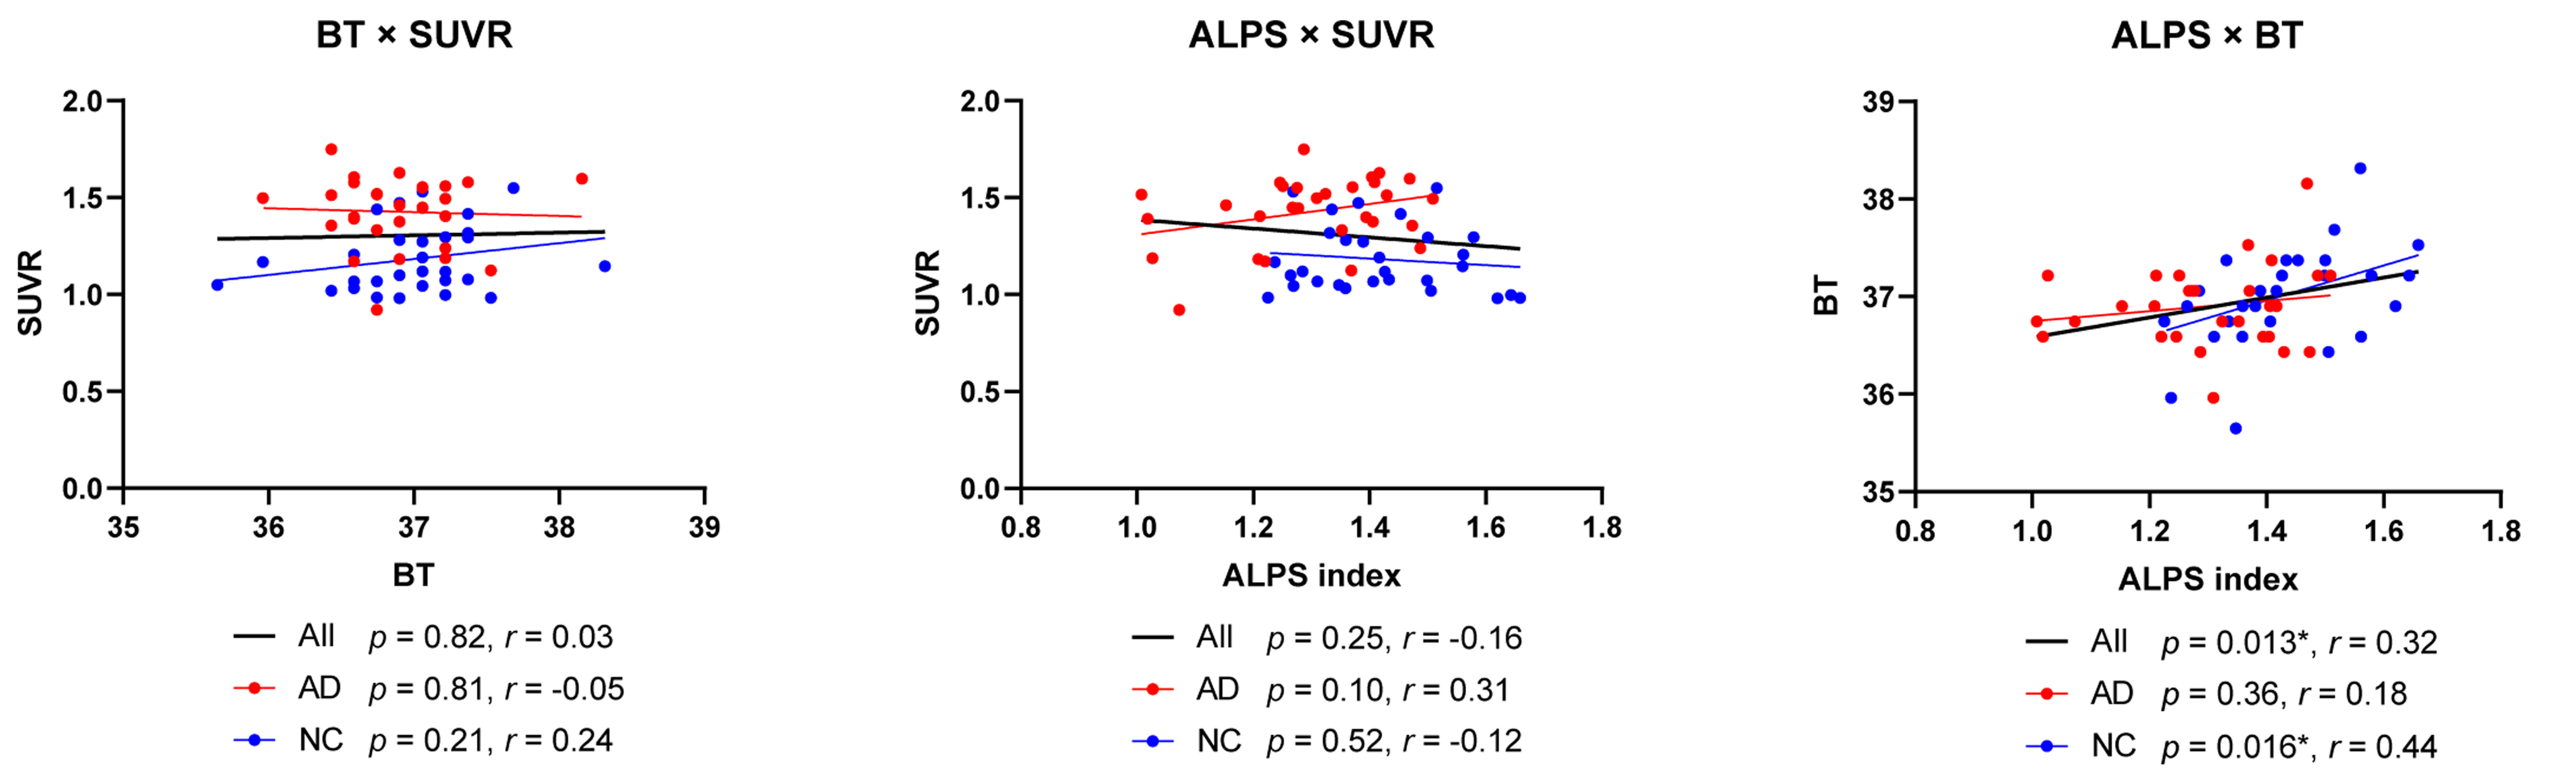
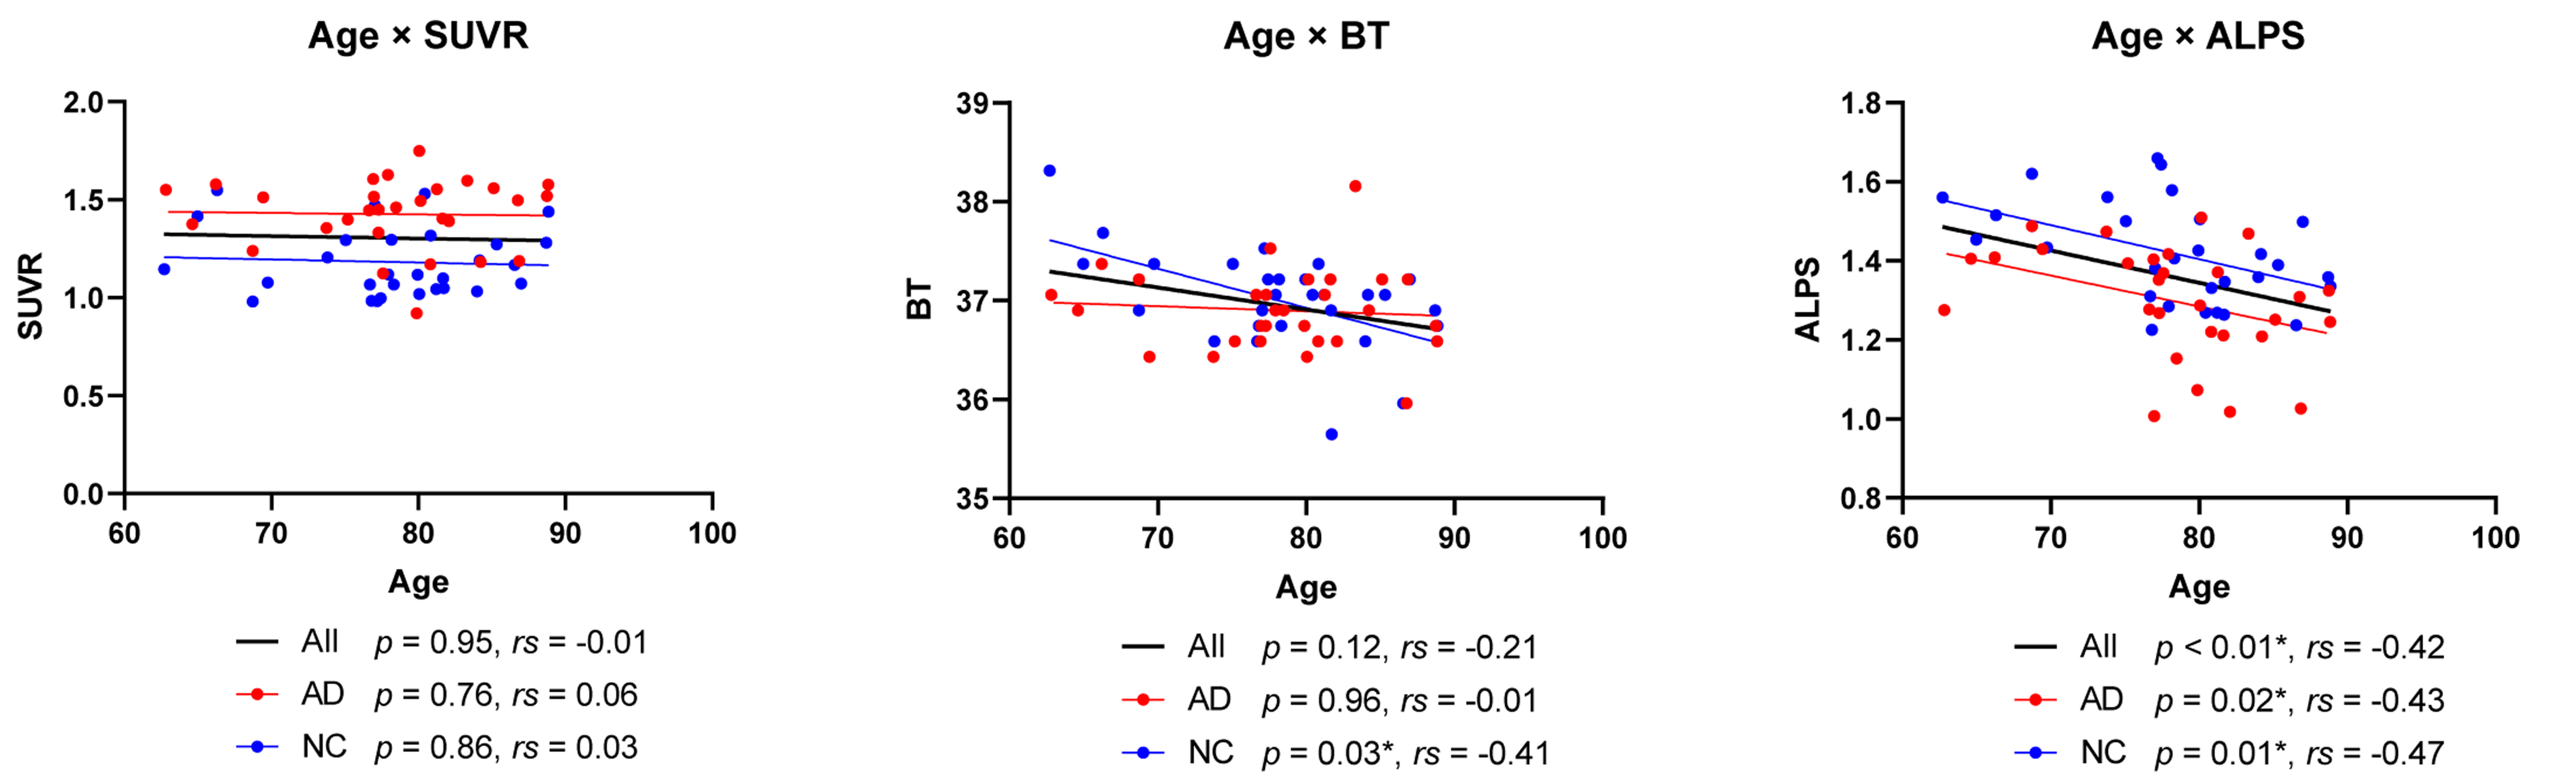
Significant differences were found in SUVR (p < 0.001) and ALPS index (p = 0.001) between AD and NC groups, while there was no significant difference in BT (p = 0.46). The SUVR of amyloid PET was not significantly associated with metabolic MRI metrics. A significant positive correlation was found between BT and ALPS index among all subjects and NCs (ps < 0.016), while a significant negative correlation was found between age and ALPS index among all subjects, AD patients, and NCs (ps < 0.021) (Fig. 2,3).Discussion
The significant positive correlation between BT and ALPS index may reflect association between BT and impairment of glymphatic system. BT reflects the water molecules diffusivity of lateral ventricle and may affect water diffusivity of the perivascular space of the periventricular white matter which is neighboring anatomical structure. Several studies have indicated impaired water diffusivity of the white matter by aging, leading to the lower ALPS index as getting older5-7. On the other hand, the exact effect of decreased ALPS index in AD patients remains unclear as same in aging subjects for now.Conclusion
This study indicated impairment of glymphatic system was associated with lower brain temperature and aging. The results of this study would be useful for future studies which validate the association of amyloid PET and metabolic MRI measurements.Acknowledgements
This work was supported by the Takeda Science Foundation and JSPS KAKENHI (grant numbers: JP17K10415 and 21K07684).
Data were provided by OASIS (OASIS-3, Longitudinal Multimodal Neuroimaging: Principal Investigators: T. Benzinger, D. Marcus, J. Morris, were supported by NIH Grants: NIH P30 AG066444, P50 AG00561, P30 NS09857781, P01 AG026276, P01 AG003991, R01 AG043434, UL1 TR000448, and R01 EB009352. 18F-florbetapir doses were provided by Avid Radiopharmaceuticals, a wholly owned subsidiary of Eli Lilly.).
References
1. Mills R. Self-diffusion in normal and heavy water in the range 1–45. deg. J Phys Chem. 1973;77:685–688.
2. Kozak L, Bango M, Szabo M, et al. Using diffusion MRI for measuring the temperature of cerebrospinal fluid within the lateral ventricles. Acta Paediatr. 2010;99:237–243.
3. Sakai K, Yamada K, Sugimoto N, et al. Calculation methods for ventricular diffusion-weighted imaging thermometry: phantom and volunteer studies. NMR Biomed. 2012;25:340–346.
4. Taoka T, Masutani Y, Kawai H, et al. Evaluation of glymphatic system activity with the diffusion MR technique: diffusion tensor image analysis along the perivascular space (DTI-ALPS) in Alzheimer’s disease cases. Jpn J Radiol. 2017;35:172–178.
5. Taoka T, Ito R, Nakamichi R, et al. Difusion‑weighted image analysis along the perivascular space (DWI–ALPS) for evaluating interstitial fluid status: age dependence in normal subjects. Jpn J Radiol. 2022;40:894–902.
6. Naganawa S, Sato K, Katagiri T, et al. Regional ADC values of the normal brain: differences due to age, gender, and laterality. Eur Radiol 2003;13:6–11.
7. Beck D, de Lange AG, Maximov II, et al. White matter microstructure across the adult lifespan: a mixed longitudinal and cross-sectional study using advanced diffusion models and brain-age prediction. Neuroimage. 2021;224:117441.
Figures