3524
Microstructure and connectivity alterations in a novel mouse model of Alzheimer’s disease1Department of Radiology and Imaging Sciences, Indiana University School of Medicine, Indianapolis, IN, United States, 2Stark Neurosciences Research Institute, Indianapolis, IN, United States
Synopsis
Keywords: Alzheimer's Disease, Alzheimer's Disease, mice
Alzheimer’s disease is a common neurodegenerative dementia. Although disease has no cure, early intervention can help to maintain normal mental function and slow down the progression of the disease. A comprehensive study incorporating diffusion tensor imaging (DTI), diffusion kurtosis imaging (DKI), neurite orientation dispersion and density imaging (NODDI), brain connectivity and fixel-based analysis (FBA) is still lacking. Hence, we aim to apply these methods in a novel SAA mouse model of Alzheimer’s disease. We found there was significant difference in cortex and hippocampus in between control B6 and SAA groups.INTRODUCTION
Alzheimer’s disease (AD) is a brain disorder affecting more than 35 million people today 1. AD causes degeneration of brain cells and is a common cause of dementia, characterized by a decline in daily activity, memory loss, and other cognitive abilities 2,3. Mouse models are one of the prime research tools for finding new treatments for AD. The dMRI is a powerful non-invasive MR imaging technique to detect microstructural changes in brain tissue that measures diffusion at the molecular level 4. Hence, we apply the diffusion MRI (dMRI) technique to investigate a novel mouse model of AD 4,5.METHODS
Data acquisitionAll animal experiments were carried out in compliance with the local institutional animal care and use committee. Seven AppSAA Knock-in (SAA) and Seven B6 mice brains at the age of 12 months were included in this study. A multi-shot 2D echo planar imaging (EPI) pulse sequence was applied in 18 diffusion directions with b-values 600, 1200, 1800, and 2500 s/mm2 and 4 non-diffusion-weighted (b0) measurements. A T2*-weighted image was also acquired using a gradient echo sequence at 25 µm isotropic resolution.
Data Analysis
The data underwent preprocessing steps, namely denoising 6, Gibb’s artifact removal 7, distortion correction, eddy-current 8, and bias-field correction 9. The preprocessed data were fitted to DTI metrics namely Fractional Anisotropy (FA), Mean Diffusivity (MD), Axial Diffusivity (AD), and Radial Diffusivity (RD) using MRtrix3 10. The data were fitted to the DKI model to determine Kurtosis Fractional Anisotropy (KFA), Mean Kurtosis (MK), Axial Kurtosis (AK), and Radial Kurtosis (RK) using DIPY 11. Similarly, Neurite Density Index (NDI) and Orientation Dispersion Index (ODI) were calculated using the NODDI model 12. Subject FA image was registered to template FA using ANTs registration 13 and the 165 template labels were warped back to subject space for statistical analysis. The p-value was set at a 0.05 level of significance.
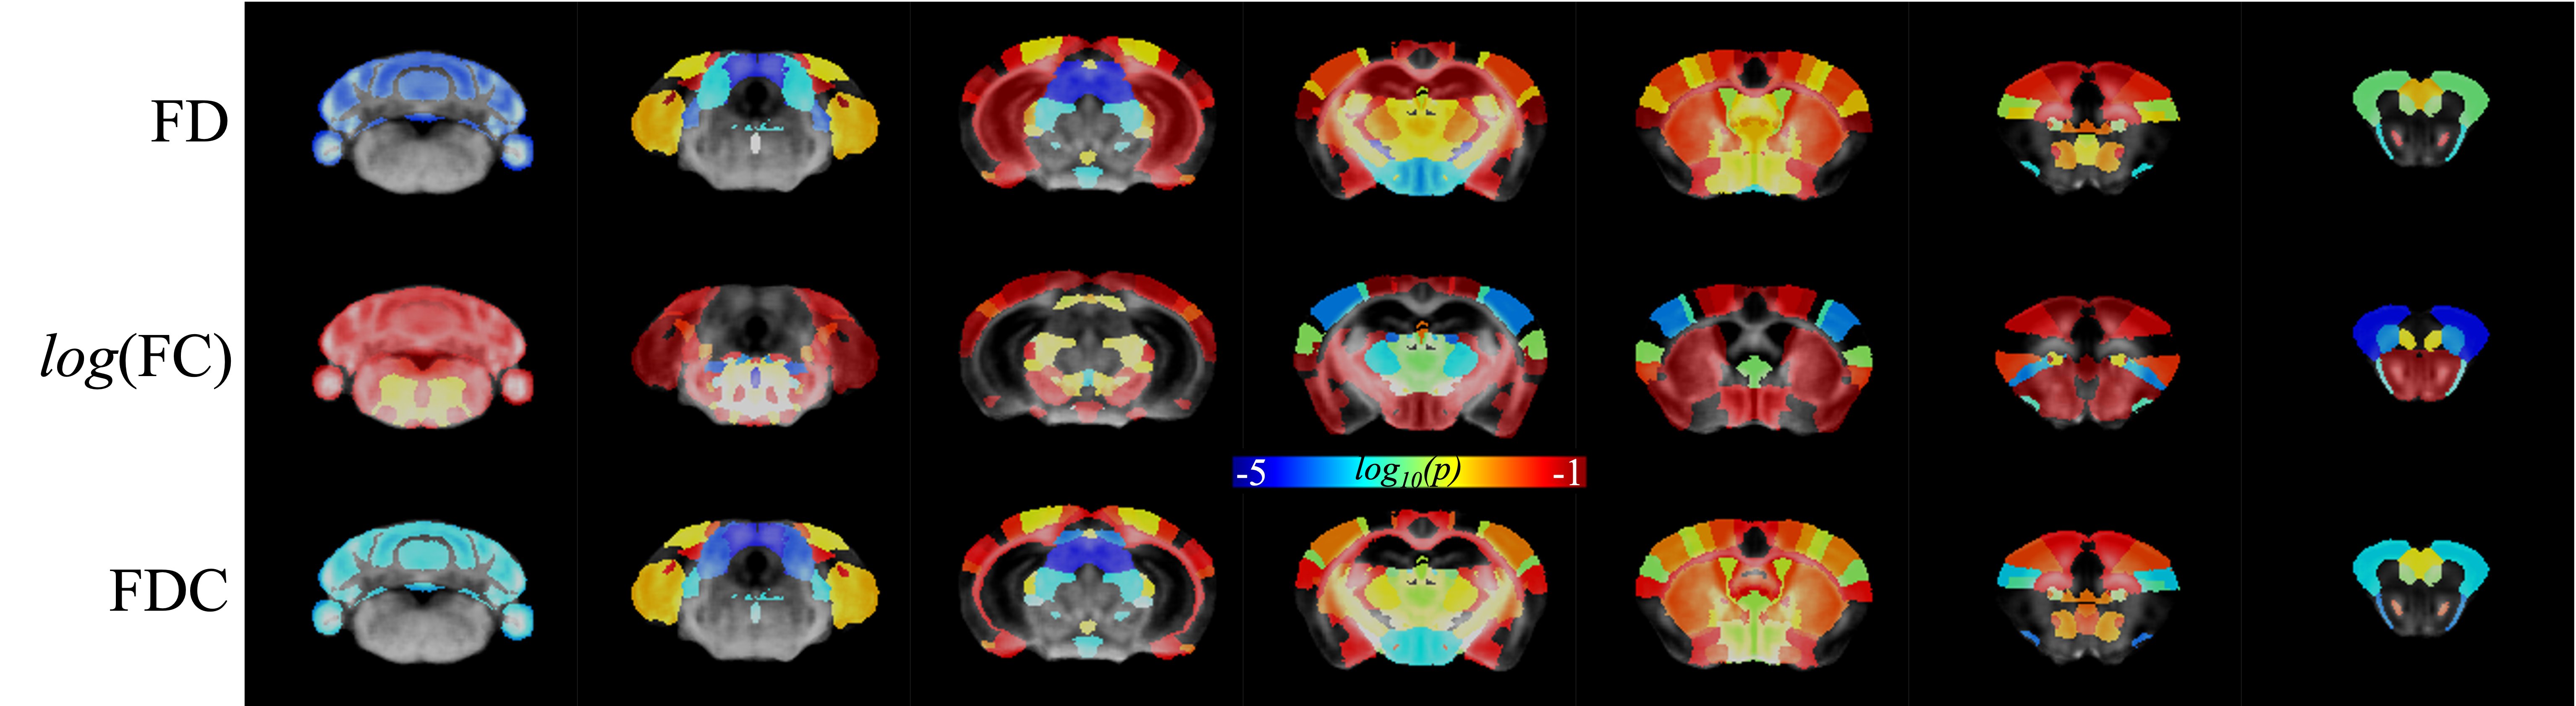
Fully automated unsupervised method to obtain 3-tissue response functions, including white matter, gray matter, and CSF 14. Multi-shell Multi-Tissue Constrained Spherical Deconvolution method 15 was used to compute the fiber orientation distribution (FOD). Probabilistic tractography 16 was generated from those FODs and the tracts were filtered such that the streamline densities match the FOD lobe integrals 17. The whole brain connectome was generated using tck2connectome 18 in MRtrix3 with 165 regions of interest (ROIs). These ROIs are the nodes, and their connections are the edges. A variety of brain connectivity measures was calculated using Brain Connectivity Toolbox (BCT) 19, namely clustering coefficient, degree, strength, eigenvector centrality, and local efficiency. The fixel-Based Analysis (FBA) was used to perform fiber-specific statistical analysis. Fixel-based metrics, namely fiber density (FD), fiber-bundle cross-section (FC), and fiber density cross-section (FDC) were calculated. The Family-wise error (FWE) p-value of fixel space was averaged in voxel space and set at p-value < 0.05.
RESULTS
The SAA demonstrated (dark spots) beta-amyloid depositions in T2* weighted image as shown in Figure 1. The volume of the whole cortex was significant at p=0.001, whereas the volume of the hippocampus was not significant at p=0.902. FA was decreased in SAA in the cortex and hippocampus. The cortex and hippocampus of SAA mice demonstrated significant FA at a p-value of 0.0203 and 0.005 respectively as shown in Figure 2.KFA, MK, and RK demonstrated significance at p-value 0.0049, 0.0008, and 0.0016 respectively. The hippocampus showed significance in KFA, MK, and RK at p-value 0.009, 0.0254, and 0.0042 respectively as shown in Figure 3. The NODDI model was not significant in the hippocampus, whereas few regions of the cortex were statistically significant as illustrated in Figure 3.
The connectivity analysis of the cortex showed clustering coefficient and eigenvector centrality were significant at p-value 0.0405 and 0.0277, whereas degree, strength, and local efficiency were not significant at 0.9254, 0.3196, and 0.833 respectively. The connectome of the hippocampus demonstrated eigenvector centrality was statistically significant at p=0.0053, whereas clustering coefficient, degree, strength, and local efficiency were not statistically significant at p-value 0.2674, 0.8448, 0.0985, and 0.4163 respectively as depicted in Figure 4. Whole brain FBA showed whole cortex and hippocampus were statistically significant at p < 0.05 as shown in Figure 5.
DISCUSSION
FA was reduced in SAA mice, whereas MD, AD, and RD were increased. This implied impaired fiber integrity in Alzheimer’s disease. KFA was decreased and MK, AK, and RK were significantly changed in the SAA. This indicated damaged microstructural integrity. NDI and OD results indicated reduced intracellular contents of axons and dendrites and increased fiber tract dispersion in Alzheimer’s. In the SAA cortex, the nodes were more clustered but less connected to each other in SAA. In the SAA hippocampus, the nodes were less connected to each other in the hippocampus. The mean p-value map over all brain areas at threshold p<0.05 demonstrated FBA was highly sensitive to AD compared to other diffusion algorithms. FBA analysis showed both microstructural fiber density and macroscopic fiber cross-section changes in Alzheimer’s SAA model. Future work will be conducted to correlate these metrics with histology.CONCLUSION
Diffusion MRI could be used as an imaging biomarker to detect microstructural changes and connectivity alterations in novel AD mouse models. FBA showed high sensitivity to AD.Acknowledgements
This work was supported by NIH R01NS125020, Indiana Center for Diabetes and Metabolic Diseases Pilot and Feasibility Grant, AD Pre-clinical Translational Grant, and Strategic Research Initiative (SRI) IUH and Indiana University School of Medicine.References
1. Hall AM, Roberson ED. Mouse Models of Alzheimer’s Disease. Brain Res Bull. 2012 May;88(1):3.
2. Wang N, Zhang J, Cofer G, Qi Y, Anderson RJ, White LE, et al. Neurite orientation dispersion and density imaging of mouse brain microstructure. Brain Struct Funct. 2019 Jun;224(5):1797–813.
3. Maharjan S, Tsai AP, Lin PB, Ingraham C, Jewett MR, Landreth GE, et al. Age-dependent microstructure alterations in 5xFAD mice by high-resolution diffusion tensor imaging. Front Neurosci. 2022 Aug [cited 2022 Sep 7];0:1299.
4. Crater S, Maharjan S, Qi Y, Zhao Q, Cofer G, Cook JC, et al. Resolution and b value dependent structural connectome in ex vivo mouse brain. Neuroimage. 2022 Jul [cited 2022 Sep 7];255:119199.
5. Wang N, White LE, Qi Y, Cofer G, Johnson GA. Cytoarchitecture of the Mouse Brain by High Resolution Diffusion Magnetic Resonance Imaging. Neuroimage. 2020 Aug;216:116876.
6. Veraart J, Novikov DS, Christiaens D, Ades-aron B, Sijbers J, Fieremans E. Denoising of diffusion MRI using random matrix theory. Neuroimage. 2016 Nov;142:394.
7. Kellner E, Dhital B, Kiselev VG, Reisert M. Gibbs-ringing artifact removal based on local subvoxel-shifts. Magn Reson Med. 2016 Nov;76(5):1574–81.
8. Andersson JLR, Sotiropoulos SN. An integrated approach to correction for off-resonance effects and subject movement in diffusion MR imaging. Neuroimage. 2016 Jan;125:1063–78.
9. Tustison NJ, Avants BB, Cook PA, Zheng Y, Egan A, Yushkevich PA, et al. N4ITK: improved N3 bias correction. IEEE Trans Med Imaging. 2010 Jun;29(6):1310–20.
10. Tournier JD, Smith R, Raffelt D, Tabbara R, Dhollander T, Pietsch M, et al. MRtrix3: A fast, flexible and open software framework for medical image processing and visualisation. Neuroimage. 2019 Nov;202.
11. Garyfallidis E, Brett M, Amirbekian B, Rokem A, van der Walt S, Descoteaux M, et al. Dipy, a library for the analysis of diffusion MRI data. Front Neuroinform. 2014 Feb;8.
12. Daducci A, Canales-Rodríguez EJ, Zhang H, Dyrby TB, Alexander DC, Thiran JP. Accelerated Microstructure Imaging via Convex Optimization (AMICO) from diffusion MRI data. Neuroimage. 2015 Jan;105:32–44.
13. Avants BB, Tustison NJ, Song G, Cook PA, Klein A, Gee JC. A reproducible evaluation of ANTs similarity metric performance in brain image registration. Neuroimage. 2011 Feb;54(3):2033–44.
14. (ISMRM 2019) Improved white matter response function estimation for 3-tissue constrained spherical deconvolution.
15. Jeurissen B, Tournier JD, Dhollander T, Connelly A, Sijbers J. Multi-tissue constrained spherical deconvolution for improved analysis of multi-shell diffusion MRI data. Neuroimage. 2014 Dec;103:411–26.
16. (ISMRM 2010) Improved Probabilistic Streamlines Tractography by 2nd Order Integration Over Fibre Orientation Distributions.
17. Smith RE, Tournier JD, Calamante F, Connelly A. SIFT: Spherical-deconvolution informed filtering of tractograms. Neuroimage. 2013 Feb;67:298–312.
18. Smith RE, Tournier JD, Calamante F, Connelly A. The effects of SIFT on the reproducibility and biological accuracy of the structural connectome. Neuroimage. 2015 Jan;104:253–65.
19. Rubinov M, Sporns O. Complex network measures of brain connectivity: uses and interpretations. Neuroimage. 2010 Sep;52(3):1059–69.
Figures