3518
Quantitative Gradient Recalled Echo (qGRE) MRI enables preatrophic neurodegeneration measurement in a mouse model of Alzheimer’s Disease1Translational Imaging, Merck & Co, West Point, PA, United States, 2Mallinckrodt Institute of Radiology, Washington University, St Louis, MO, United States
Synopsis
Keywords: Alzheimer's Disease, Animals
There is an unmet need for non-invasive technique for measurement of neurodegeneration in Alzheimer’s Disease (AD). Quantitative Gradient-Recalled-Echo (qGRE) MRI showed promise to address this in patients through quantification of tissue specific R2* relaxation showing neurodegeneration before atrophy. Here qGRE is optimized and applied for the first time to measure progression of this preatrophic neurodegeneration in Tg4510 mouse model of AD. Histological neuronal density quantification and test-retest measurements validated R2* measurements. We showed significant decrease in normalized median hippocampus R2* between 3, 5 and 6 month-old Tg4510 mice. The method can be applied in AD drug discovery and model development.Introduction
Alzheimer’s disease (AD) is a debilitating illness affecting more than 6.5 million individuals in the USA alone, causing memory loss and cognitive decline, and may lead to death. As the population ages, the prevalence of AD is also projected to grow rapidly. While significant efforts are taken to develop novel therapies, there is an urgent unmet need for efficient and early diagnosis, staging and treatment response evaluation, both in patients and in mouse models to support the active drug research in the field. MRI methods provide a promising tool, enabling multiparametric evaluation of brain volume, local atrophy and potential vascular damage. Recently it was demonstrated [1] that a quantitative Gradient Recalled Echo (qGRE) MRI technique [2] allows evaluation of neurodegeneration in AD prior to tissue volumetric atrophy develops- “preatrophic” neurodegeneration. qGRE technique is based on a GRE MRI sequence with multiple gradient echoes and a theoretical model for data analysis allowing separation of tissue-specific (R2t*), blood oxygen level dependent (R2’) and macroscopic field inhomogeneities from the total R2* relaxation. Here, the qGRE method is adapted and applied to a mouse model of AD, Tg4510, to enable its broad technical and biological validation, and use in preclinical AD research, where the technique can be invaluable in drug discovery. Tg4510 mice develop early tauopathy and are known to show gradual decrease in neuronal density with age [3], a good model for validation of the approach. We show for the first time that the qGRE method can be used for longitudinal measurements of changes in neuronal density in mouse brain.Methods
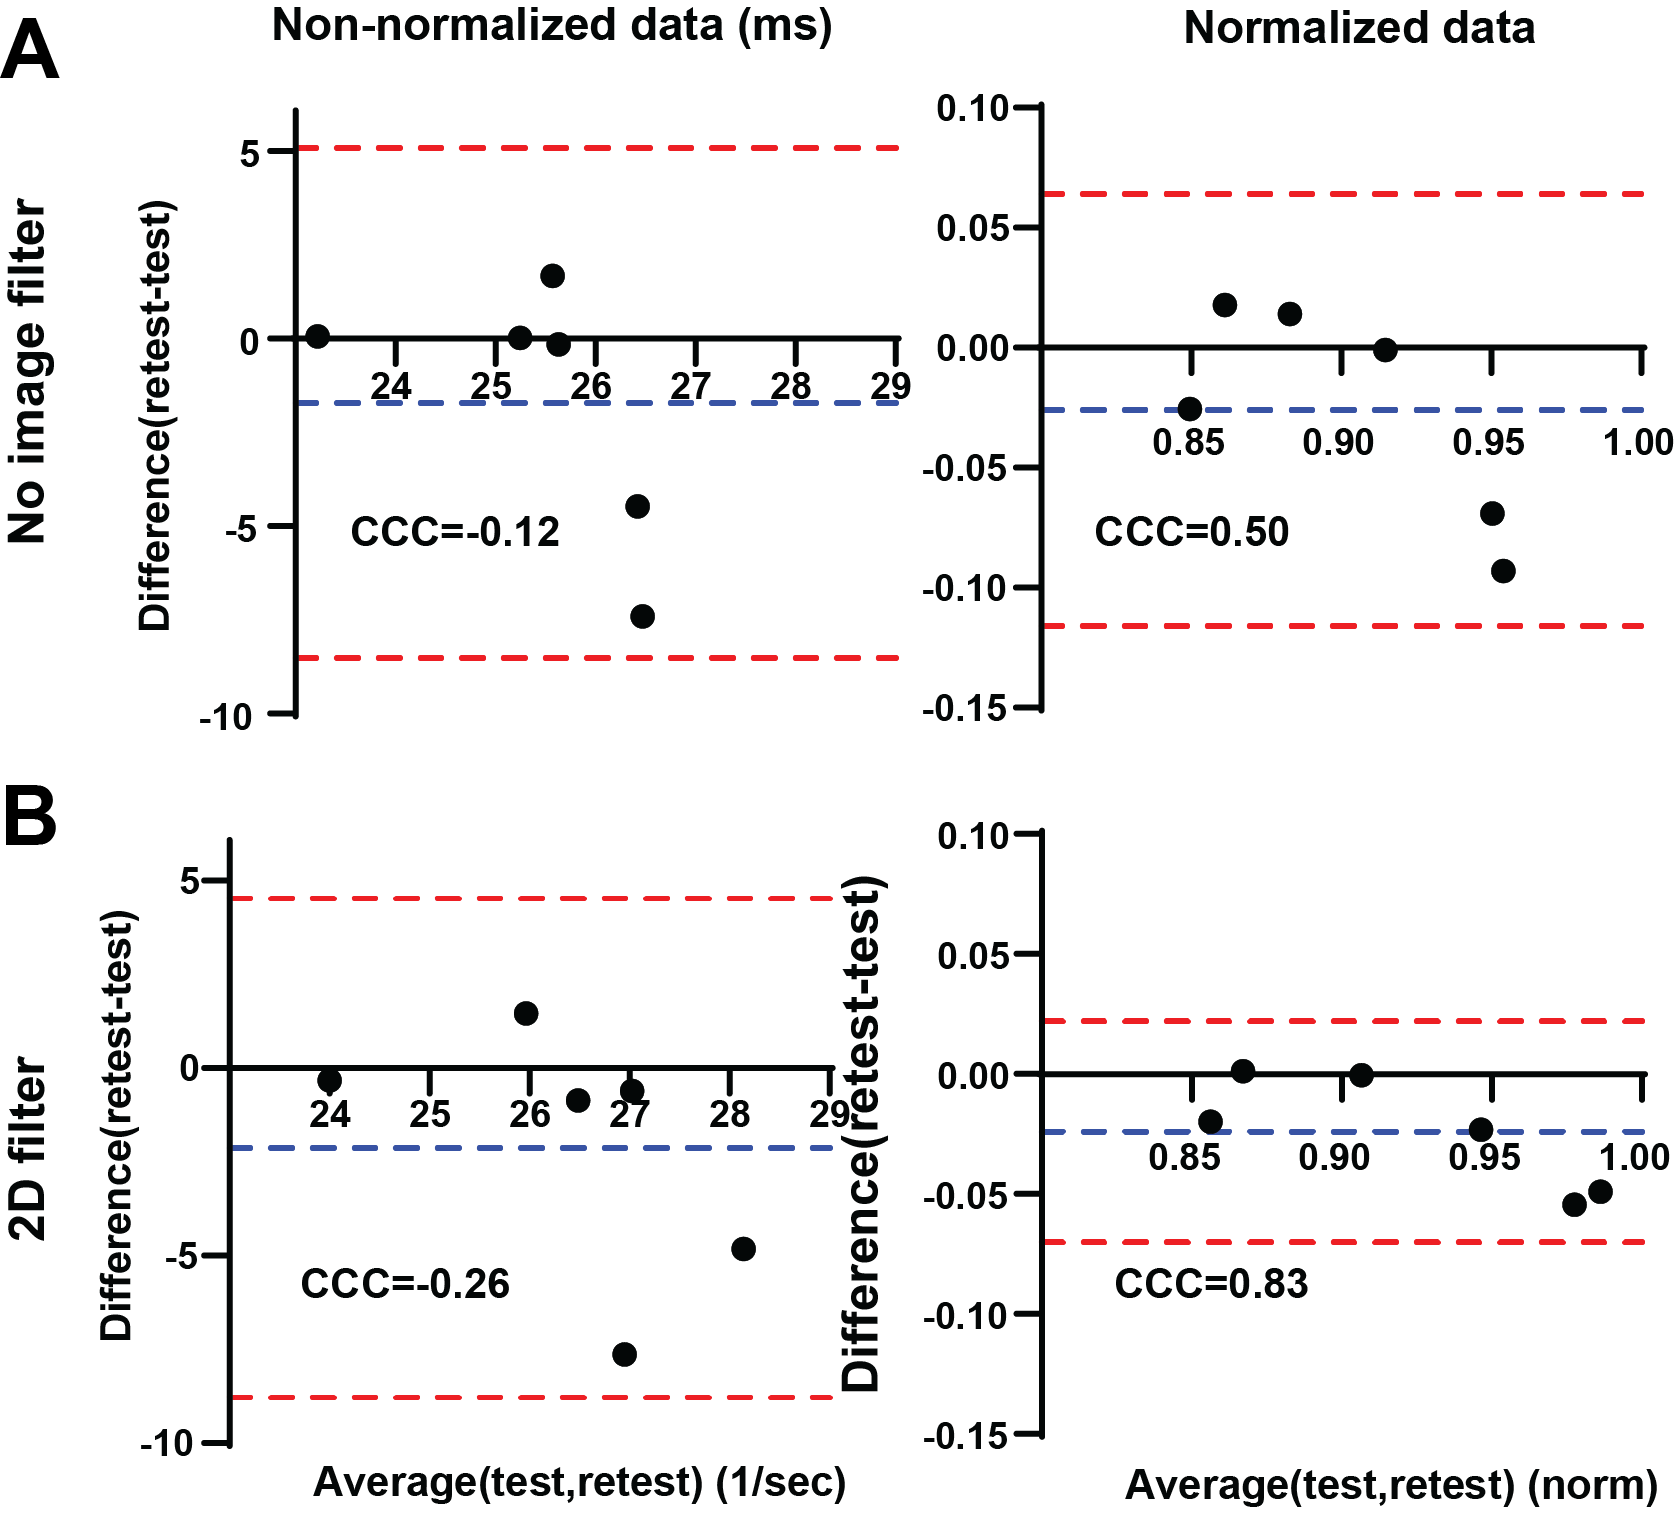
Tg4510 (n=15) and wild type (WT, n=7) mice underwent MRI (7T field strength, 22mm brain volume coil). TG4510 at 3,5 and 6 months old (mo), WT at 3 and 5mo. 3D Multi-GRE sequence was used with 22 gradient-recalled echoes, TE1=2ms, deltaTE=2ms, TR=50ms, FA=10deg, matrix size 52x105x105 (slice, read, phase), FOV=16x16x16mm^3, 2 averages. Data were analyzed using approach developed in [2]. In our experiments, we used voxel spread function method [4] to account for background gradients and we used isoflurane anesthesia to minimize R2’ contribution [5] to the GRE R2* metric. 2D in-plane Hanning filter was used to increase SNR and reduce Gibbs artifacts. Co-registration of all mice images were done using affine transformation in SPM toolbox and custom code in MATLAB 2021a. Hippocampus and Thalamus Regions of Interest (ROI) were drawn in one scan and registered to all other mice and time-points. For data analysis we used median values of directly measured R2* values in hippocampus and the R2* values divided by median value in thalamus ROI for normalization. Test-retest scans were performed on n=4 Tg4510 and 2 WT about 1h apart. Concordance Correlation Coefficient (CCC) [6] was calculated in MATLAB as a measure of repeatability. n=3 Tg4510 mice were sacrificed at 3 and 6 months of age, brains cleared, stained with NeuN antibody and scanned on a light-sheet microscope to visualize neuronal nuclei and provide an ex vivo measure of neuronal density.Results
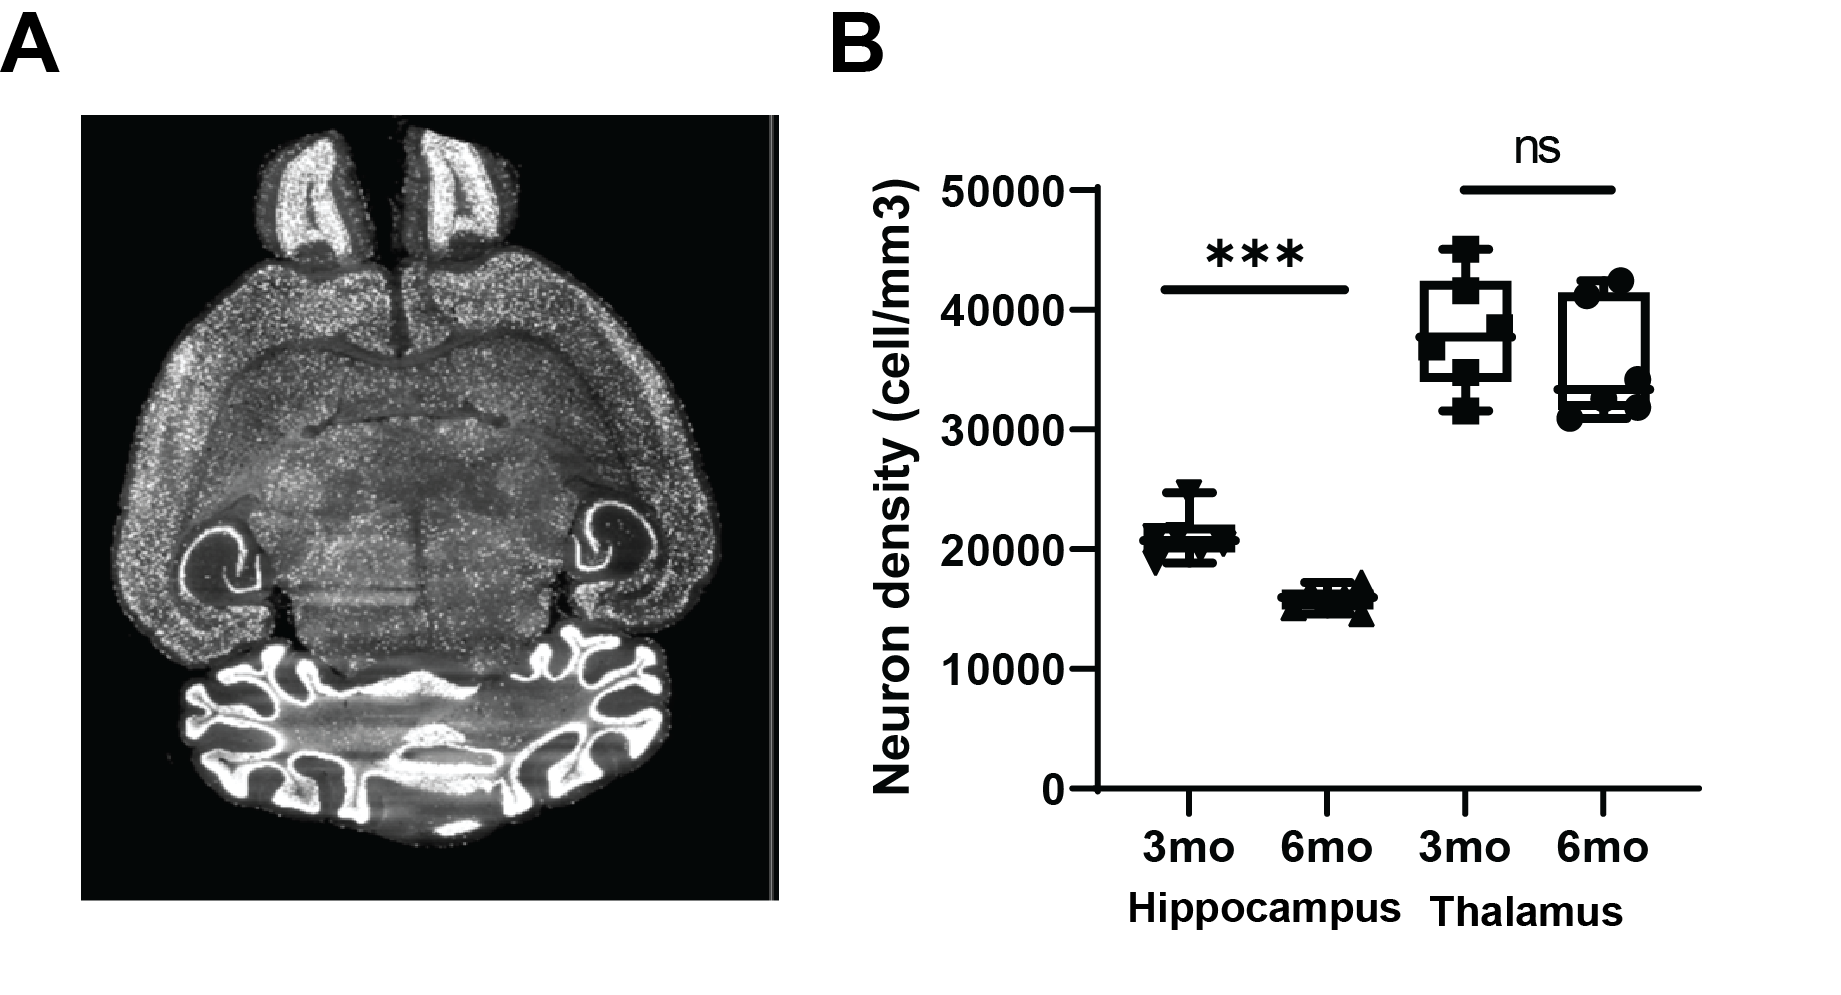
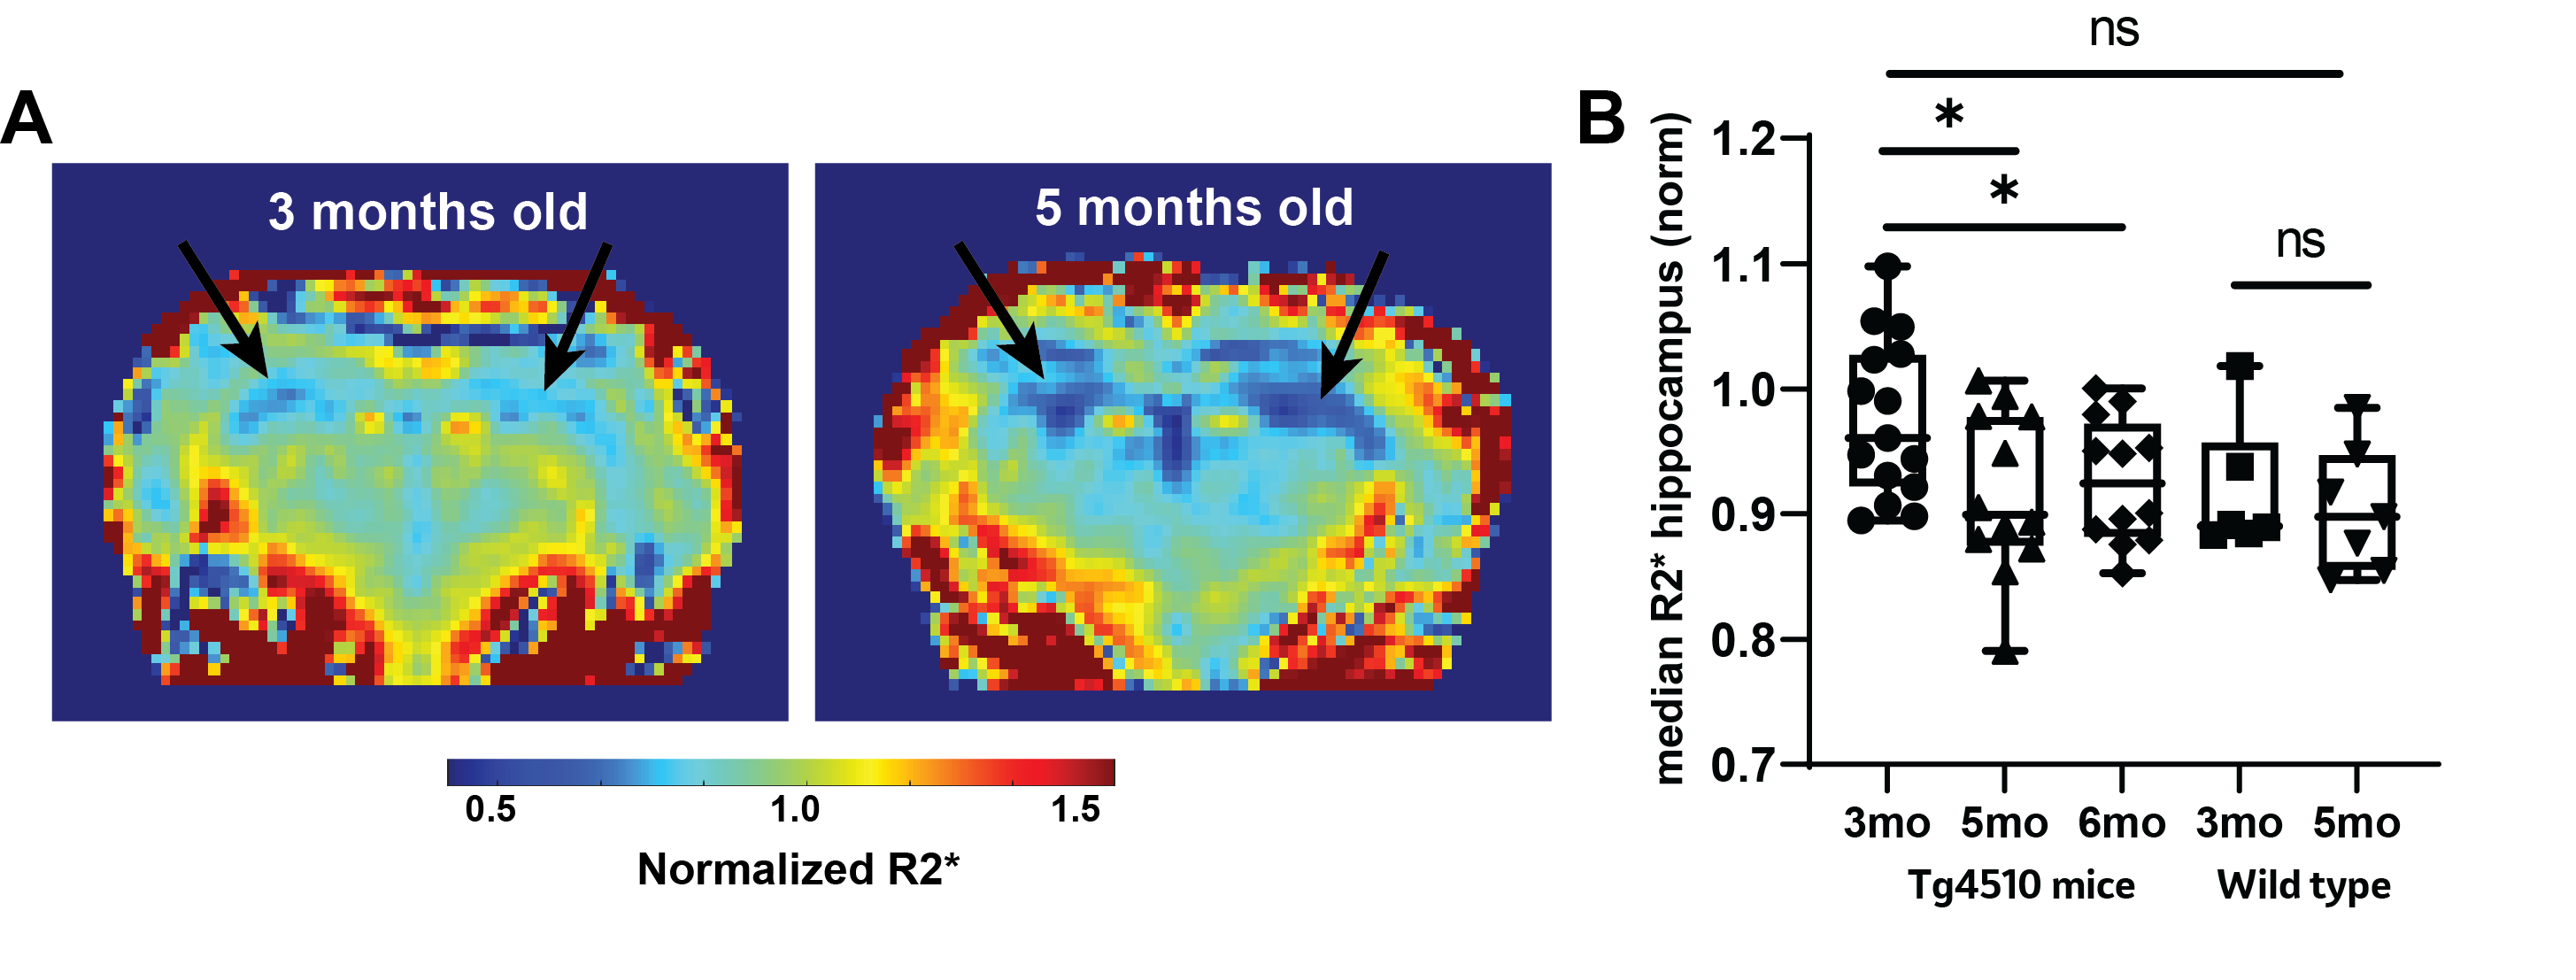
Light-sheet microscopy analysis revealed a significant decrease in NeuN staining between 3mo and 6mo in the hippocampus, indicating a decrease of over 30% in neuronal density (p<0.001, Figure 1). No change was observed in the thalamus (p=0.39). This observation inspired and validated the approach to normalize R2* maps to thalamus values. Test-retest experiment assessed the robustness of different processing approaches (Figure 2). Image filtering in 2D showed improved repeatability in hippocampus quantification for both normalized and non-normalized R2* maps, and normalization performed better than no normalization (CCC=0.50 vs. 0.83 normalized and CCC=-0.12 vs. -0.26 non-normalized 2D vs. no filter). Longitudinal analysis showed significant decrease in R2* in Tg4510 mice, consistent with neurodegeneration (Figure 3). Normalized median R2* (nR2*) in the hippocampus changed from 0.977±0.016 at 3mo to 0.917±0.019 at 5mo (p=0.007) and 0.0929±0.014 at 6mo (p=0.048 vs 3mo). In wild type mice, no significant changes with age are observed: nR2*=0.88±0.04 at 3mo and 0.903±0.019 at 5mo. Changes in brain volume were also observed in the Tg4510 animals with age, with shrinkage of 3.81±1.0% 3 vs. 5mo (p=0.005), and 6.0±0.9% (p<0.001) 3 vs 6mo. No correlation was observed between the nR2* changes and volume changes (r=0.15, p=0.60). Wild type brain showed no significant size change (p=0.14).Discussion
Neurodegeneration is an important hallmark of Alzheimer’s Disease, usually appearing long before volumetric brain changes and clinical symptoms. It’s direct measurement method is urgently needed to provide an early AD biomarker. This is particularly relevant for rodent models, such as the well-established Tg4510 used in this study, where cognitive markers are of limited use, and a longitudinal insight into neuronal loss is desired. In this study a method is proposed for using R2* relaxometry as a direct biomarker of the neuronal loss. Herein, we used histological measurement of neuronal density to confirm the R2* effect and to propose a normalization approach. Test-retest repeatability measurements validate the robustness of final MR imaging approach and quantification method.Conclusions
In this study we show for the first time that qGRE MRI relaxometry approach can be used as a quantitative biomarker that captures the longitudinal progression of pre-atrophic neurodegeneration with age in Tg4510 mice.Acknowledgements
This work was funded by MSD.References
[1] S. Kothapalli et al., "Quantitative Gradient Echo MRI Identifies Dark Matter as a New Imaging Biomarker of Neurodegeneration that Precedes Tisssue Atrophy in Early Alzheimer's Disease," J Alzheimers Dis, vol. 85, pp. 905-924, Dec 9 2021, doi: 10.3233/JAD-210503.
[2] X. Ulrich and D. A. Yablonskiy, "Separation of cellular and BOLD contributions to T2* signal relaxation," Magn Reson Med, vol. 75, no. 2, pp. 606-15, Feb 2016, doi: 10.1002/mrm.25610.
[3] M. Ramsden et al., "Age-dependent neurofibrillary tangle formation, neuron loss, and memory impairment in a mouse model of human tauopathy (P301L)," The Journal of neuroscience : the official journal of the Society for Neuroscience, vol. 25, no. 46, 11/16/2005 2005, doi: 10.1523/JNEUROSCI.3279-05.2005.
[4] D. A. Yablonskiy, A. L. Sukstanskii, J. Luo, and X. Wang, "Voxel spread function method for correction of magnetic field inhomogeneity effects in quantitative gradient-echo-based MRI," Magn Reson Med, vol. 70, no. 5, pp. 1283-92, Nov 2013, doi: 10.1002/mrm.24585.
[5] X. He, M. Zhu, and D. A. Yablonskiy, "Validation of oxygen extraction fraction measurement by qBOLD technique," Magn Reson Med, vol. 60, no. 4, pp. 882-8, Oct 2008, doi: 10.1002/mrm.21719.
[6] L. I. Lin, "A concordance correlation coefficient to evaluate reproducibility," Biometrics, vol. 45, no. 1, 1989
Figures