3514
Processing Pipeline and Analytic Framework for Diffusion and Morphometric Analyses of Alzheimer’s Disease Repository Data1University of Arizona, Tucson, AZ, United States
Synopsis
Keywords: Alzheimer's Disease, Diffusion Tensor Imaging, Repository Data, Cognitive Impairment, Tensor Based Morphometry, Hippocampus
Alzheimer's disease is generally accompanied by brain atrophy, which can be evident on MRI based evaluation at late stages, but there is a need for earlier stage MRI markers that may predict progressive cognitive impairment. Using the NACC Uniform Data Set, a robust pipeline was developed for registering DTI maps to a Human Connectome Project template space and an analysis framework for ROI based, voxel-wise, and morphometric analysis was applied. Prominent results include increased trace in the hippocampus and an increase in ventricle volume in the group with severe cognitive impairment.Introduction
Alzheimer’s disease (AD) is generally accompanied by brain atrophy, which can be evident on MRI based evaluation at late stages of the disease, but there is a need for earlier stage MRI markers that may predict later atrophy and progressive cognitive impairment. An association between increased apparent diffusion coefficient (ADC) and mild cognitive impairment associated with AD has been reported1,2, and already a remarkable number of patient brain MRI and Diffusion Tensor Image (DTI) scans are available to the research community via national repositories (e.g., ADNI and NACC). If robust and reliable data processing pipelines and analytic frameworks can be built to quantitatively test hypotheses about the presence and time course of imaging changes during AD pathologic progression, it will lead to the development of earlier and more sensitive imaging markers. In this project, we have optimized DTI-based registration of repository scans to the Human Connectome Project (HCP) template and developed DTI-based tensor-based morphometry (D-TBM) analysis and voxel-wise DTI metric analysis for use with these large data sets. We applied this pipeline to a retrospective analysis utilizing the National Alzheimer’s Coordinating Center (NACC) Uniform Data Set with the primary goal of enabling high quality assessment of large repository data sets that will lead to the improvement of MRI markers for AD pathology.Methods
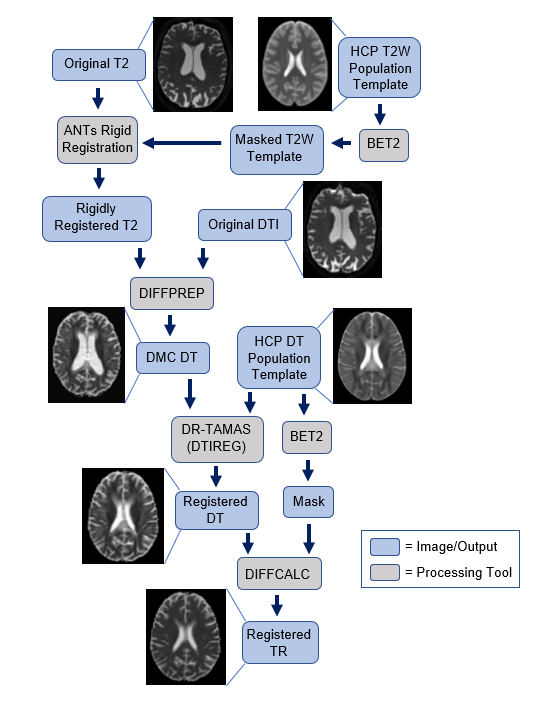
From an initial 7,276 distinct subjects with MRI data acquired from the NACC repository data set3, 1,005 subjects were selected based on the presence of a DTI, T2-weighted MRI, and global Clinical Dementia Rating Scale (CDR). A single site (6499) of 464 subjects was selected for this project based on consistent image formatting and quality. From the full range of CDR = 0, 0.5, 1, 2, and 3, two extreme value groups, CDR = 0 (no dementia, n = 37) and 3 (severe cognitive impairment, n = 277), were selected for initial analysis to develop a robust pipeline for processing, registration, and analysis. An overview of the full processing pipeline is shown in Figure 1. Briefly, the T2-weighted image was rigidly registered to the HCP 1065 DTI template4 for each subject using Advanced Normalization Tools (ANTs)5,6 and used as the structural target for DTI. The DTI data was processed through a TORTOISE pipeline to correct motion and EPI7,8, with BET2 applied for brain extraction and mask creation9. Rigid registration relocated the center of the brains for all subjects to approximately the same location as the HCP template; however, to improve region of interest (ROI) based and voxel-wise analysis, a second registration was performed using DRTAMAS (Diffeomorphic Registration for Tensor Accurate Alignment of Anatomical Structures)10. This tensor-based registration provided remarkable alignment of internal anatomical features between scans enabling template-based ROI and voxel-wise comparisons. Warped diffusion tensor maps in the template space were used to calculate trace (TR) maps for each individual and the deformation fields of the full registration from native to template space for each individual was used to calculate TBM maps for the log of the determinant of the Jacobian (LogJ), which reports local volume change. These TR and LogJ maps were then analyzed by ROI and voxel-wise approaches. First, a hippocampal ROI was applied to compute the average TR and LogJ values within the hippocampi. Next, tools from FSL Maths11-13 and ANTs ImageMath5,6 were applied to compute Cohen’s D effect size maps for TR. Finally, a voxel-wise t-test was run via FSL Randomize14 to compare average TR values between CDR = 0 and 3.Results
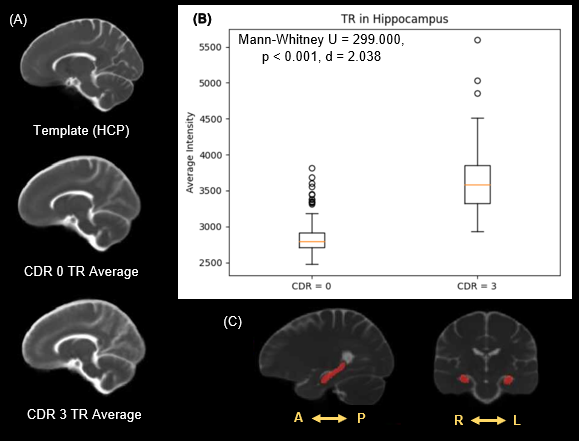
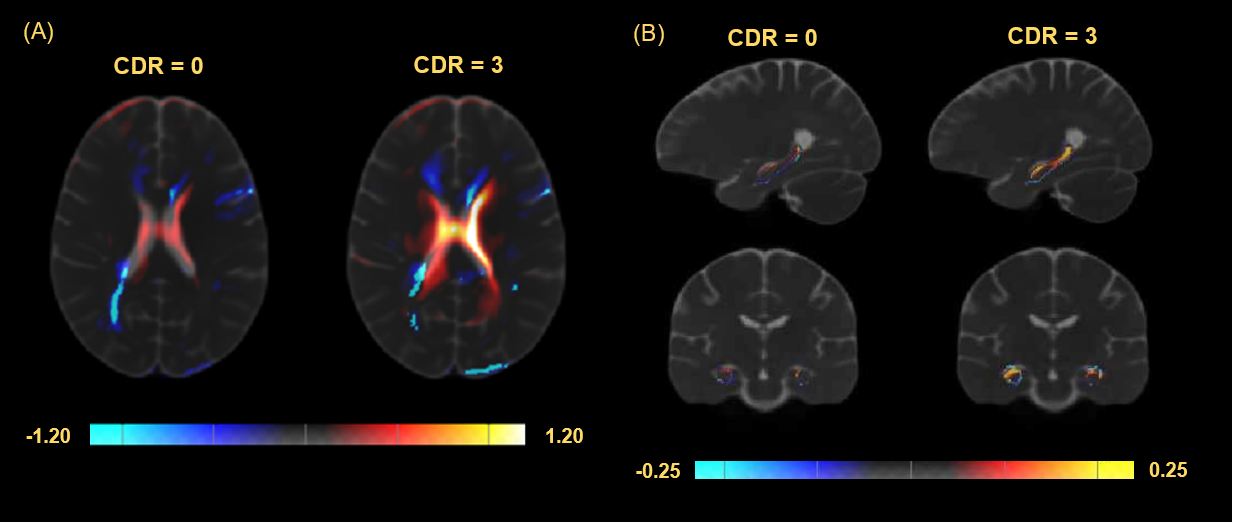
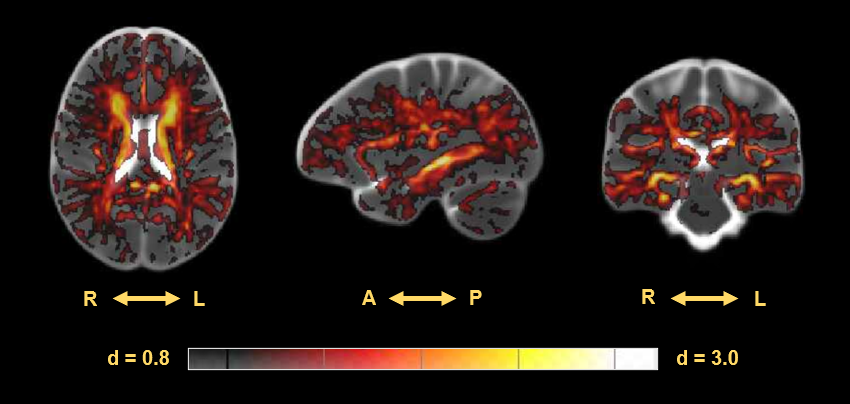
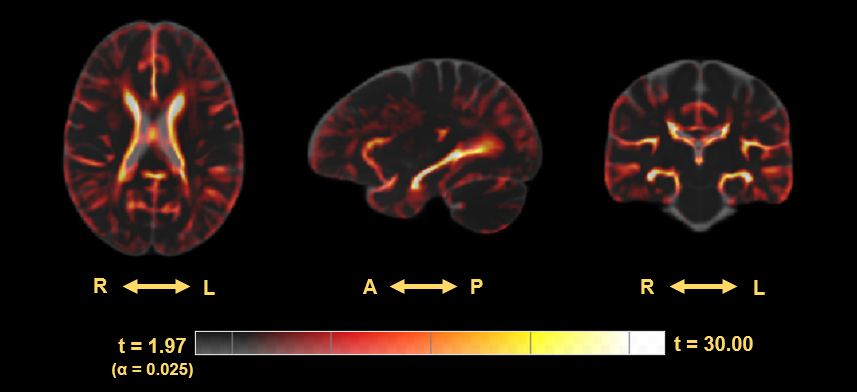
ROI based analysis within the hippocampus indicates a significant difference in distribution of the average intensities within this region between CDR of 0 and 3 in TR (Mann–Whitney U = 299, p < 0.001), and a large Cohen’s D effect size (d = 2.038) (Figure 2). Morphometric analysis indicates a significant increase in volume surrounding the ventricles in subjects with a CDR = 3 compared to a CDR = 0. However, the ventricles dominate the results leading to analysis within the hippocampi alone which display regions of both increased and decreased volume in the CDR = 3 group prompting further analysis (Figure 3). The Cohen’s D effect size map indicates a large effect size (d > 0.8) across a moderate portion of the brain including regions surrounding the ventricles and hippocampus (Figure 4). Similarly, the t-test (CDR 3 > 0) with α = 0.025 follow a comparable pattern highlighting regions along the ventricles and hippocampus (Figure 5).Discussion
A processing pipeline and analytic framework were developed for the correction, registration, and voxel-wise analysis of large repository DTI data sets from patients with AD. As expected, we demonstrated a large effect size for increased diffusivity, and enlargement of the ventricles. The use of tensor-based registration to a separate, high-resolution template enabled alignment of local anatomic regions even in a severely atrophied data set.Conclusion
With a robust pipeline developed for processing DTI data from the NACC Uniform Data Set, this process can not only be applied to the remaining groups CDR of 0.5, 1, and 2 from the current site, but extended to other sites within this NACC data set and potentially to other repositories.Acknowledgements
This work was generously supported by the Arizona Alzheimer's Consortium and based upon High Performance Computing (HPC) resources supported by the University of Arizona TRIF, UITS, and Research, Innovation, and Impact (RII) and maintained by the UArizona Research Technologies department. All data obtained from the NACC database is funded by NIA/NIH Grant U24 AG072122. Finally, a special thanks to all the MBSIL members for their support.References
1. Bergamino, M., Burke, A., Baxter, L. C., Caselli, R. J., Sabbagh, M. N., Talboom, J. S., Huentelman, M. J., & Stokes, A. M. (2022). Longitudinal assessment of Intravoxel incoherent motion diffusion‐weighted mri metrics in cognitive decline. Journal of Magnetic Resonance Imaging. https://doi.org/10.1002/jmri.28172
2. Hanyu, H., Sakurai, H., Iwamoto, T., Takasaki, M., Shindo, H., & Abe, K. (1998). Diffusion-weighted MR imaging of the hippocampus and temporal white matter in alzheimer's disease. Journal of the Neurological Sciences, 156(2), 195–200. https://doi.org/10.1016/s0022-510x(98)00043-4
3. Besser, L., Kukull, W., Knopman, D. S., Chui, H., Galasko, D., Weintraub, S., Jicha, G., Carlsson, C., Burns, J., Quinn, J., Sweet, R. A., Rascovsky, K., Teylan, M., Beekly, D., Thomas, G., Bollenbeck, M., Monsell, S., Mock, C., Zhou, X. H., Thomas, N., … Neuropsychology Work Group, Directors, and Clinical Core leaders of the National Institute on Aging-funded US Alzheimer’s Disease Centers (2018). Version 3 of the National Alzheimer's Coordinating Center's Uniform Data Set. Alzheimer disease and associated disorders, 32(4), 351–358. https://doi.org/10.1097/WAD.0000000000000279
4. Yeh, F. C., Panesar, S., Fernandes, D., Meola, A., Yoshino, M., Fernandez-Miranda, J. C., ... & Verstynen, T. (2018). Population-averaged atlas of the macroscale human structural connectome and its network topology. NeuroImage, 178, 57-68. PubMed: https://www.ncbi.nlm.nih.gov/pubmed/29758339
5. Avants, B. B., Tustison, N. J., Song, G., Cook, P. A., Klein, A., & Gee, J. C. (2011). A reproducible evaluation of ANTs similarity metric performance in brain image registration. NeuroImage, 54(3), 2033–2044. https://doi.org/10.1016/j.neuroimage.2010.09.025
6. Avants, B. B., Epstein, C. L., Grossman, M., & Gee, J. C. (2008). Symmetric diffeomorphic image registration with cross-correlation: evaluating automated labeling of elderly and neurodegenerative brain. Medical image analysis, 12(1), 26–41. https://doi.org/10.1016/j.media.2007.06.004
7. C. Pierpaoli, L. Walker, M. O. Irfanoglu, A. Barnett, P. Basser, L-C. Chang, C. Koay, S. Pajevic, G. Rohde, J. Sarlls, and M. Wu, 2010, TORTOISE: an integrated software package for processing of diffusion MRI data, ISMRM 18th annual meeting, Stockholm, Sweden, abstract #1597
8. Mustafa Okan Irfanoglu, Amritha Nayak, Jeffrey Jenkins, and Carlo Pierpaoli, TORTOISEv3: Improvements and New Features of the NIH Diffusion MRI Processing Pipeline, ISMRM 25th annual meeting, Honolulu, HI, abstract #3540
9. S.M. Smith. Fast robust automated brain extraction. Human Brain Mapping, 17(3):143-155, November 2002.
10. Irfanoglu, M. O., Nayak, A., Jenkins, J., Hutchinson, E. B., Sadeghi, N., Thomas, C. P., & Pierpaoli, C. (2016). DR-TAMAS: Diffeomorphic Registration for Tensor Accurate Alignment of Anatomical Structures. NeuroImage, 132, 439–454. https://doi.org/10.1016/j.neuroimage.2016.02.066
11. M.W. Woolrich, S. Jbabdi, B. Patenaude, M. Chappell, S. Makni, T. Behrens, C. Beckmann, M. Jenkinson, S.M. Smith. Bayesian analysis of neuroimaging data in FSL. NeuroImage, 45:S173-86, 2009
12. S.M. Smith, M. Jenkinson, M.W. Woolrich, C.F. Beckmann, T.E.J. Behrens, H. Johansen-Berg, P.R. Bannister, M. De Luca, I. Drobnjak, D.E. Flitney, R. Niazy, J. Saunders, J. Vickers, Y. Zhang, N. De Stefano, J.M. Brady, and P.M. Matthews. Advances in functional and structural MR image analysis and implementation as FSL. NeuroImage, 23(S1):208-19, 2004
13. M. Jenkinson, C.F. Beckmann, T.E. Behrens, M.W. Woolrich, S.M. Smith. FSL. NeuroImage, 62:782-90, 2012
14. Winkler AM, Ridgway GR, Webster MA, Smith SM, Nichols TE. Permutation inference for the general linear model. NeuroImage, 2014;92:381-397.
Figures