3509
Development of an FOD template of the older adult brain for the MIITRA atlas1Biomedical Engineering, Illinois Institute of Technology, Chicago, IL, United States, 2Rush Alzheimer’s Disease Center, Rush University Medical Center, Chicago, IL, United States
Synopsis
Keywords: Alzheimer's Disease, Aging, Atlas
A high quality FOD template of the older adult brain can enhance the sensitivity and accuracy of white matter investigations in older adults. The present work compared several FOD template construction methods for the purpose of developing a high-resolution FOD template of the older adult brain in the space of the MIITRA atlas. The preferred method employed multichannel registration based on T1w, FA and FOD information, followed by additional FOD single modality registration. The resulting FOD template exhibited high image quality, was constructed based on precisely matched FOD data, and exhibited high spatial matching to other existing MIITRA templates.Introduction
The fiber orientation distribution (FOD) provides accurate characterization of white matter in regions with crossing fibers as it resolves multiple fiber orientations within a voxel[1,2]. A high quality FOD template of the older adult brain has the potential to enhance the sensitivity and accuracy of white matter investigations in older adults[3]. The present work compared several FOD template construction methods for the purpose of developing a high-resolution FOD template of the older adult brain in the space of the MIITRA atlas[4]. The FOD templates generated with the different methods were compared in terms of image quality, precision in spatial normalization of older adult data, and spatial matching with other existing MIITRA templates.Methods
DataT1w (1mm isotropic) and DWI (2mm isotropic) data collected on 400 non-demented older adults (50% male; 64.9-98.9 years of age; 54% white, 43% black) participating in the construction of the MIITRA atlas were used in this work [5,6]. FODs were estimated with the “dhollander” and SS3T-CSD algorithms using MRtrix3Tissue(https://3Tissue.github.io), a fork of MRtrix3[7].
Template construction
To construct an FOD template that is in the space of the existing MIITRA T1w and DTI templates, the linear transformations generated from T1w and DTI template construction [8] were first applied to the FOD data. The linearly aligned FOD data were then groupwise normalized using different methods:
Method 1 (FOD registration): FOD-based single modality registration with mean squared difference as the cost function.
Method 2 (T1 & DTI transformations): The nonlinear transformations generated from MIITRA T1w and DTI template construction [8] were applied to the FODs.
Method 3 (T1+FOD): Multichannel registration based on T1w and FOD information with equal weights, using cross-correlation as the cost function.
Method 4 (T1+FA+FOD): Multichannel registration based on T1w, FA and FOD information with weights of 4,3,3 respectively, using cross-correlation as the cost function.
Method 5 (T1+FA+FOD & FOD): Same as Method 4 followed by FOD single modality registration performed on the FOD data that were already transformed by Method 4, with cross-correlation as the cost function.
All registrations were conducted in the 0.5mm isotropic resolution space of the MIITRA atlas. In all methods, the resulting transformations were combined with previous linear transformations to minimize interpolations. All methods included FOD reorientation. Registrations in Methods 1,3,4,5 were conducted using MRtrix3 software [3,7]. The final FOD templates were generated from the spatially normalized FOD data using simple averaging.
Evaluation
The FOD templates generated with different methods were compared by a) visual inspection, and in terms of b) image sharpness of the total apparent fiber density (AFD) map[9], c) precision of spatial normalization of FOD data used in template construction, and d) spatial matching with the existing MIITRA T1w and DTI templates. The image sharpness of AFD maps was assessed by means of the normalized power spectra[10]. Normalization precision was evaluated using the mean squared difference (MSD) of spherical harmonics[3] and angular correlation coefficient (ACC)[11] between the template and the normalized FODs in white matter. The spatial matching between FOD and MIITRA T1w templates was assessed by the Jaccard index of white matter masks corresponding to the FOD and T1w templates. The spatial matching between FOD and MIITRA DTI templates was calculated by the cross-correlation of FA maps corresponding to the FOD and DTI templates.
Results
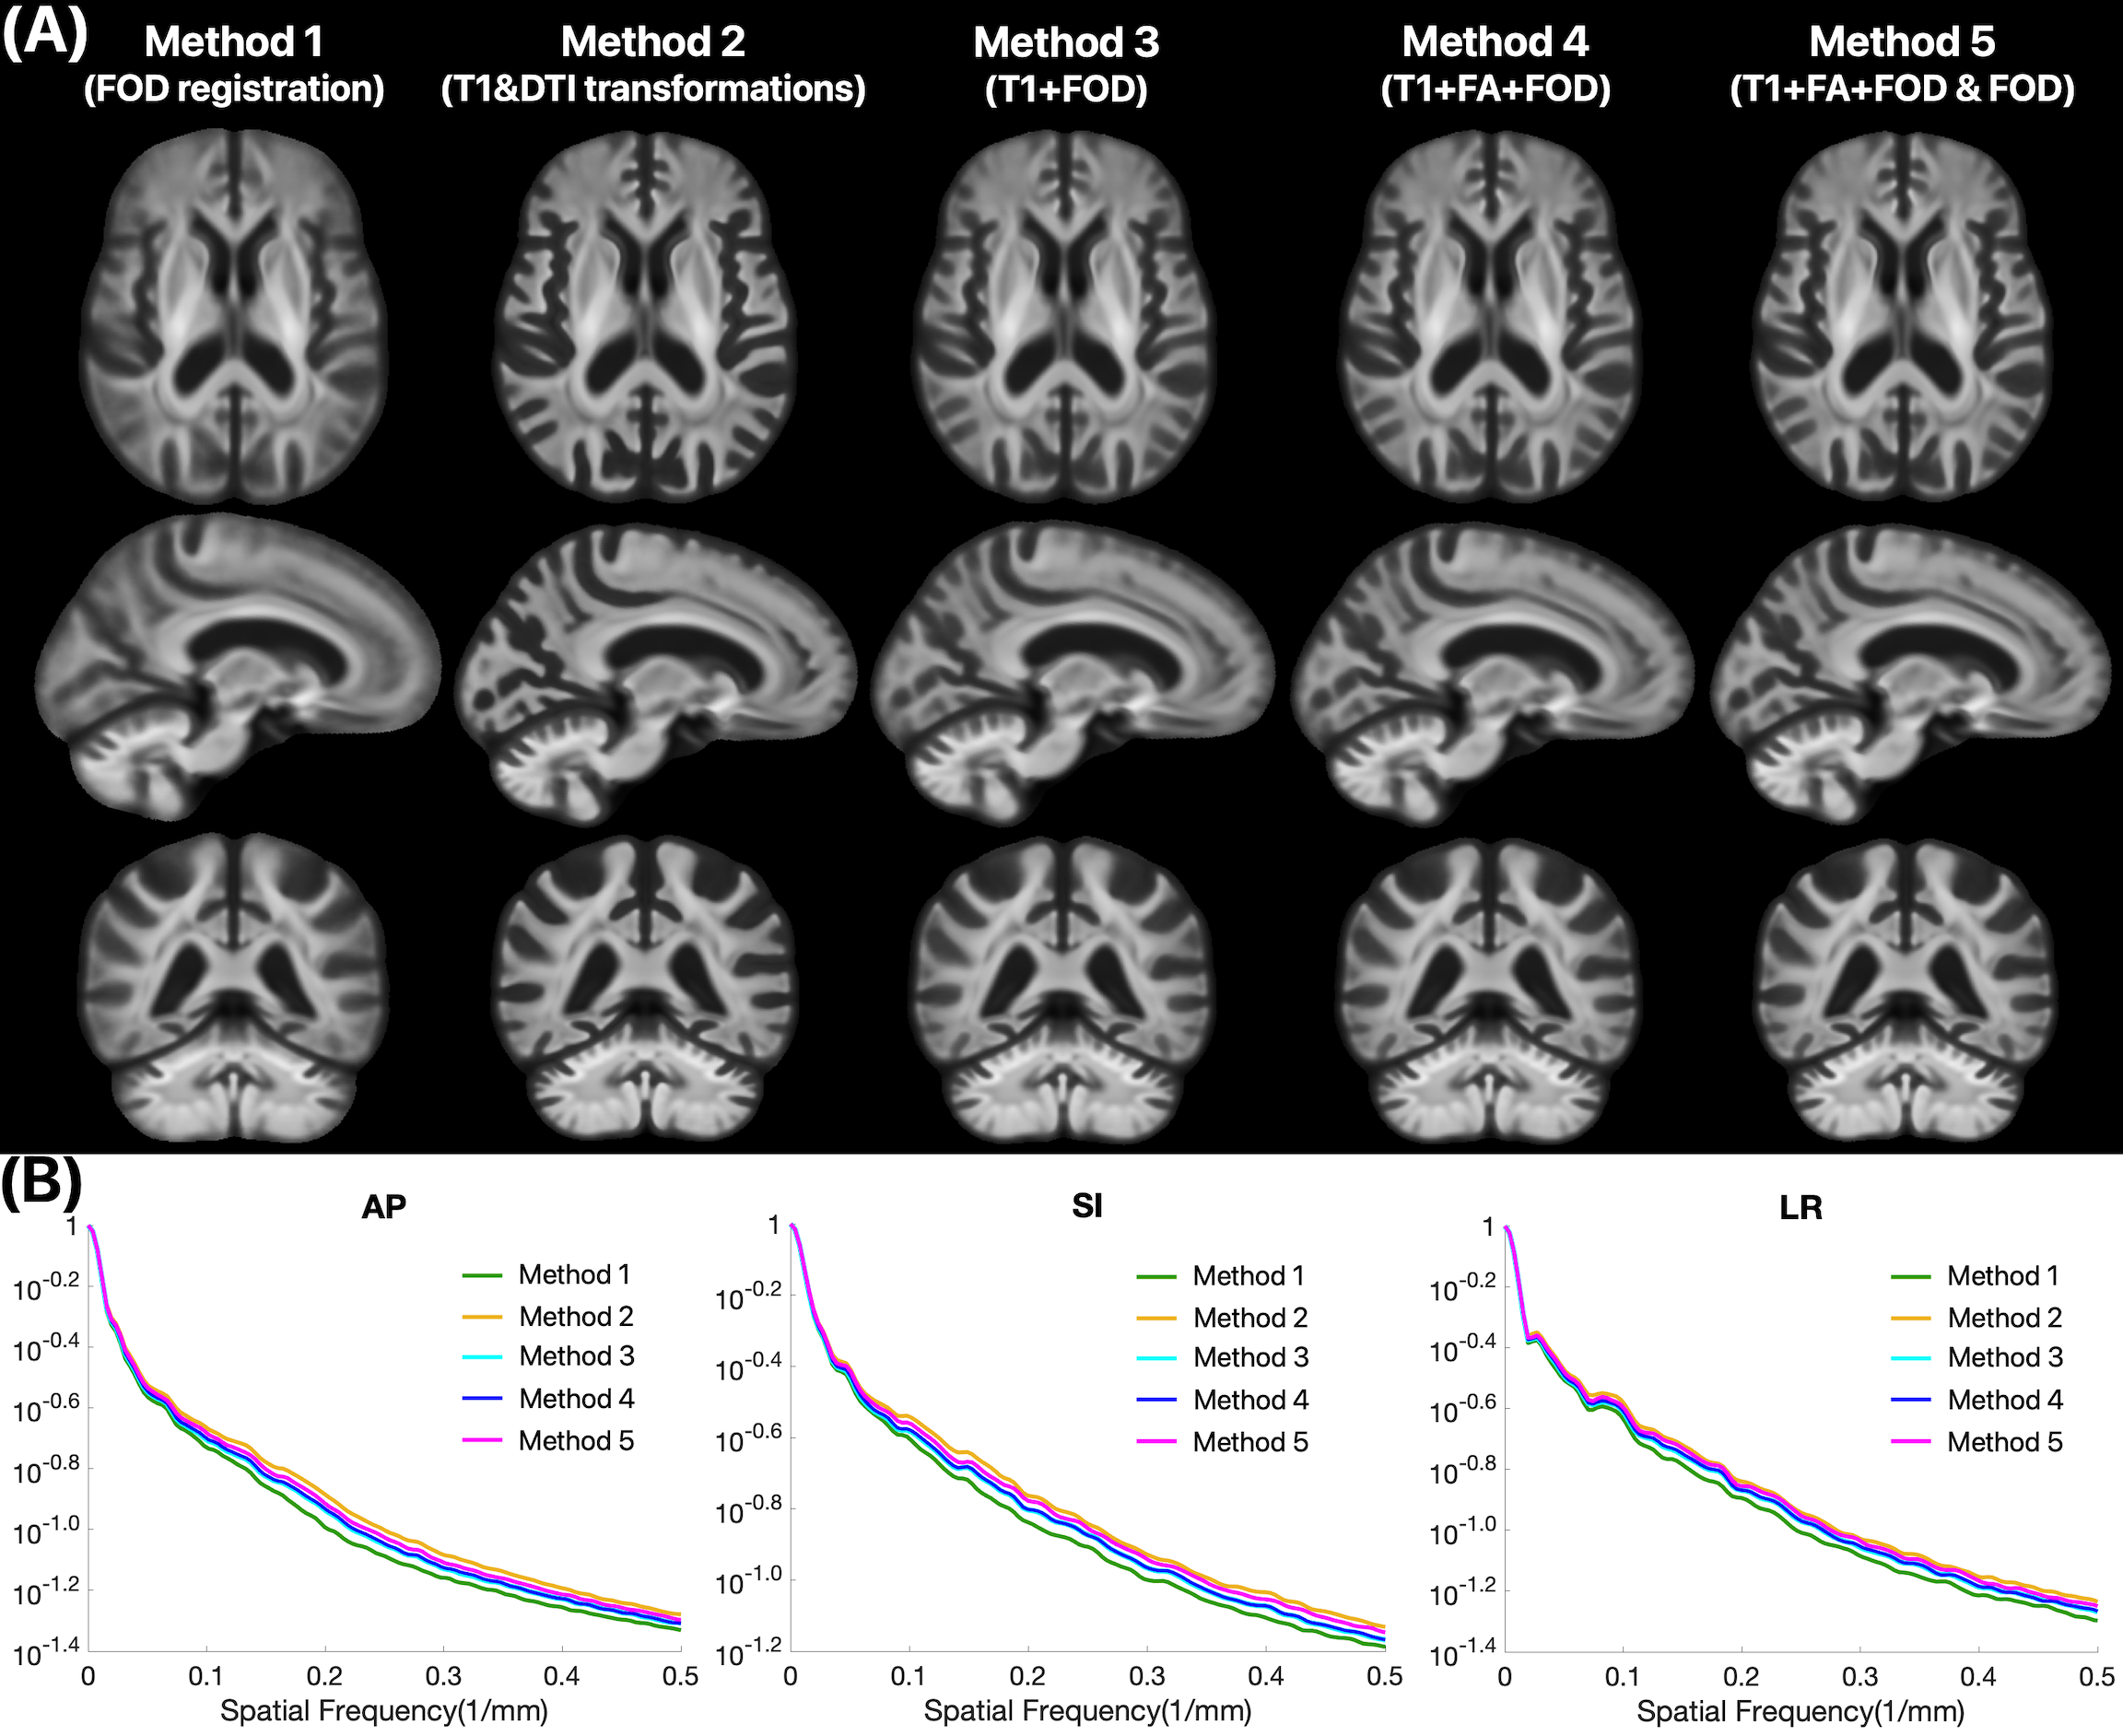
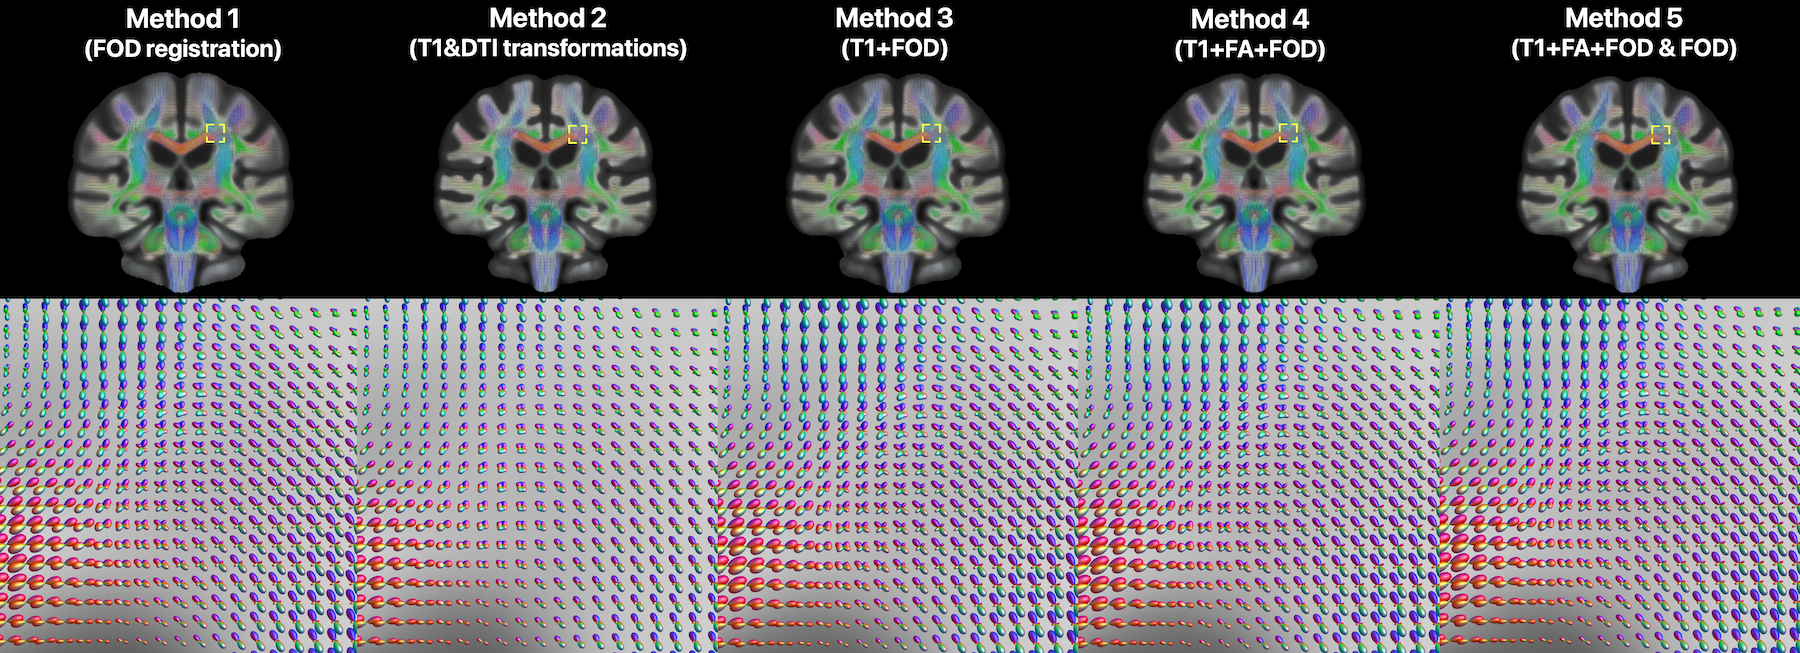
The FOD templates generated with Methods 2 and 5 exhibited higher image sharpness compared to other methods as demonstrated by visual inspection and by the greater high spatial frequency content in the normalized power spectra (Fig.1). Visual inspection showed that fiber crossings were more clearly defined in the FOD templates generated with Methods 1,3,4,5 compared to Method 2 (Fig.2). Method 5 allowed lower MSD and higher ACC of spatially normalized FOD data compared to other methods, indicating higher precision in spatial normalization of FOD data used in template construction (Fig.3). Method 2 provided the highest spatial matching between the FOD template and the existing MIITRA T1w and DTI templates, followed closely by Methods 3,4,5 which resulted in similar matching, as demonstrated by means of the Jaccard index of white matter masks and the cross-correlation of FA maps (Fig.4). Method 1 resulted in the lowest spatial matching between the FOD template and the existing MIITRA templates (Fig.4). Overall, the FOD template generated with Method 5 achieved high image quality, was constructed based on precisely matched FOD data, and exhibited high spatial matching to the existing MIITRA templates (Fig.5).Discussion
The present work compared several methods for construction of an FOD template of the older adult brain in the space of the MIITRA atlas. The preferred method employed multichannel registration based on T1w, FA and FOD information, followed by additional FOD single modality registration. The resulting FOD template exhibited high image quality, was constructed based on precisely matched FOD data, and exhibited high spatial matching to the existing MIITRA T1w and DTI templates.Conclusion
An FOD template of the older adult brain was constructed for the MIITRA atlas using multichannel registration based on T1w, FA and FOD information, followed by additional FOD single modality registration. The new template exhibits high image quality, is constructed based on precisely matched FOD data, and exhibits high spatial matching to other existing MIITRA templates.Acknowledgements
This study was supported by:
National Institute on Aging (NIA) R01AG052200
National Institute on Aging (NIA) P30AG010161
National Institute on Aging (NIA) P30AG072975
National Institute on Aging (NIA) R01AG017917
National Institute on Aging (NIA) RF1AG022018
National Institute on Aging (NIA) R01AG056405
National Institute on Aging (NIA) R01AG015819
National Institute on Aging (NIA) R01AG064233
National Institute of Neurological Disorders and Stroke (NINDS), UF1NS100599
References
1. Tournier, J. D., Calamante, F., Gadian, D. G., & Connelly, A. (2004). Direct estimation of the fiber orientation density function from diffusion-weighted MRI data using spherical deconvolution. NeuroImage, 23(3), 1176–1185.
2. Tournier, J.-D., Calamante, F., & Connelly, A. (2007). Robust determination of the fibre orientation distribution in diffusion MRI: Non-negativity constrained super-resolved spherical deconvolution. NeuroImage, 35(4), 1459–1472.
3. Raffelt D, Tournier JD, Fripp J, Crozier S, Connelly A, Salvado O. Symmetric diffeomorphic registration of fibre orientation distributions. Neuroimage. 2011 Jun 1;56(3):1171-80.
4. Wu, Y., Ridwan, A. R., Niaz, M. R., Qi, X., Zhang, S., Alzheimer's Disease Neuroimaging Initiative, Bennett, D. A., & Arfanakis, K. (2022). Development of high quality T1-weighted and diffusion tensor templates of the older adult brain in a common space. NeuroImage, 260, 119417.
5. Bennett DA, Buchman AS, Boyle PA, et al. Religious Orders Study and Rush Memory and Aging Project. J Alzheimers Dis. 2018;64(s1):S161-S189.
6. Barnes LL, Shah RC, Aggarwal NT, et al. The Minority Aging Research Study: Ongoing Efforts to Obtain Brain Donation in African Americans without Dementia. Curr Alzheimer Res. 2012;9(6):734-745.
7. Tournier JD, Smith R, Raffelt D, et al. MRtrix3: A fast, flexible and open software framework for medical image processing and visualisation. Neuroimage. 2019 Nov;202:116137.
8. Wu Y., Niaz M.R., Ridwan A.R., Qi X., Bennett D.A., Arfanakis K. MIITRA atlas: Construction of high resolution T1w and DTI brain templates in a common space, based on 400 older adults. Proc. Int. Soc. for Magn. Reson. in Med. (ISMRM) 2021.
9. Raffelt, D., Tournier, J. D., Rose, S., Ridgway, G. R., Henderson, R., Crozier, S., Salvado, O., & Connelly, A. (2012). Apparent Fibre Density: a novel measure for the analysis of diffusion-weighted magnetic resonance images. NeuroImage, 59(4), 3976–3994.
10. Zhang, S., & Arfanakis, K. (2018). Evaluation of standardized and study-specific diffusion tensor imaging templates of the adult human brain: Template characteristics, spatial normalization accuracy, and detection of small inter-group FA differences. Neuroimage, 172, 40–50.
11. Anderson, A.W., 2005. Measurement of fiber orientation distributions using high angular resolution diffusion imaging. Magnetic Resonance in Medicine 54, 1194–1206.
Figures