3508
Differential Radiologic-Pathologic Correspondence of Diffusivity, Restriction and Anisotropy with Plaque and Tangle Cores
Courtney J Comrie1, Laurel A Dieckhaus1, Tom G Beach2, Geidy E Serrano2, and Elizabeth B Hutchinson1
1Biomedical Engineering, University of Arizona, Tucson, AZ, United States, 2Brain and Body Donation Program, Banner Sun Health Research Institute, Sun City, AZ, United States
1Biomedical Engineering, University of Arizona, Tucson, AZ, United States, 2Brain and Body Donation Program, Banner Sun Health Research Institute, Sun City, AZ, United States
Synopsis
Keywords: Alzheimer's Disease, Alzheimer's Disease
Alzheimer’s is an irreversible degenerative brain disease. Clinical MRI may visualize severe brain atrophy but fails to recognize earlier biomarkers associated with subtle microstructural changes. Microstructural MRI techniques such as DTI, MAP-MRI, and MSDKI may sensitively detect and distinguish tissue degeneration, tauopathies, and beta amyloid plaques in the hippocampus and entorhinal cortex. The capability of these techniques was investigated in post-mortem human temporal lobe specimens at high resolution and high image quality. Prominent findings seen were differences between DTI and MAP-MRI anisotropy metrics, and striking differences between the hippocampus and entorhinal cortex for restriction due to plaques.Introduction
Alzheimer’s Disease (AD) diagnosis is made based on the presence of hallmark neuropathologies at autopsy 1 and although there has been great progress in development of highly specific positron emission tomography (PET) markers for amyloid-beta plaques and neurofibrillary tangles 2, PET is not sensitive to comorbidities 2, and a need remains for improved non-invasive early diagnosis markers. Current clinical MRI is capable of reporting severe brain atrophy but fails to recognize earlier biomarkers associated with subtle cellular and molecular changes that occur within the hippocampus (HC) and entorhinal cortex (EC). Diffusion magnetic resonance imaging (dMRI) techniques are promising to address this challenge and may detect and distinguish tissue degeneration, tauopathies, and plaques for improved diagnosis accuracy. The study objective was to distinguish among the most promising dMRI techniques, conventional and advanced, for the detection of AD pathology in EC and HC exhibiting pathologic changes sequentially in AD. To accomplish this, we performed dMRI microscopy using diffusion tensor imaging (DTI), mean apparent propagator (MAP-MRI), and mean signal diffusion kurtosis imaging (MSDKI) in a set of fourteen post-mortem temporal lobe specimens and directly analyzed the correlation of quantitative metrics in the EC and HC with Braak stage, HC/EC plaque score, and HC/EC tangle score. This quantitative radiologic-pathologic approach was selected to distinguish among potential markers and to identify trends across the different techniques for AD influence on water restriction, diffusion, and micro/macroscale anisotropy.Methods
Fourteen post-mortem human temporal lobe specimens varying in Braak Stages 3 were received from the Banner Sun Health Brain and Body Donation Program 4. Two temporal lobe samples of known pathologies, Braak stage IV AD 4 and healthy, were utilized in the methods development. Eleven samples were imaged and analyzed for comparative analysis of metrics across specimens. All samples were prepared according to 4 with short post-mortem interval, block fixation by paraformaldehyde and rehydration by storage in saline. Samples were prepared in 50 ml falcon tube and Fluorinert for scanning. Images were acquired at 250 micron isotropic resolution using a 7T Bruker Biospec MRI scanner, including multi-shell diffusion weighted imaging (DWI) 201 DWI volumes over b=0-6,000 s/mm2. Diffusion pre-processing and DTI and MAP-MRI calculations were performed using TORTOISE 3.2.0 5-7 to generate fractional anisotropy (FA), trace (TR), propagator anisotropy maps (PA), return-to-origin probability (RTOP) among others. Region of interest (ROI) manual segmentations were created for eleven HC samples and ten EC samples. Spearman’s correlation plots (Python) were generated for both EC and HC to identify relationships between the microstructural metrics and pathological scores. Normalized-averaged histograms were made after the correlation analysis for a visualization of the MR metrics behavior for the increasing pathological scorings. HC histograms were grouped by Braak Scores, while the EC was grouped by plaque count.Results
High-resolution dMRI metric maps were achieved allowing for detailed visualization of anatomical structures and a clear demonstration that dMRI can identify regions of pathologic tissue alterations that are absent from anatomical images (figure 1). Spearman’s correlation in the HC ROIs (figure 2) revealed strong negative correlation between PA and Braak score (R=-0.68) but not FA (R=-0.24). However, FA appeared to have a stronger correlation with Plaques of (R=-0.48). Braak Score correlation differences between FA and PA were analyzed with averaged histograms (figure 3) where PA had a bimodal distribution with strong shifts between Braak score groups and FA did not. EC correlations between plaque count and restrictive metrics (figure 4) RTOP and MSK had values of 0.57 and 0.3 respectively, decreasing in positive correlations for TR and MSD in the EC. The restrictive and diffusivity relationships are consistent in the averaged histogram that was observed in the correlation analysis (figure 5).Discussion
Earlier work identified several potential diffusion metrics associated with AD pathology and we have extended this work to investigate the correspondence of diffusivity, restriction, and anisotropy with plaque and tangle scores. Averaged histograms of FA show a distinct shift towards lower values at higher BRAAK scores, but little difference is observed between middle and low scores. However, in PA there a striking shift towards lower values for both middle and high scores compared to the low. PA also exhibits a bimodal distribution expanding on the microstructural environment while FA does not. Suggesting PA as more sensitive than FA to subtle microstructural changes in the HC. Restrictive metrics, MSK and RTOP, displayed strong negative correlations in the HC paired with strong positive correlations for diffusivity, however, this relationship is reversed in the EC. Restriction from plaque count in the EC may be detectable due advanced neurodegeneration occurring in the earliest stages and late stages of AD 8, while HC neurodegeneration is less severe early in AD, allowing degeneration to dominate any restrictive patterns present from plaques.Conclusion
High quality and resolution data was collected in advanced diffusion metrics to identify potential early markers of AD. Correlation analysis suggests that PA can detect plaques and tangles in the hippocampus that are not detectable by FA. Also, we are sensitive to restriction from plaques in the EC but not the HC from AD’s degenerative progression. These markers provide promising new methods towards a reliable and early diagnosis of Alzheimer’s within the medical field.Acknowledgements
This research was supported by the NIA/NIH grant R03 780250. All imaging was performed in the UA translational bioimaging resource (TBIR) and made possible by the NIH small instrumentation grant: S10 OD025016. The authors would like to thank High Performance Computing (HPC) for providing the resources needed. Thank you to all the MBSIL members for their support.References
- Beach TG, Monsell SE, Phillips LE, Kukull W. Accuracy of the clinical diagnosis of Alzheimer disease at National Institute on Aging Alzheimer Disease Centers, 2005-2010. J Neuropathol Exp Neurol. 2012 Apr;71(4):266-73.
- Shin J, Lee SY, Kim SH, Kim YB, Cho SJ. Multitracer PET imaging of amyloid plaques and neurofibrillary tangles in Alzheimer's disease. Neuroimage. 2008 Nov 1;43(2):236-44. doi: 10.1016/j.neuroimage.2008.07.022. Epub 2008 Jul 23. PMID: 18694837.
- Braak H, Thal DR, Ghebremedhin E, Del Tredici K. Stages of the pathologic process in alzheimer disease: Age categories from 1 to 100 years. J Neuropathol Exp Neurol. 2011 Nov;70(11):960–9.
- Beach TG, Adler CH, Sue LI, Serrano G, Shill HA, Walker DG, et al. Arizona Study of Aging and Neurodegenerative Disorders and Brain and Body Donation Program. Neuropathology. 2015 Aug 1;35(4):354–89.
- Basser PJ, Mattiello J, LeBihan D. MR diffusion tensor spectroscopy and imaging. Biophys J. 1994 Jan;66(1):259-67. doi: 10.1016/S0006-3495(94)80775-1. PMID: 8130344; PMCID: PMC1275686.
- Irfanoglu MO, Nayak A, Jenkins J, Pierpaoli C. TORTOISE v3: Improvements and New Features of the NIH Di. In: 25th Annual Meeting of the International Society fro Magnetic Resonance in Medicine. Honolulu, HI; 2017.
- Özarslan E, Guan Koay C, Shepherd TM, et al. Mean apparent propagator (MAP) MRI: A novel diffusion imaging method for mapping tissue microstructure. Neuroimage. 2013;78:16-32. doi:10.1016/j.neuroimage.2013.04.016.
- Braak H, Tredici KD, The preclinical phase of the pathological process underlying sporadic Alzheimer’s disease, Brain, Volume 138, Issue 10, October 2015, Pages 2814–2833, https://doi.org/10.1093/brain/awv23.
Figures
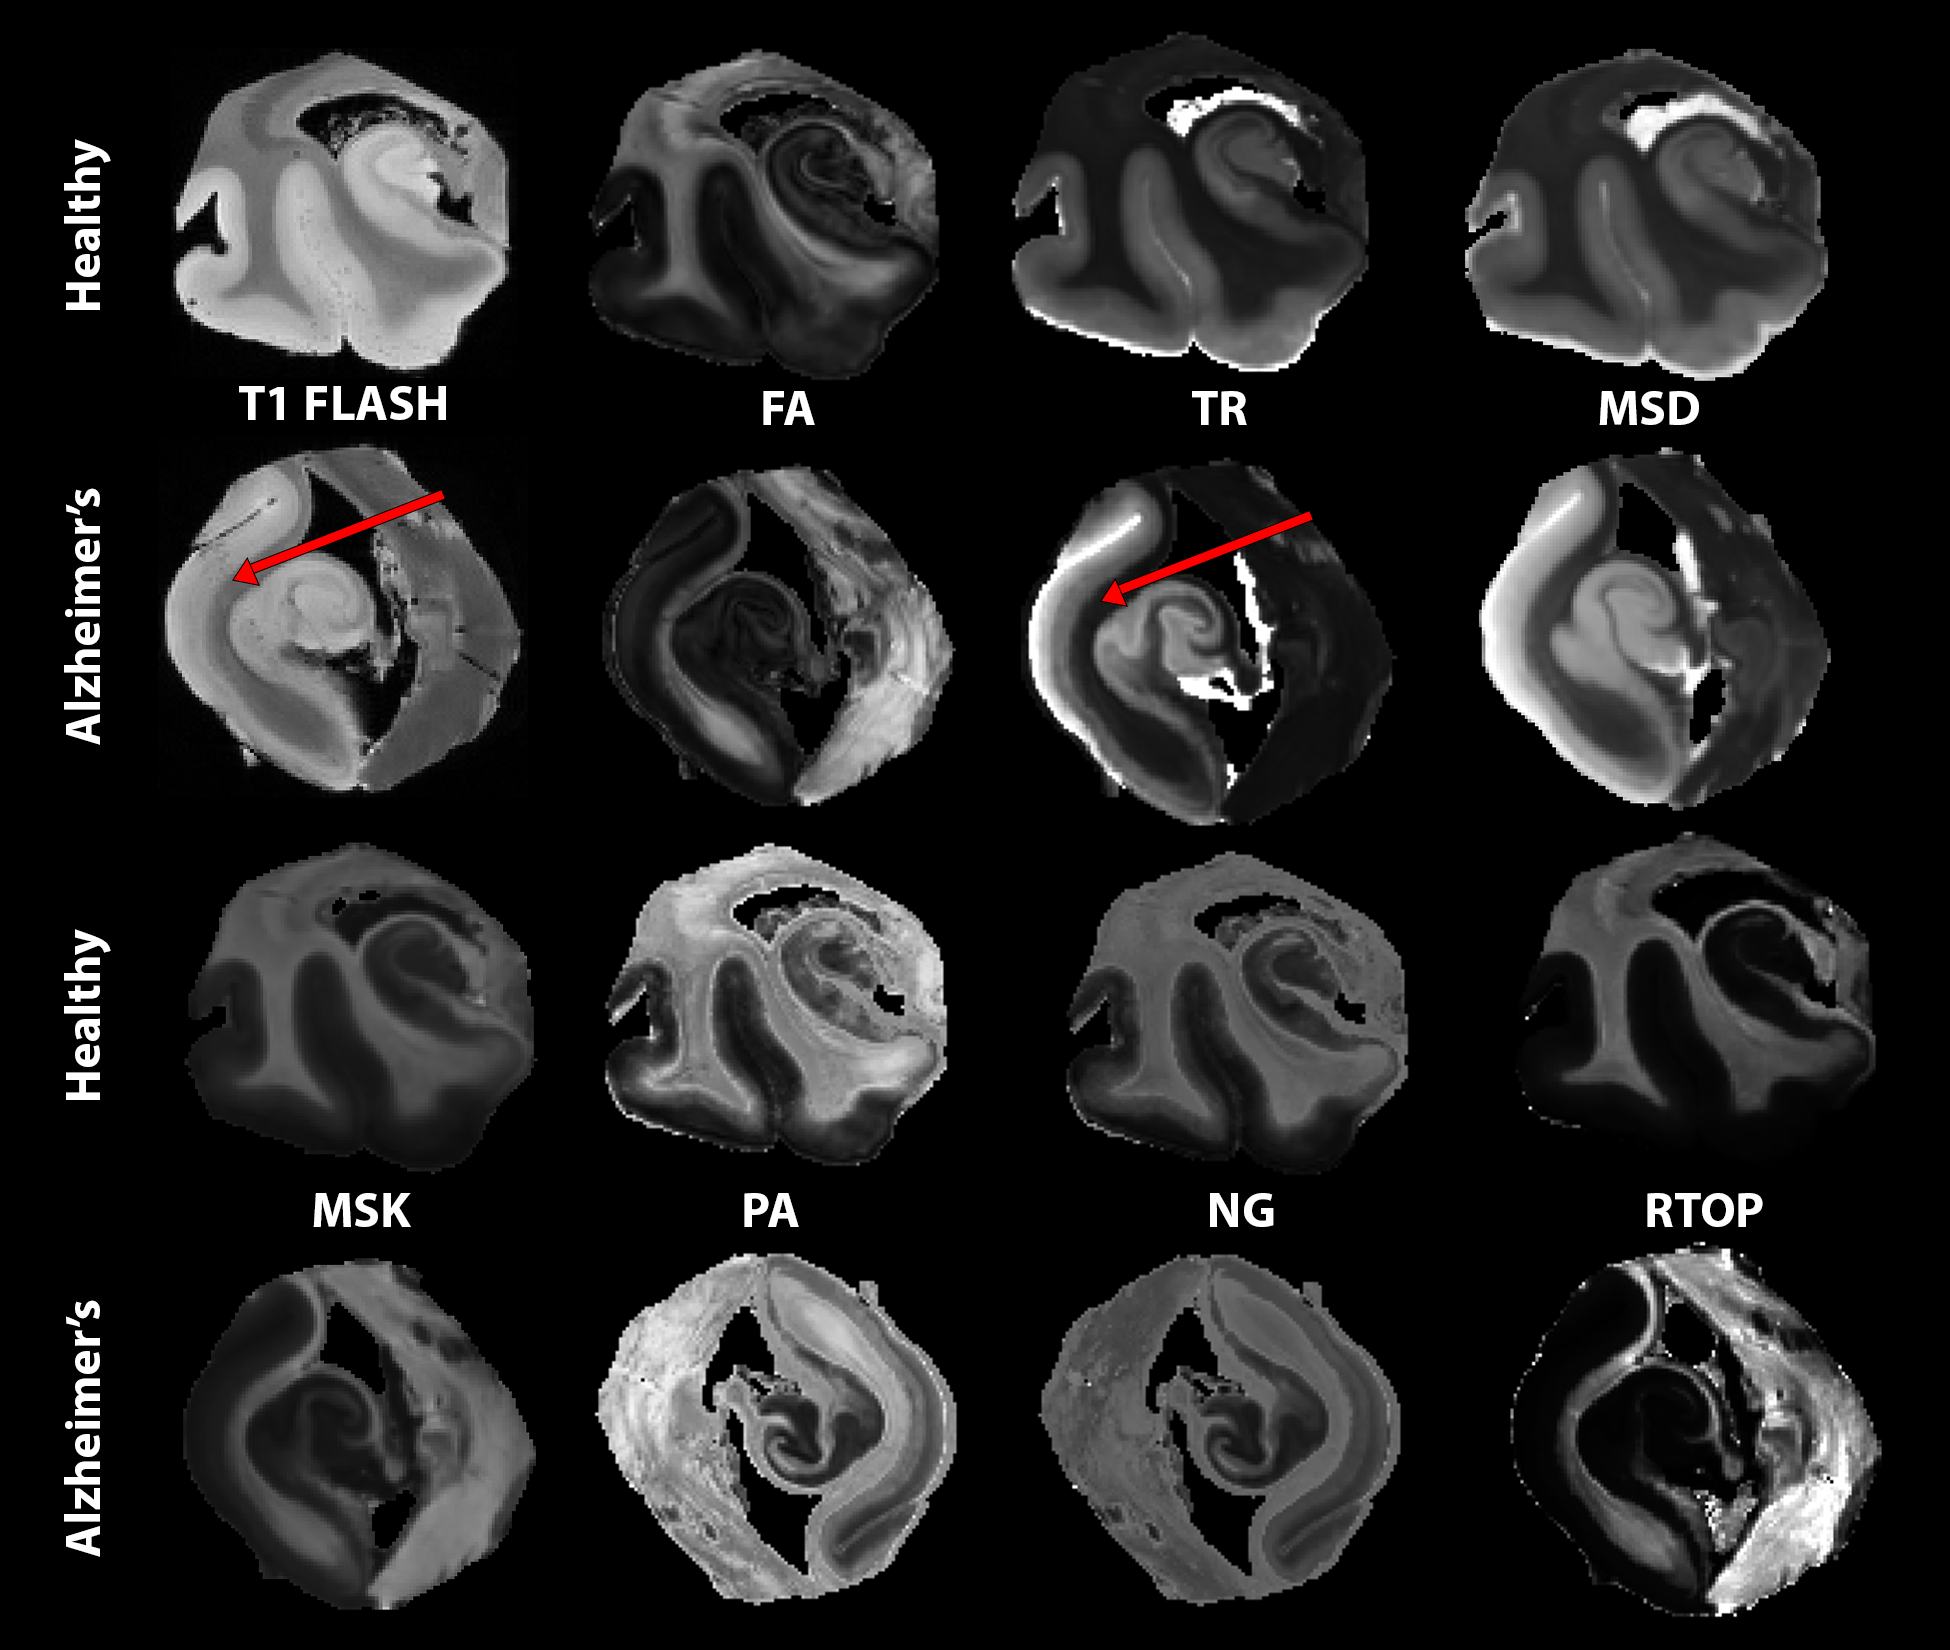
Figure 1: Showcase of metrics organized in two row groupings for healthy (top) and AD (bottom). From left to right anatomical T1 FLASH for reference, diffusion tensor imaging DTI (fractional anisotropy FA, trace TR), mean-signal diffusion kurtosis imaging MSDKI (mean signal diffusivity MSD, mean signal kurtosis MSK) mean apparent propagator MAP (propagator anisotropy PA, non-gaussianity NG, return-to-origin probability RTOP). Red arrows pointing to the cortex showing sensitivities in TR that is not seen in the T1 FLASH.
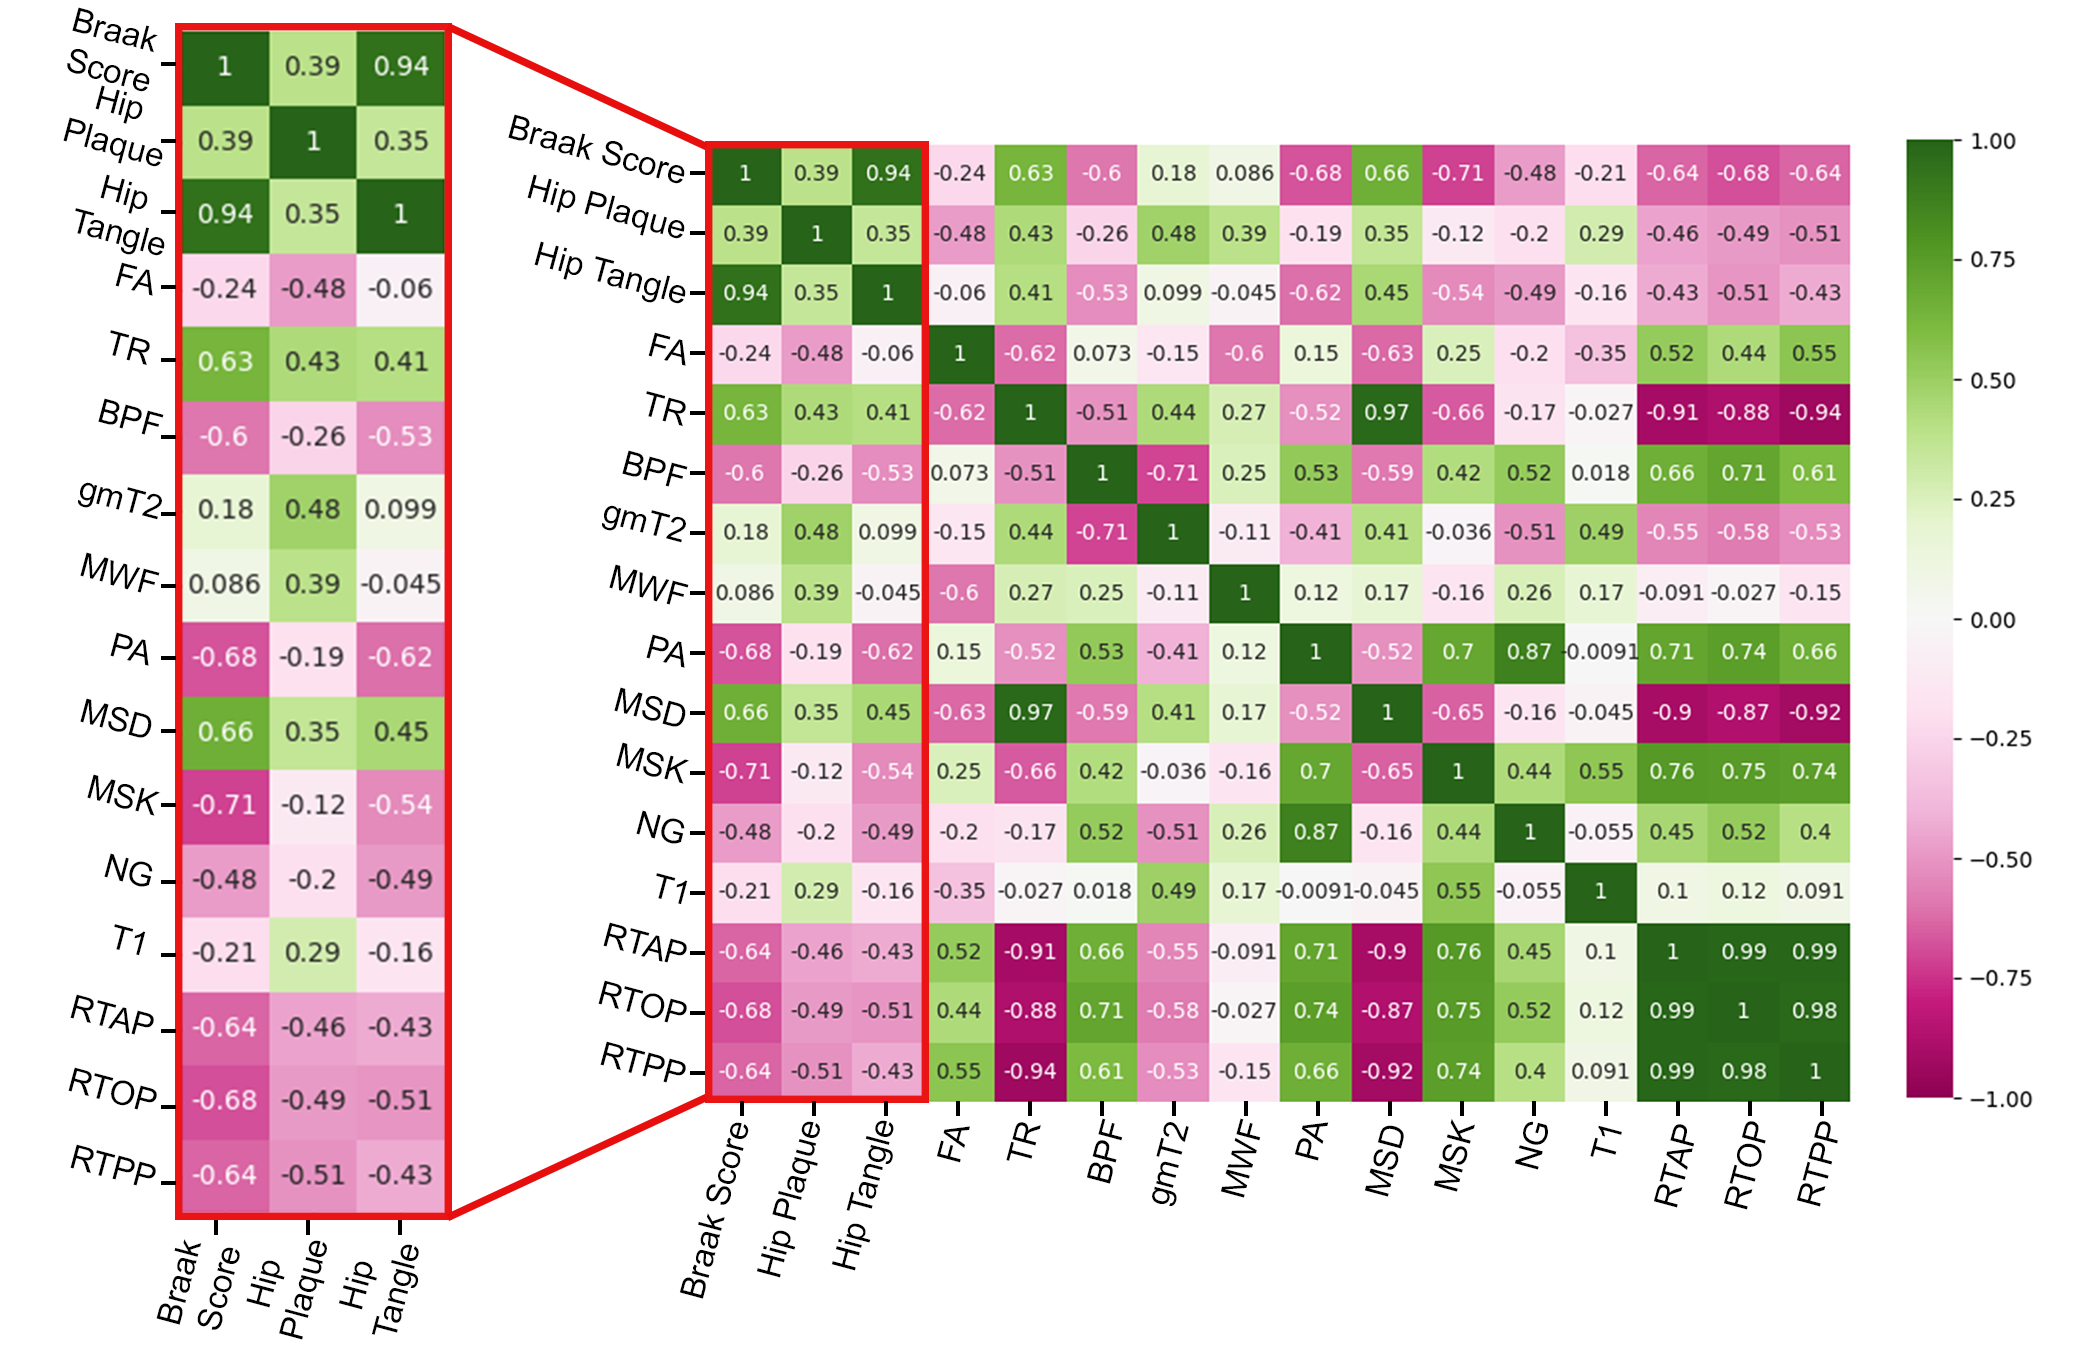
Figure 2: Spearman's correlation analysis accomplished with python commands. A red box highlighting the three pathologic score correlations with all study metrics in 11 hippocampal ROIs. Negative correlations are marked in pink, while positive correlations are notated to be green. Strong negative correlations are observed in restrictive and anisotropic metrics. While positive correlations are present in diffusivity metrics.
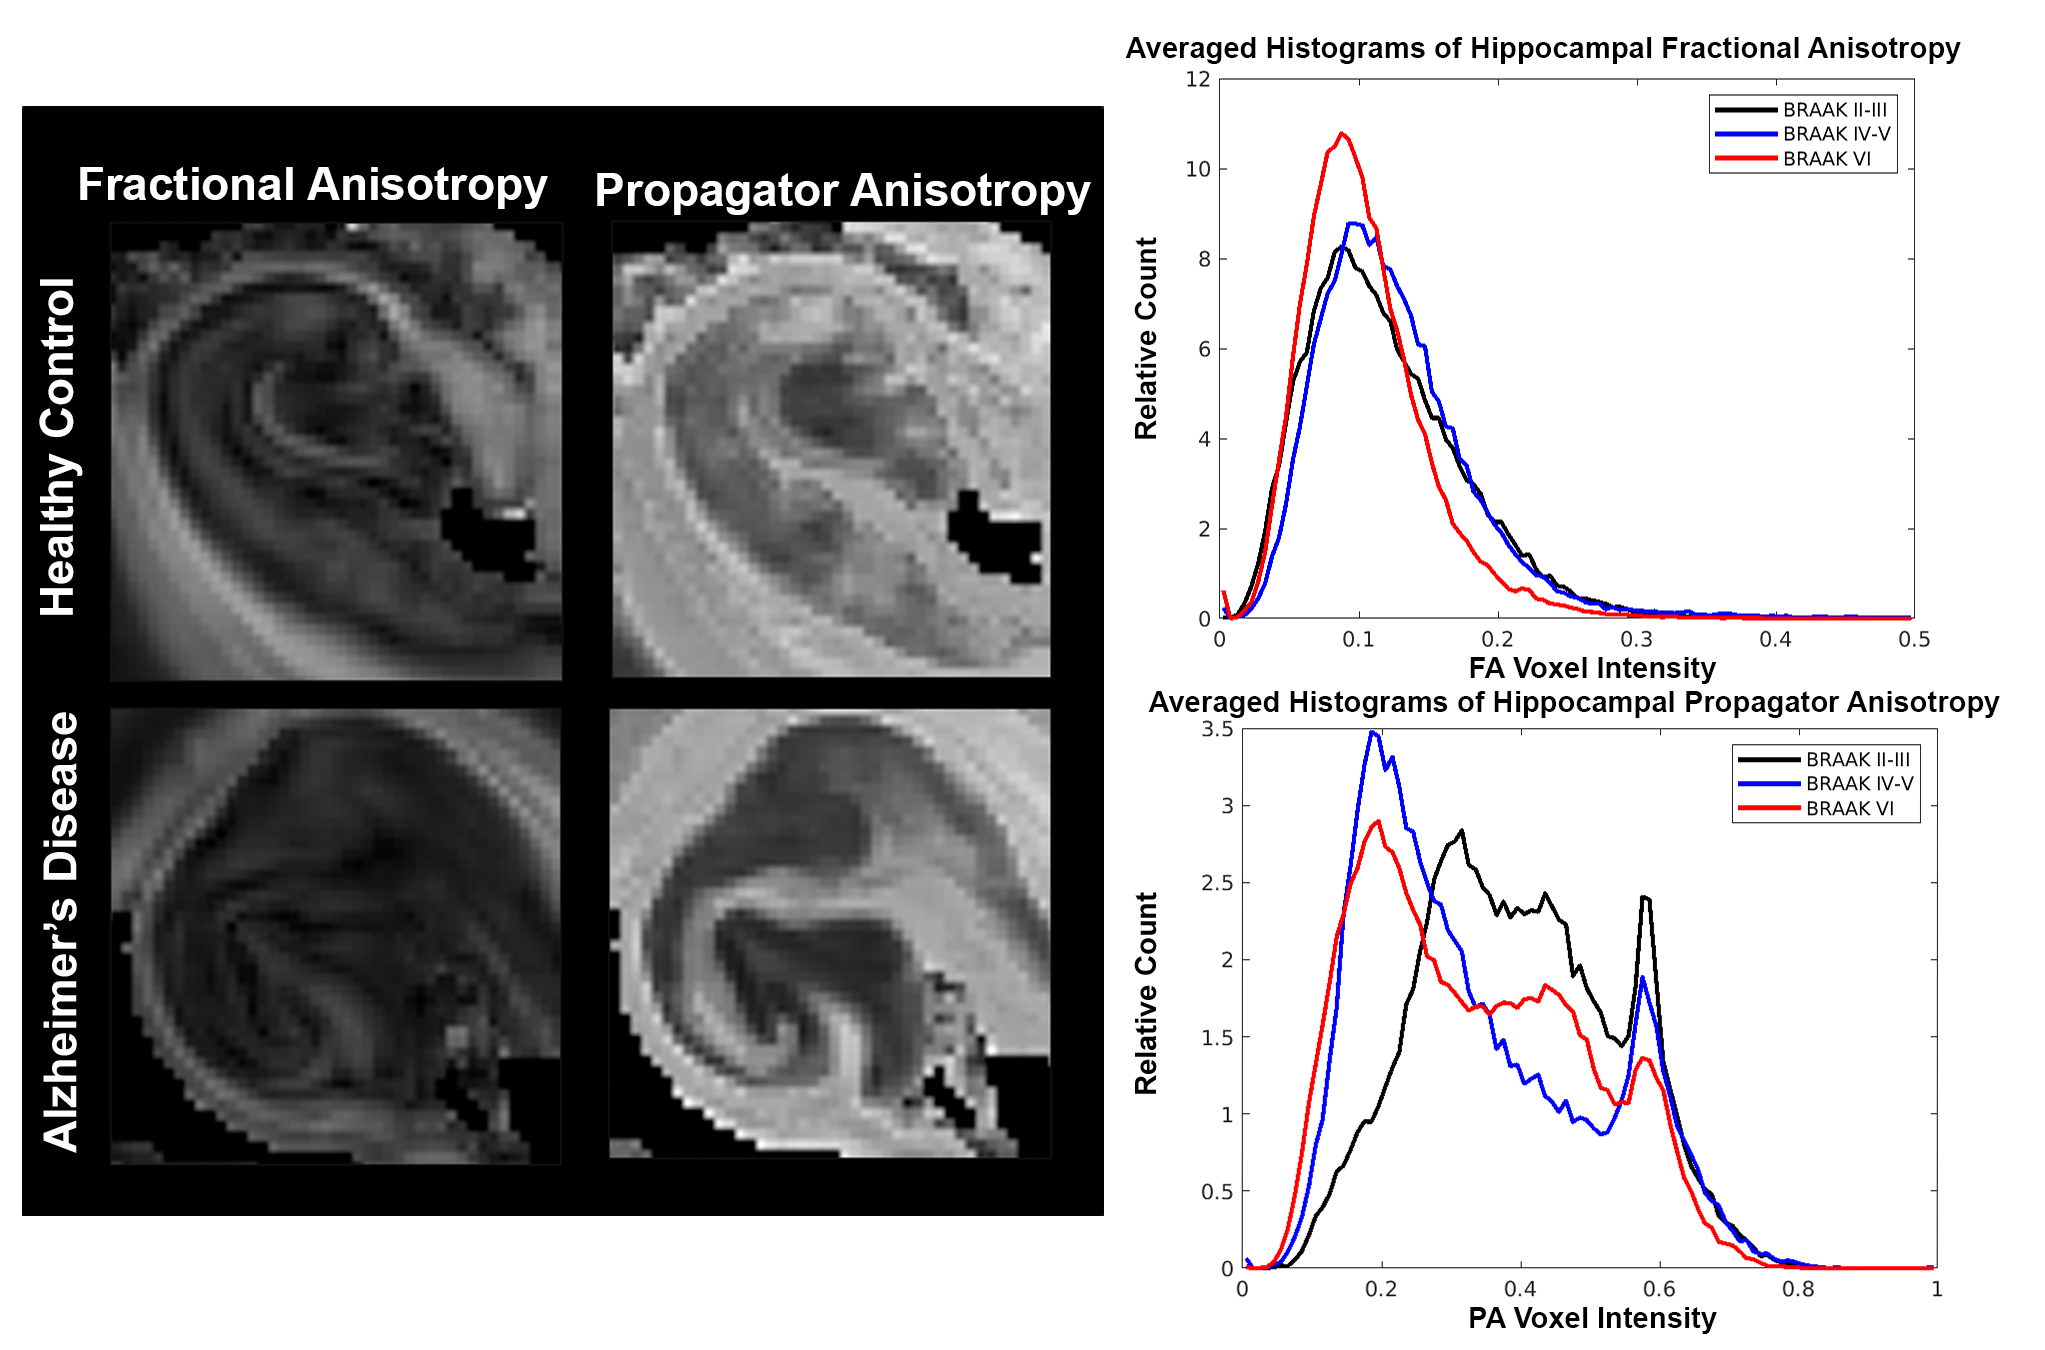
Figure 3: Close inspection of FA and PA in the hippocampus of the initial healthy control and Alzheimer's specimens (left). Normalized-averaged histograms (right) of 11 samples grouped by Braak stages: Braak II-III (early), Braak IV-V (middle), and Braak VI (late). FA shows little changes between the early and middle Braak stages (black and blue). While PA has a strong shift towards lower values for middle and late Braak stage (blue and red).
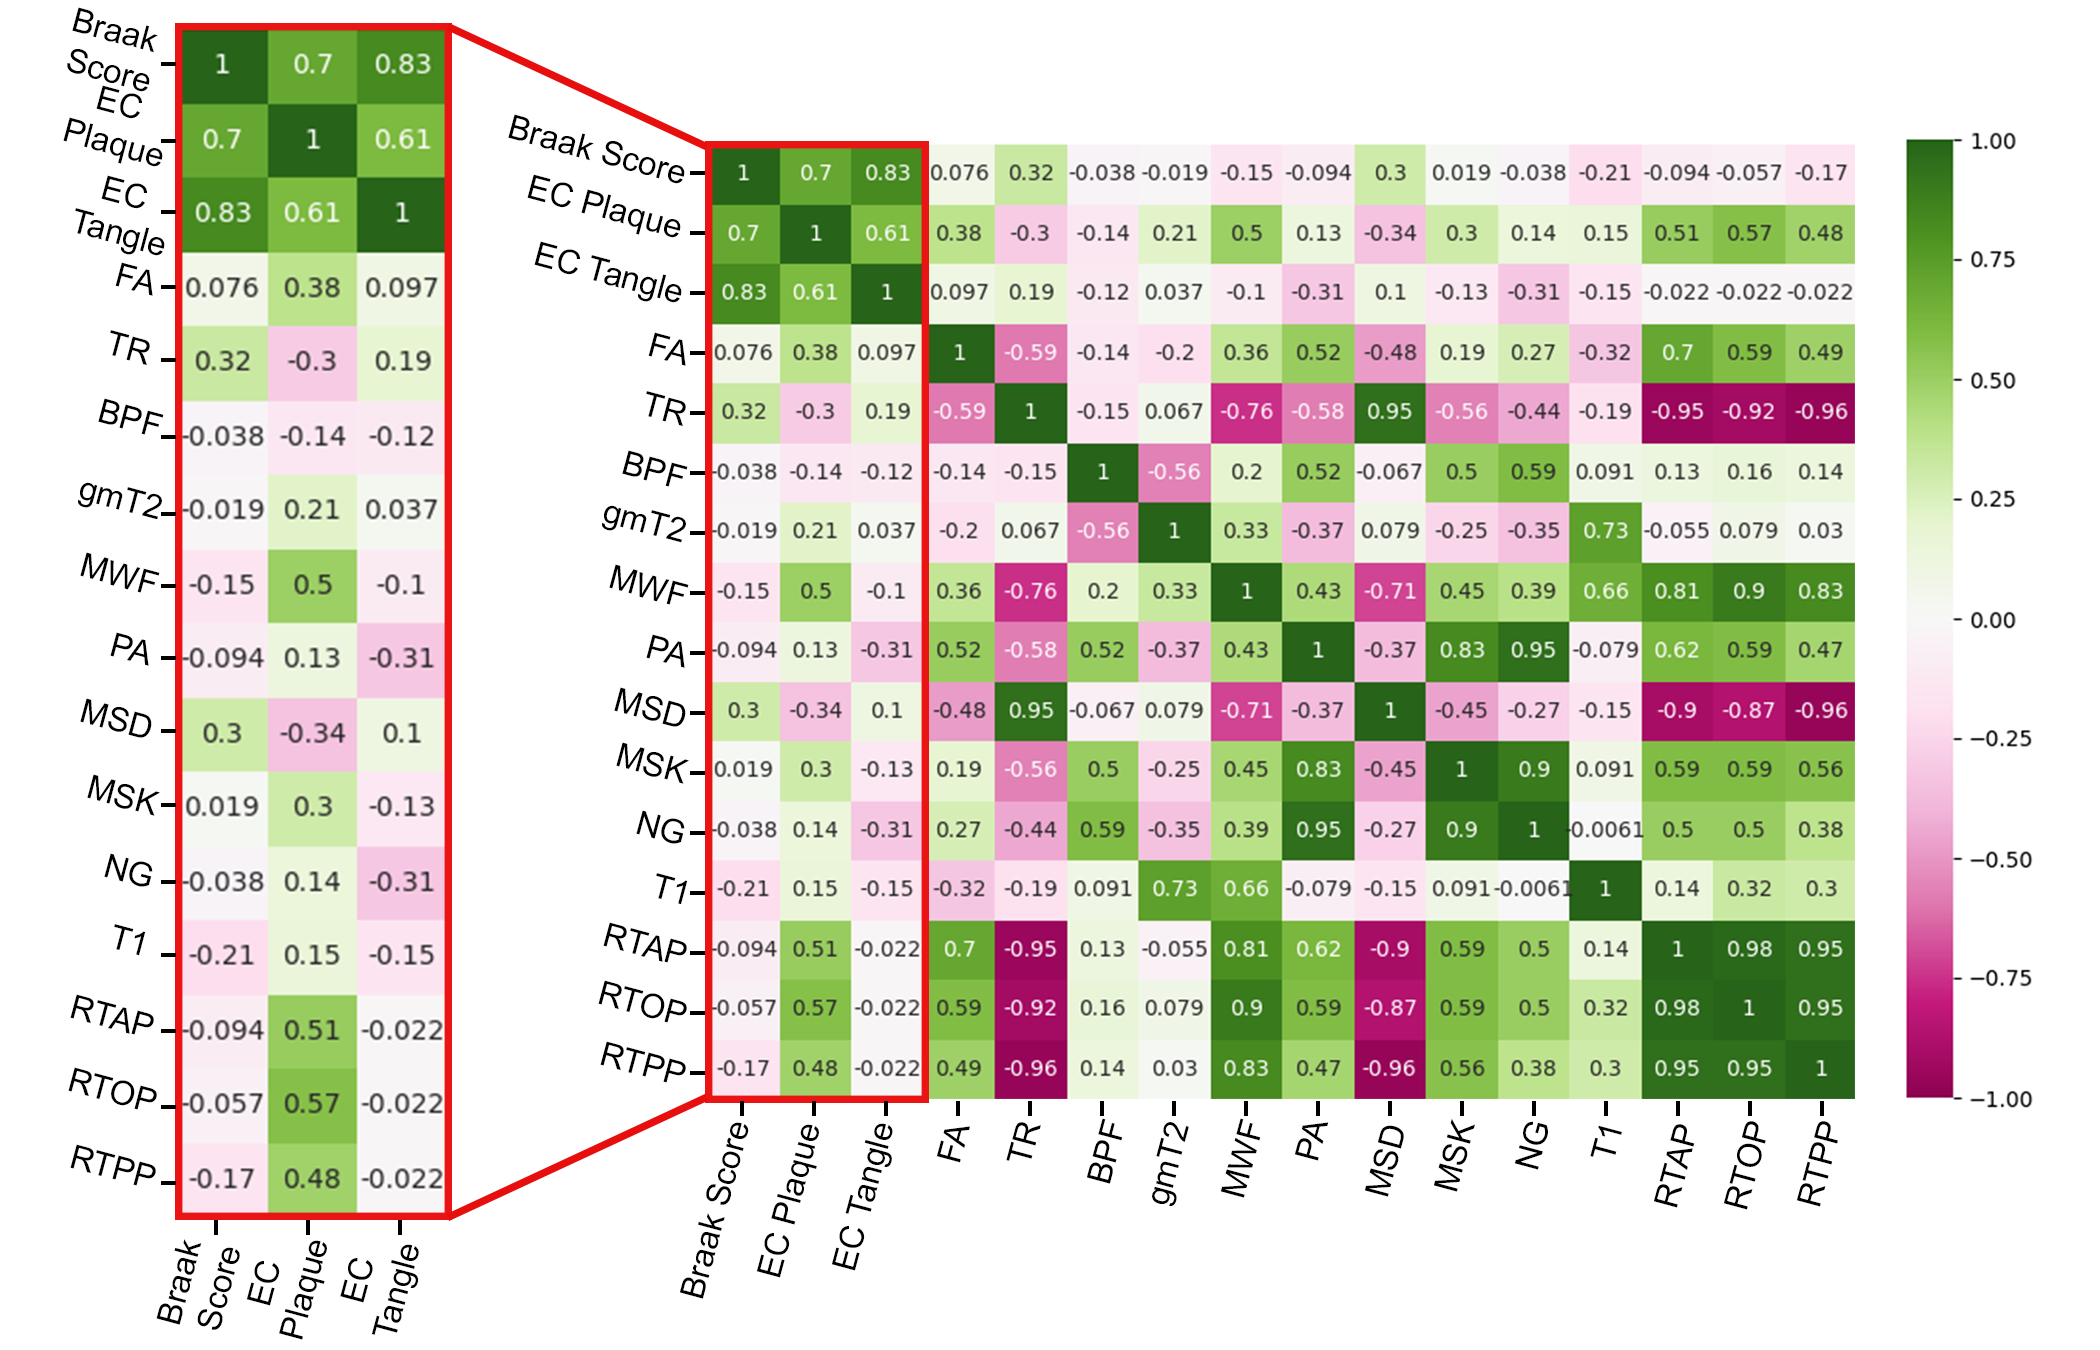
Figure 4: Spearman's correlation analysis in the entorhinal cortex accomplished with python commands. A red box highlighting the three pathologic score correlations with all study metrics in 10 entorhinal cortex ROIs. Negative correlations are marked in pink, while positive correlations are notated to be green. Strong positive correlations are observed in restrictive metrics and FA with plaques. While negative correlations are present in diffusivity metrics with plaques.
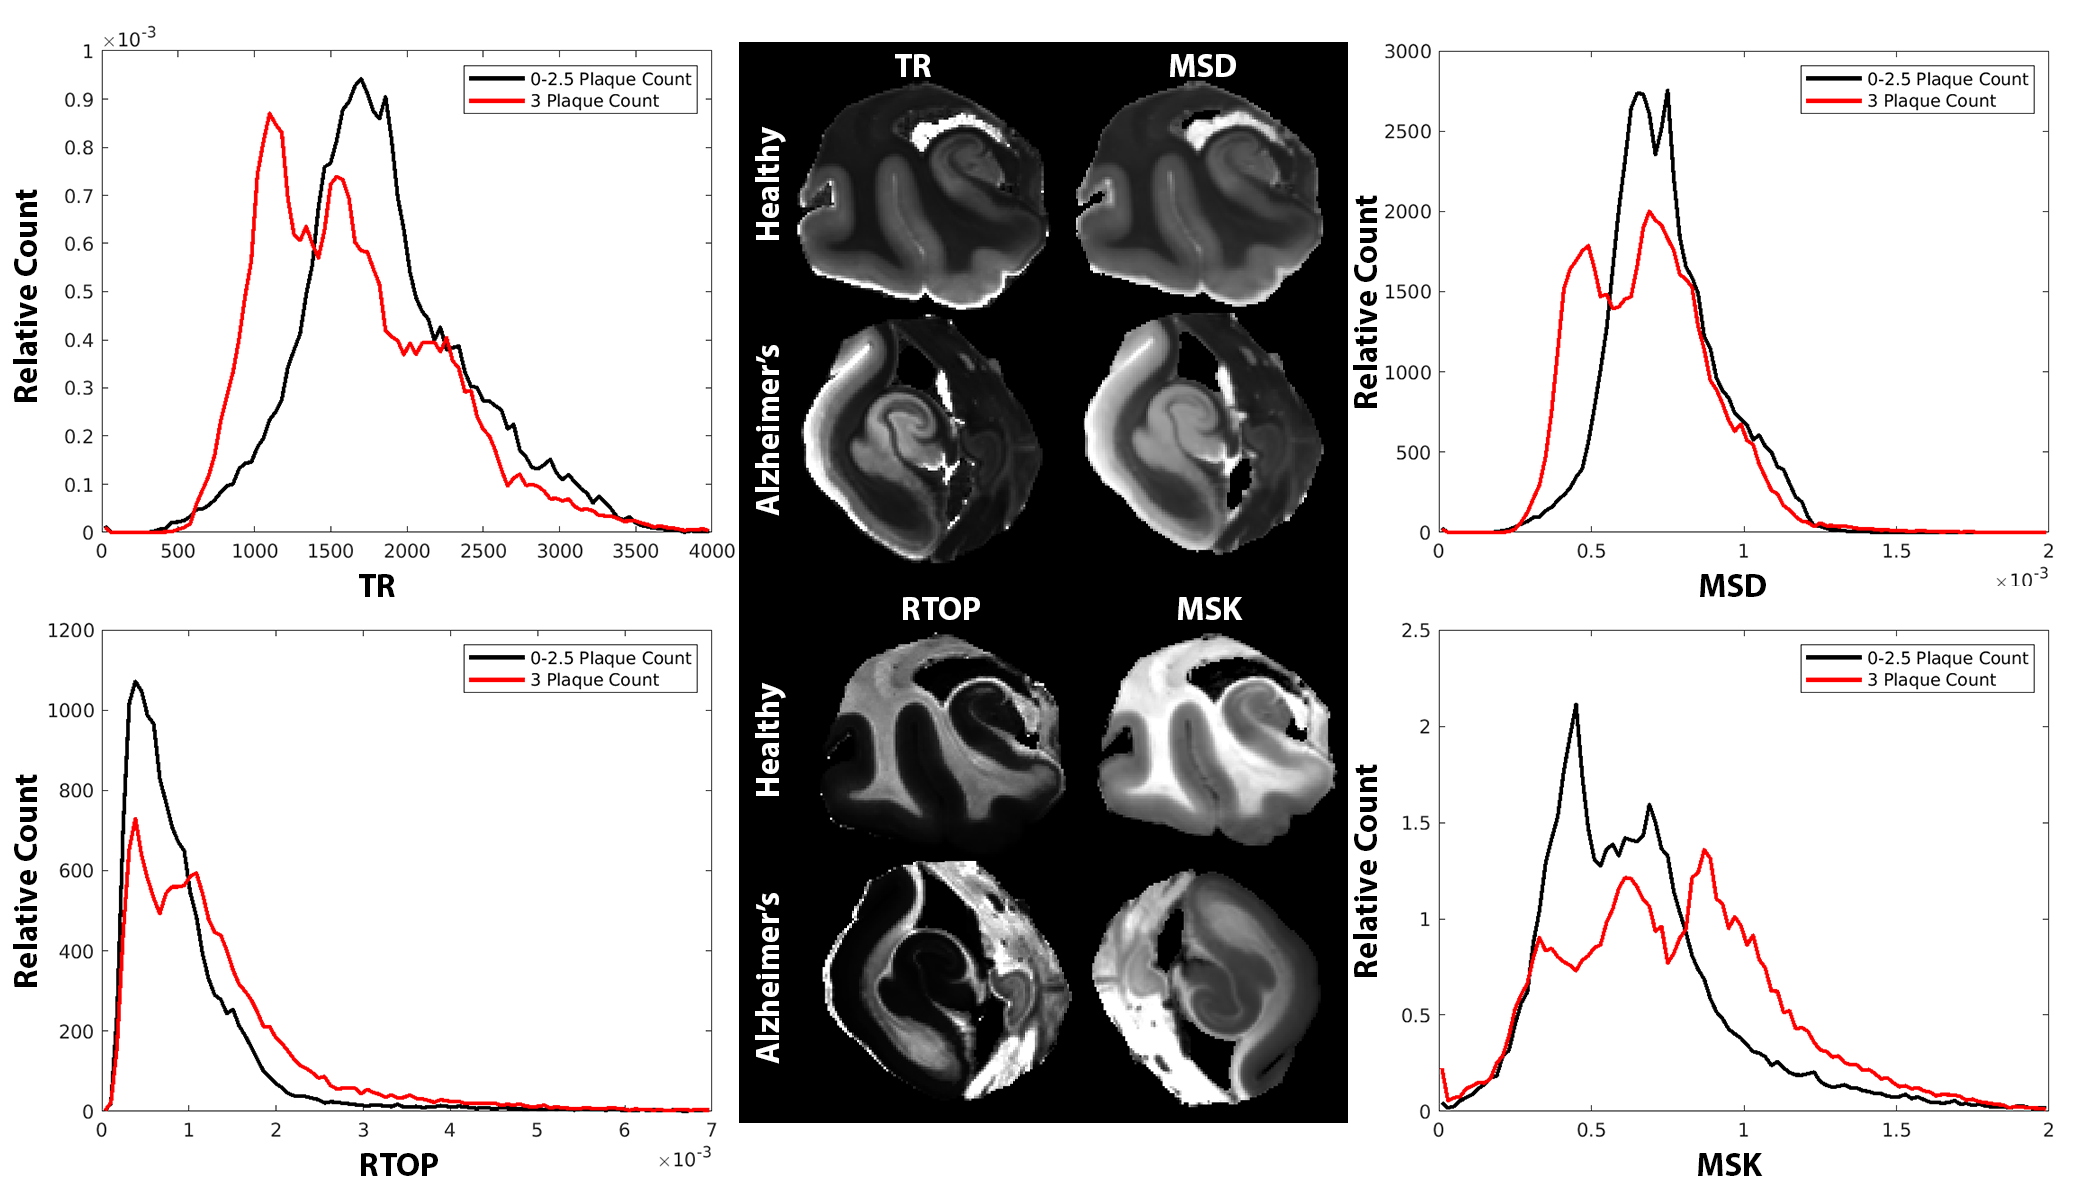
Figure 5: Normalized-averaged histograms in the 10 entorhinal cortexes grouped by beta-amyloid plaque count (0-2.5 in black, 3 in red). TR and MSD show a decrease towards lower values for high plaque counts, while RTOP and MSK increase at higher plaque counts.
DOI: https://doi.org/10.58530/2023/3508