3506
Age-dependent co-variation networks in myelin-related images1Department of Biomedical Engineering and Environmental Sciences, National Tsing Hua University, Hsinchu, Taiwan, 2Institute of Biomedical Engineering and Nanomedicine, National Health Research Institutes, Miaoli, Taiwan, 3Department of Medical Imaging, National Taiwan University Hospital Hsinchu Branch, Hsinchu, Taiwan, 4Department of Radiology, Taoyuan General Hospital, Taoyuan, Taiwan
Synopsis
Keywords: Brain Connectivity, Aging, Myelin co-variation network
Myelin co-variation networks was used to investigate the myelinic alteration in brain degradation. However, a systematic investigation of age-related co-variation networks of multiple myelin-related images remains deficient. We aimed to investigate the age-related effect on myelin co-variation networks in gray matter and white matter. Our results revealed that different myelin-related indices presented different age-dependent evolution of co-variation networks. The age-dependencies of strength of co-variation and topological attributes were mostly in complex polynomial pattern. The investigation of multiple age-related myelin co-variation networks might comprehend the synchronous changes between brain regions and demonstrated its usefulness in predicting the alteration of myelinic tissue.Introduction
Apparent Diffusion coefficient (ADC) map computed from diffusion weighted imaging (DWI) can indirectly reflect the myelination in axon [1]. Fluid Attenuation Inversion Recovery (FLAIR) images show the capability on evaluating the level of myelin enrichment [2]. Myelin water fraction (MWF) is used to directly measure myelin water component in myelin sheaths [3]. The apparent MWF (aMWF) has comparable image quality with conventional MWF technique and benefits from the short acquisition and post-processing time [4]. The ratio of T1-weighted image to T2-weighted image (T1w/T2w ratio) has been reported as an indicator of evaluating myelinic contents with several confounding factors (e.g., axon density) [5, 6].The synchronicity of myelinic changes in different brain regions, namely myelin co-variation network, was used to investigate the myelinic alteration in brain degradation [7, 8]. The elevated myelin covariance was observed in the elderly brain, and the apparent vibrating trajectory of topological attributes across the lifespan has been discussed [8]. However, a systematic investigation of myelin co-variation networks of multiple myelin-related images remains deficient. We aimed to investigate the myelin co-variation networks of different myelin-related images and to explore the age-related effect on myelin co-variation networks in gray matter (GM) and white matter (WM).
Materials & Methods
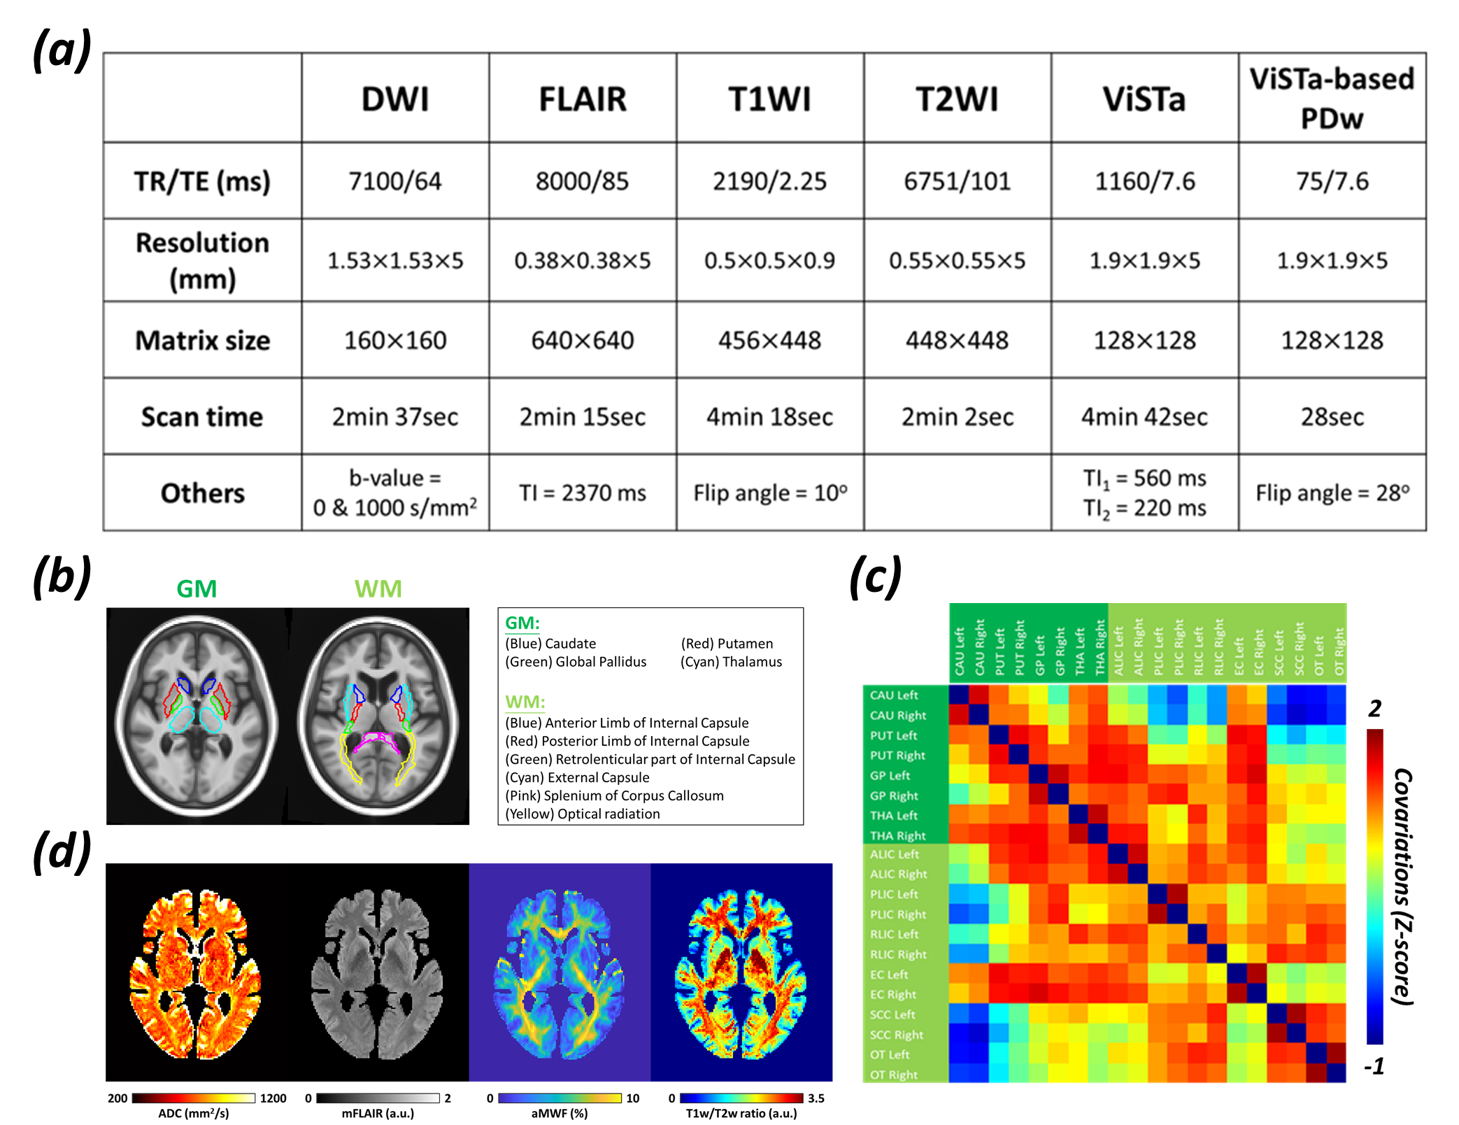
28 healthy volunteers were recruited (male/female=21/7, age=46±12 (28-72) y/o) and sorted ascendingly by their ages. All MRI images were acquired in a 3-T system (Skyra, Siemens). The imaging protocol included DWI, T2-FLAIR, T1WI, T2WI, and ViSTa [4] sequences. The scanning parameters were listed in Figure 1a. aMWF is calculated by: aMWF(%)=(ViSTa/PDw)×0.55×100% [4]. The T1w/T2w ratio was processed with bias correction and intensity standardization [5]. T1WI of each participant was registered on MCALT T1 template provided from Aging and Dementia Research (ADIR) lab at Mayo Clinic [9].Figure 1b illustrates the 4 and 6 regions of interest (ROIs) selected in GM and WM of left and right hemispheres, respectively. The ROI-based linear regressions were performed to express the relationship between mean value of each myelin-related index and age and sex. A Pearson correlation coefficient of the regressed mean value of each myelin-related index between any two selected brain regions was computed in every 5 volunteers with a sliding window of one-volunteer. The Pearson correlation coefficients were transformed to z-score to form a 20-by-20 matrix, i.e., co-variation network (Figure 1c).
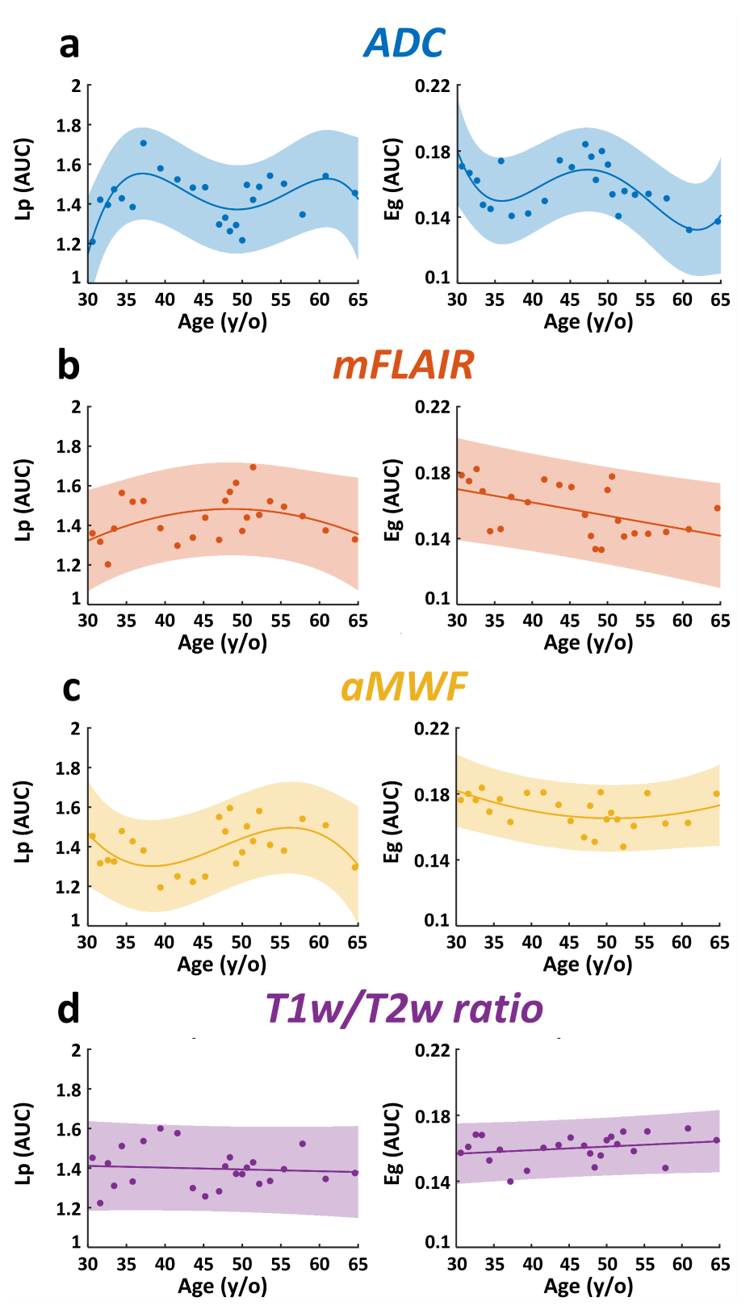
In addition to the strength of co-variation, we computed topological attributes of networks, including characteristics path length (Lp), global efficiency (Eg), clustering coefficient (Cp), and local efficiency (Eloc) [10]. The best-fitted models between age and strengths and attributes were determined by Akaike Information Criterion (AIC) ranged from the 1st- to 8th-order polynomials [11].
Results
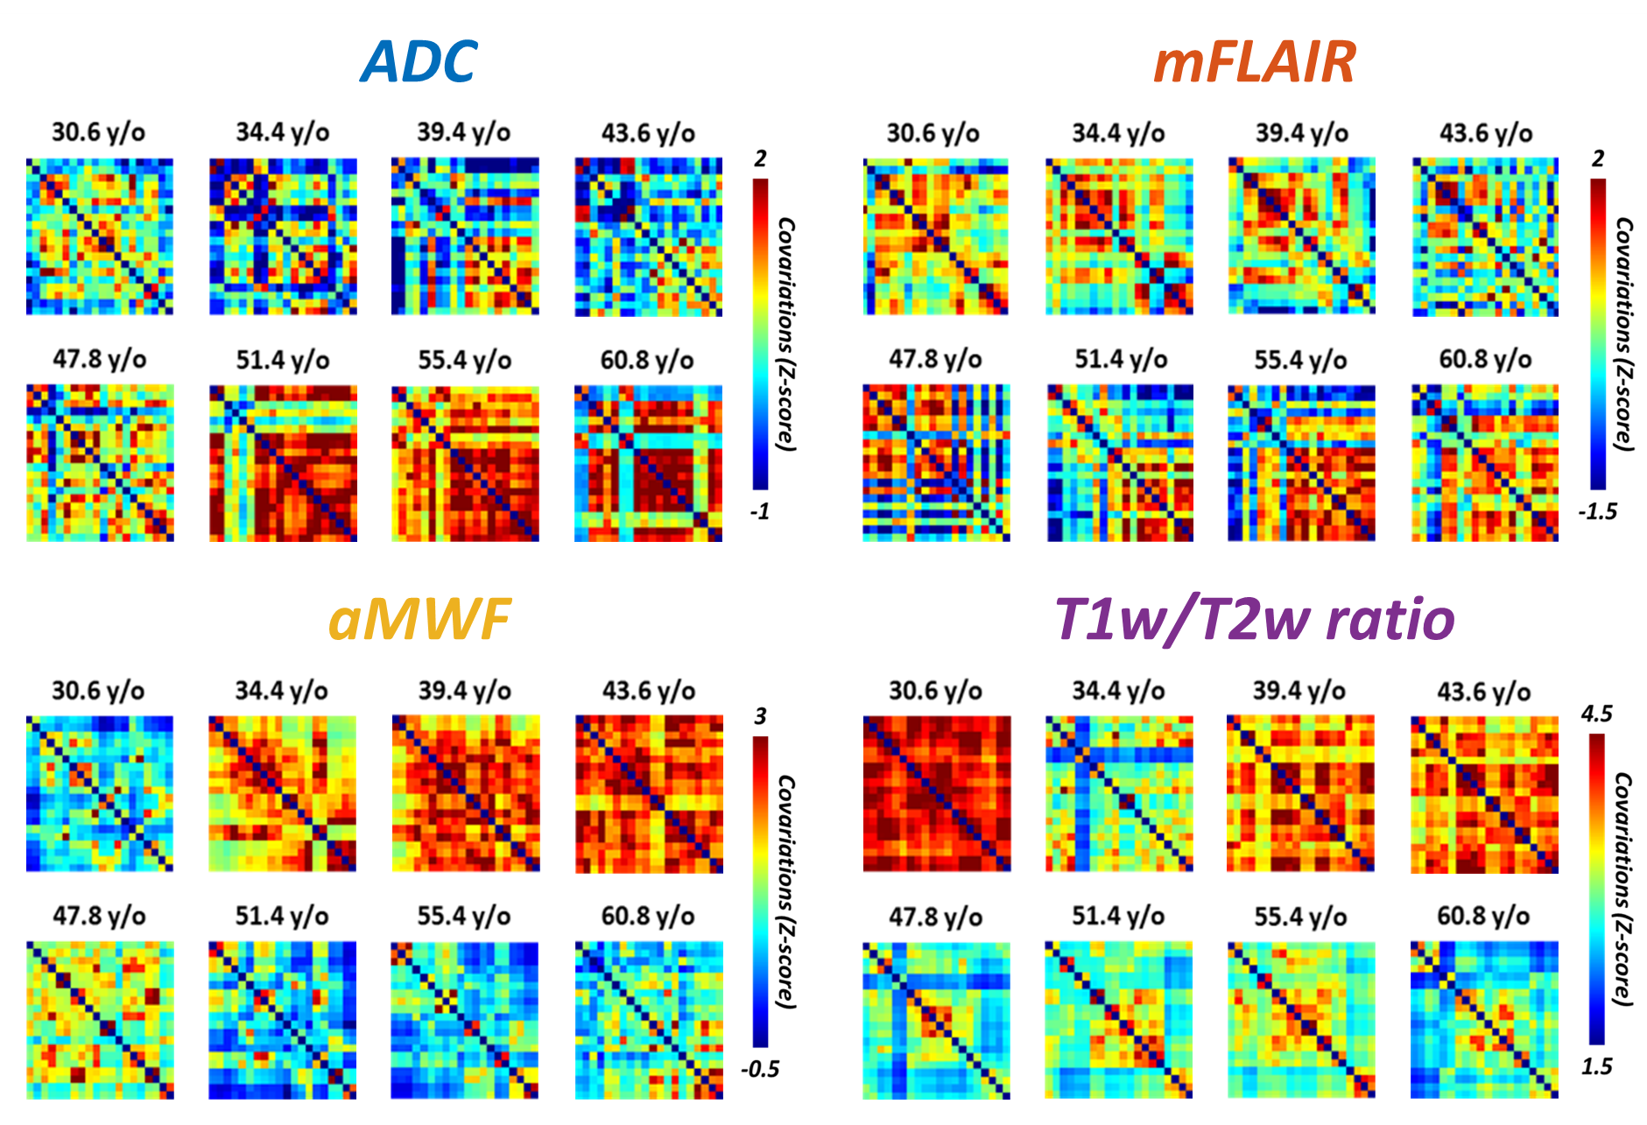
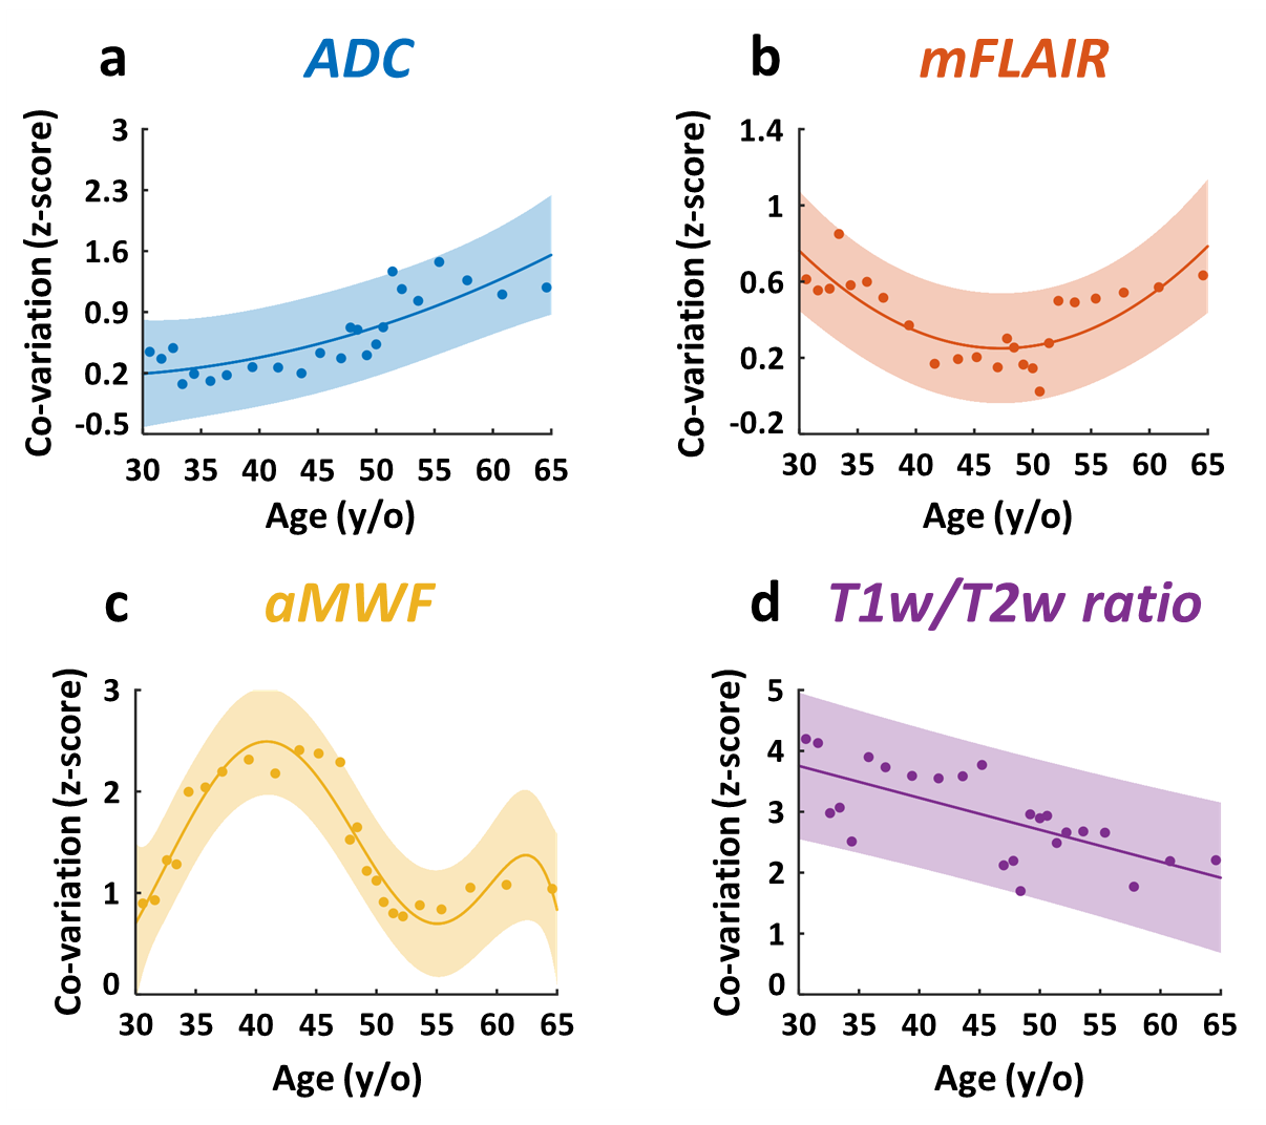
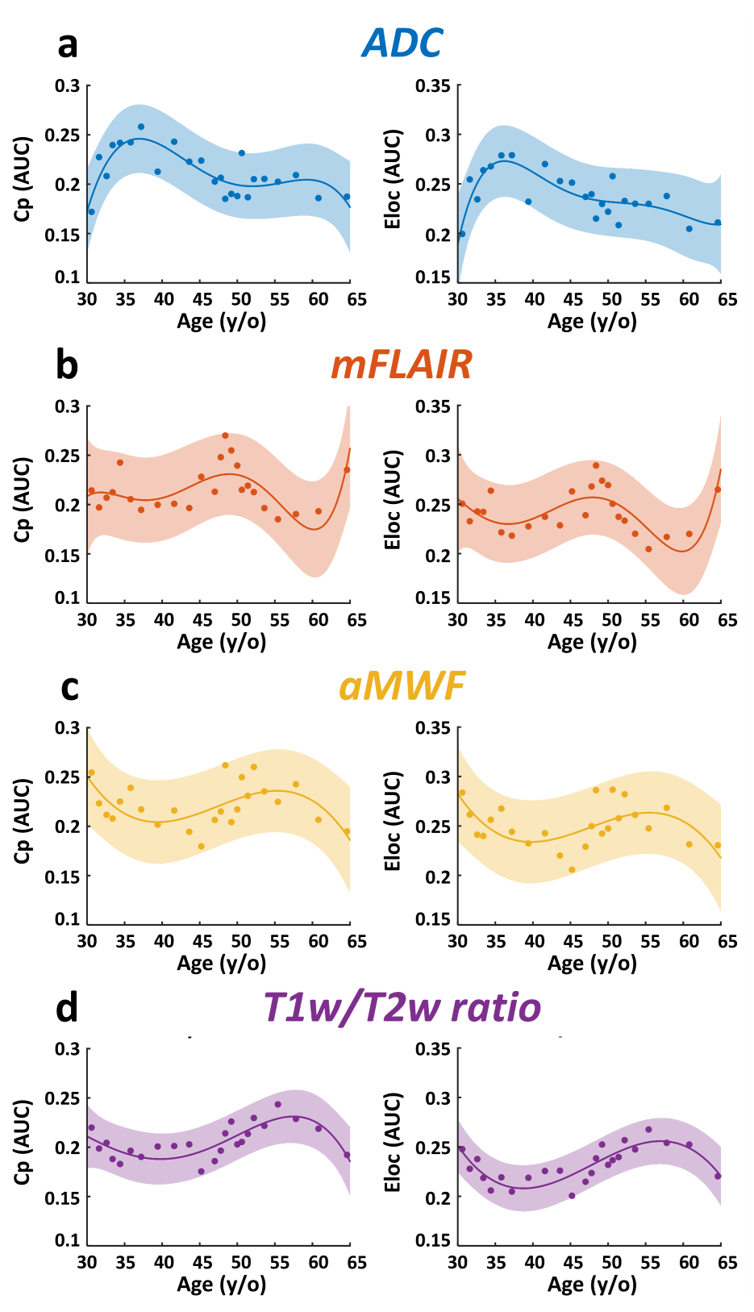
Figure 1d demonstrates the quantitative maps of ADC, mFLAIR, aMWF, and T1w/T2w ratio in a 58-year-old female volunteer. In Figure 2, the co-variation networks of 4 myelin-related indices were shown with an age-interval of 4 years. Different myelin-related indices presented different age-dependent evolution of co-variation networks. In Figure 3(a,d), the strength of co-variation of ADC was monotonically increasing with age while that of T1w/T2w ratio was decreasing with age. In mFLAIR (Figure 3b), the association between the strength of co-variation and age was a 2nd-order polynomial, whose lowest co-variation was at 51-year-old. In aMWF (Figure 3c), the association between the strength of co-variation and age was expressed by a 4th-order polynomial with two local maximums at 43-year-old and 61-year-old.The Lp and Eg of ADC (Figure 4a) presented a 4th-order polynomial age-trajectory, and those of T1w/T2w ratio (Figure 4d) showed a 1st-order polynomial with age. In Figure 5(a,b), Cp and Eloc of ADC and mFLAIR associated with age in high order polynomial (4th- or 5th-order). The Cp and Eloc of aMWF and T1w/T2w ratio revealed 3rd-order polynomial age-trajectory, whose local maximum/minimum locate at similar age (Figure 5(c,d)). aMWF presented similar age-trajectories in Lp, Cp, and Eloc.
Discussion & Conclusion
In this study, we evaluated the myelin co-variation networks of ADC, mFLAIR, aMWF, and T1w/T2w ratio and investigated their age-dependency by topology analysis. The strength of co-variation in ADC and T1w/T2w ratio increased and decreased with age, respectively; while that in mFLAIR and aMWF was a more complex polynomial pattern. The age-dependency of topological attributes, mostly in a high-order polynomial, was differential in each myelin-related index. Lp, Cp and Eloc showed similar age-trajectory, especially in aMWF.Previous studies reported myelin covariance networks of magnetization transfer ratio and T1w/T2w ratio to present the modification of brain networks [7, 8]. Our results confirmed age-related effect on the strength and the topological attributes of co-variation networks. Furthermore, the similar age-trajectory in Lp, Cp, and Eloc implied that the network is alternatively working in an integrated or segregated way and the homeostatic status appears in the observed age range [12].
In conclusion, a systematic investigation of co-variation networks from multiple myelin-related indices could be helpful to comprehend the synchronous changes between brain regions. The topological exploration of the age-related myelin co-variation networks demonstrated its usefulness in predicting the alteration of myelinic tissue.
Acknowledgements
No acknowledgement found.References
1. Aung, W.Y., S. Mar, and T.L. Benzinger, Diffusion tensor MRI as a biomarker in axonal and myelin damage. Imaging Med, 2013. 5(5): p. 427-440.
2. Haller, S., et al., Do brain T2/FLAIR white matter hyperintensities correspond to myelin loss in normal aging? A radiologic-neuropathologic correlation study. Acta Neuropathol Commun, 2013. 1: p. 14.
3. MacKay, A.L. and C. Laule, Magnetic Resonance of Myelin Water: An in vivo Marker for Myelin. Brain Plast, 2016. 2(1): p. 71-91.
4. Oh, S.-H., et al., Direct visualization of short transverse relaxation time component (ViSTa). NeuroImage, 2013. 83: p. 485-492.
5. Ganzetti, M., N. Wenderoth, and D. Mantini, Whole brain myelin mapping using T1- and T2-weighted MR imaging data. Frontiers in Human Neuroscience, 2014. 8.
6. Ginestet, C.E., et al., Brain network analysis: separating cost from topology using cost-integration. PloS one, 2011. 6(7): p. e21570.
7. Ma, Z. and N. Zhang, Cross-population myelination covariance of human cerebral cortex. Human Brain Mapping, 2017. 38(9): p. 4730-4743.
8. Melie-Garcia, L., et al., Networks of myelin covariance. Human Brain Mapping, 2018. 39(4): p. 1532-1554.
9. Schwarz, C., et al. The mayo clinic adult lifespan template (MCALT): better quantification across the lifespan. in Alzheimer’s Association International Conference.[Google Scholar]. 2017.
10. Rubinov, M. and O. Sporns, Complex network measures of brain connectivity: Uses and interpretations. NeuroImage, 2010. 52(3): p. 1059-1069.
11. Bozdogan, H., Model selection and Akaike's information criterion (AIC): The general theory and its analytical extensions. Psychometrika, 1987. 52(3): p. 345-370.
12. Lord, L.-D., et al., Understanding principles of integration and segregation using whole-brain computational connectomics: implications for neuropsychiatric disorders. Philosophical Transactions of the Royal Society A: Mathematical, Physical and Engineering Sciences, 2017. 375(2096): p. 20160283.
Figures