3504
Functional relevance of cholinergic projections in the ChAT-IRES-Cre mouse brain using optogenetic functional MRI
Thajunnisa Ashraf Sajitha1, Russell W Chan1, Patryk Filipiak2, Muneeb Faiq1, Royce P Lee1, Steven H Baete2, and Kevin C Chan1,3,4
1Department of Ophthalmology, NYU Langone Health, New York University Grossman School of Medicine, New York, NY, USA 10017, New York, NY, United States, 2Center for Advanced Imaging Innovation and Research (CAI2R), Department of Radiology, NYU Langone Health, New York University Grossman School of Medicine, New York, NY, USA 10017, New York, NY, United States, 3Department of Radiology, New York University Grossman School of Medicine, New York, NY, USA 10017, New York, NY, United States, 4Center for Neural Science, NYU College of Arts and Sciences, New York, NY, 10003, New York, NY, United States
1Department of Ophthalmology, NYU Langone Health, New York University Grossman School of Medicine, New York, NY, USA 10017, New York, NY, United States, 2Center for Advanced Imaging Innovation and Research (CAI2R), Department of Radiology, NYU Langone Health, New York University Grossman School of Medicine, New York, NY, USA 10017, New York, NY, United States, 3Department of Radiology, New York University Grossman School of Medicine, New York, NY, USA 10017, New York, NY, United States, 4Center for Neural Science, NYU College of Arts and Sciences, New York, NY, 10003, New York, NY, United States
Synopsis
Keywords: Brain Connectivity, fMRI (task based)
Recent studies have mapped the whole-brain cholinergic projections in the mouse brain. However, their functional relevance remains unclear. In this study, we used optogenetic functional MRI to observe the functional brain responses upon stimulating the cholinergic neurons in the basal forebrain. We observed significant BOLD percentage change in 14 out of 19 brain regions evaluated, indicating their functional relevance to the cholinergic system.Introduction
Cholinergic system in the brain plays a critical role in the cognition, sensory and motor responses through neural modulations by the neurotransmitter acetylcholine. Although previous studies identified cholinergic circuits in the mouse brain using chemogenetic modulations and bacterial artificial chromosome (BAC)-mediated and Cre dependent genetic labeling, the functional relevance are yet to be elucidated. (1,2,3,4). The recent development of optogenetics and transgenic mouse lines like ChAT-IRES-Cre has allowed experimental manipulations of the cholinergic innervations in the brain. The cholinergic projections from the basal forebrain to specific brain regions such as anterio-medial visual area (VISam), arcuate nucleus of hypothalamus (ARH), nucleus of diagonal band (NDB), Edinger-Westphal nucleus (EW), facial motor nucleus (VII), hippocampal formation (HPF), hypothalamus (HY), laterodorsal tegmental nucleus (LDT), locus ceruleus (LC), medial septal nucleus (MS), nucleus of solitary tract (NTS), oculomotor nerve (IIIn), oculomotor nucleus (III), olivery pretectal nucleus (OP), pedunculopontine nucleus (PPN), primary visual area (VISp), retrosplenal area (RSP), striatum (STR) and thalamus (TH) have been demonstrated with genetic labeling of GFP fluorescence in the ChAT-Cre cholinergic neurons2,5. Here we applied optogenetic stimulation of the basal forebrain and functional MRI to observe their functional relevance by examining the level of activations in these 19 brain regions.Methods
AAV injection and optic fiber implantation in the basal forebrain Three-month-old male ChAT-Cre mice (n = 4) were used for the optogenetic fMRI experiments. For the optogenetic fMRI experiments, double-floxed inverted open reading frame (DIO) recombinant AAV5 virus was used to express ChR2-EYFP in the Cre-expressing neurons. A craniotomy was performed at coordinates + 1.0 mm anterior-posterior, − 0.2 mm medial-lateral, + 5.2 mm dorsal-ventral to inject 1.0 μL of AAV5/DIO-ChR2–EYFP virus to the basal forebrain. A customized cannula was implanted in the basal forebrain through the same craniotomy and secured on the skull using light-cured dental cement. The correct placement of the cannula was validated through T2-weighted images in all the animals. MRI protocols All fMRI scans were performed in a 7-Tesla Bruker scanner after 4 weeks of AAV injection and optic fiber implantation. T2-weighted images were acquired with RARE factor = 4, TE/TR = 8.3/3000 ms, FOV = 16×16 mm2, 160×160 matrix, and 20 contiguous 0.75-mm slices for anatomical reference. The cholinergic neurons in the basal forebrain was optogenetically stimulated with blue light delivered through the optic fiber implant using 473-nm laser measured before scanning as ~1.5 mW peak power at the tip corresponding to a light intensity of ~45 mW/mm2 pulsed at 16 Hz with a pulse width of 10 ms (i.e., 16% duty cycle). A block-design paradigm was used with 20s baseline initially followed by four 20s-40s ON-OFF periods. Images were acquired using a transmit-only birdcage coil with a custom actively decoupled single-loop receive-only surface coil. Single-shot GE-EPI sequence was used with TE/TR = 12/1000 ms, FOV = 16×16 mm2, 64×64 matrix, 20 contiguous 0.75-mm axial slices, and 260 volumes. Data analysis We registered the T2-weighted images to the Allen mouse brain atlas(6) using Advanced Normalization Tools (ANTs)(7). We identified the regions of interest (Figure 1) and dilated them with fslmaths(8) for increased readability. Simultaneously, we preprocessed the NORDIC-denoised fMRI signal with Statistical Parametric Mapping (SPM)(10) using default parameters. We then averaged the detrended BOLD signal among all 4 mice and used one-way ANOVA to identify regions with significant activation.Results and Discussions
Optogenetic fMRI of the brain showed activated voxels upon stimulation of the basal forebrain across the forebrain and midbrain regions (Figure 2). For each time point, a series of one-way ANOVAs followed by Tukey’s correction for evaluating the percentage BOLD change over time was conducted (Figure 3).There were significant differences in BOLD change over time (time points: before, during and after stimulation) in 14 out of 19 regions of interest which include NDB [F( 59, 180) = 2.660, p<.0001], EW [F( 59, 180) = 2.660, p<.0001], VII [F(59, 180) = 1.647, p<.0066], HPF [F(59, 180) = 1.751, p<.0027], HY [F(59, 180) = 2.289, p<.0001], LDT [F(59, 180) = 1.797, p<.0018], MS [F(59, 180) = 2.930, p<.0001], NTS [F(59,180)=1.729 , p<.0032], III [F(59, 180) = 1.737, p<.0030, OP [F(59, 180) = 7.614), p<.0001], PPN [F( 59, 180) = 2.960, p<.0001], RSP [F(59, 180) = 3.532, p<.0001, STR [F(59, 180) = 2.975, p<.0001], TH [F(59, 180) = 6.756, p<.0001], Tukey’s-corrected pairwise comparisons revealed significant increases between each subsequent time point (all p’s <.001).
Among these regions of interest highest percentage BOLD change was observed in OP, NTS, TH, NDB and MS. No activity could be observed in LC and IIIn. Since NDB and MS are parts of the basal forebrain, their BOLD signal increases indicated the successful functional activation of cholinergic neurons in the ChAT-IRES-Cre mouse brain. The activation of other brain regions also suggested their functional relevance of the cholinergic projections from the basal forebrain, which is a major source of cholinergic input in the brain. The BOLD activation of the NTS and OP which regulate the parasympathetic activity also suggested the potential overlap in the circuitry of cholinergic and parasympathetic system.
Conclusions
The significant BOLD changes across different brain regions after optogenetic stimulation of the basal forebrain in ChAT-IRES-Cre indicate their functional relevance to the cholinergic nervous system.Acknowledgements
This work was supported in part by the National Institutes of Health P30-CA016087, P41-EB017183, and R01-EY028125 (Bethesda, Maryland); BrightFocus Foundation G2019103 (Clarksburg, Maryland); and an unrestricted grant from Research to Prevent Blindness to NYU Langone Health Department of Ophthalmology (New York, New York).References
1. Gong, S., Zheng, C., Doughty, M. et al. A gene expression atlas of the central nervous system based on bacterial artificial chromosomes. Nature 425, 917–925 (2003). https://doi.org/10.1038/nature02033 2. Li, X.; Yu, B.; Sun, Q.; Zhang, Y.; Ren, M.; Zhang, X.; Li, A.; Yuan, J.; Madisen, L.; Luo, Q.; et al. Generation of a whole-brain atlas for the cholinergic system and mesoscopic projectome analysis of basal forebrain cholinergic neurons. Proc. Natl. Acad. Sci. USA 2018, 115, 415–420. [Google Scholar] [CrossRef][Green Version] 3. Li, Y., Hollis E. Basal Forebrain Cholinergic Neurons Selectively Drive Coordinated Motor Learning in Mice. J Neurosci. 2021 Dec 8;41(49):10148-10160. doi: 10.1523/JNEUROSCI.1152-21.2021. Epub 2021 Nov 8. PMID: 34750228; PMCID: PMC8660044. 4. Lee, C., Lavoie A., Liu, J., Chen, S. X., Liu, B. Light Up the Brain: The Application of Optogenetics in Cell-Type Specific Dissection of Mouse Brain Circuits. Frontiers in Neural Circuits. 14 (2020) DOI=10.3389/fncir.2020.00018 5. Huerta-Ocampo, I., Dautan, D., Gut, N.K. et al. Whole-brain mapping of monosynaptic inputs to midbrain cholinergic neurons. Sci Rep 11, 9055 (2021). https://doi.org/10.1038/s41598-021-88374-6 6. Dong, Hong Wei. The Allen reference atlas: a digital color brain atlas of the C57Bl/6J male mouse. John Wiley and Sons Inc, 2008 7. Avants, B. B., Tustison, N. J., Song, G., Cook, P. A., Klein, A., & Gee, J. C. (2011). A reproducible evaluation of ANTs similarity metric performance in brain image registration. Neuroimage, 54(3),2033-2044 8. M. Jenkinson, C.F. Beckmann, T.E. Behrens, M.W. Woolrich, S.M. Smith. FSL. NeuroImage, 62:782-90, 2012 9. Moeller, S., Pisharady, P. K., Ramanna, S., Lenglet, C., Wu, X., Dowdle, L., ... & Akçakaya, M. (2021). NOise reduction with DIstribution Corrected (NORDIC) PCA in dMRI with complex-valued parameter-free locally low-rank processing. Neuroimage, 226, 117539 10. Flandin, G., & Friston, K. J. (2008). Statistical Parametric mapping (SPM). Scholarpedia, 3(4).Figures
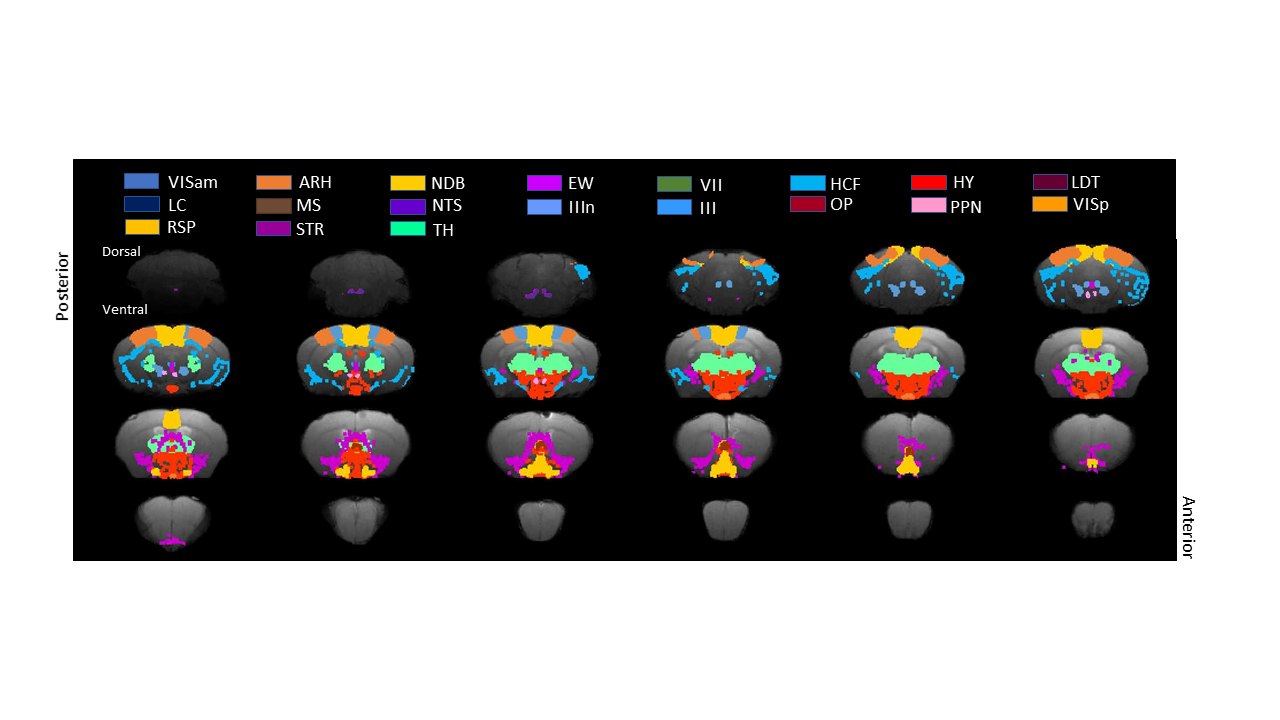
Regions of interest defined on the custom
template including anterio-medial visual
area (VISam), arcuate nucleus of hypothalamus (ARH), nucleus of diagonal band
(NDB), Edinger-Westphal nucleus (EW), facial motor nucleus (VII), hippocampal
formation (HPF), hypothalamus (HY), laterodorsal tegmental nucleus (LDT), locus
ceruleus (LC), medial septal nucleus (MS), nucleus of solitary tract (NTS),
oculomotor nerve (IIIn), oculomotor nucleus (III), Olivery pretectal nucleus
(OP), PPN, primary visual area (VISp), retrosplenal
area (RSP), striatum (STR) and thalamus (TH)
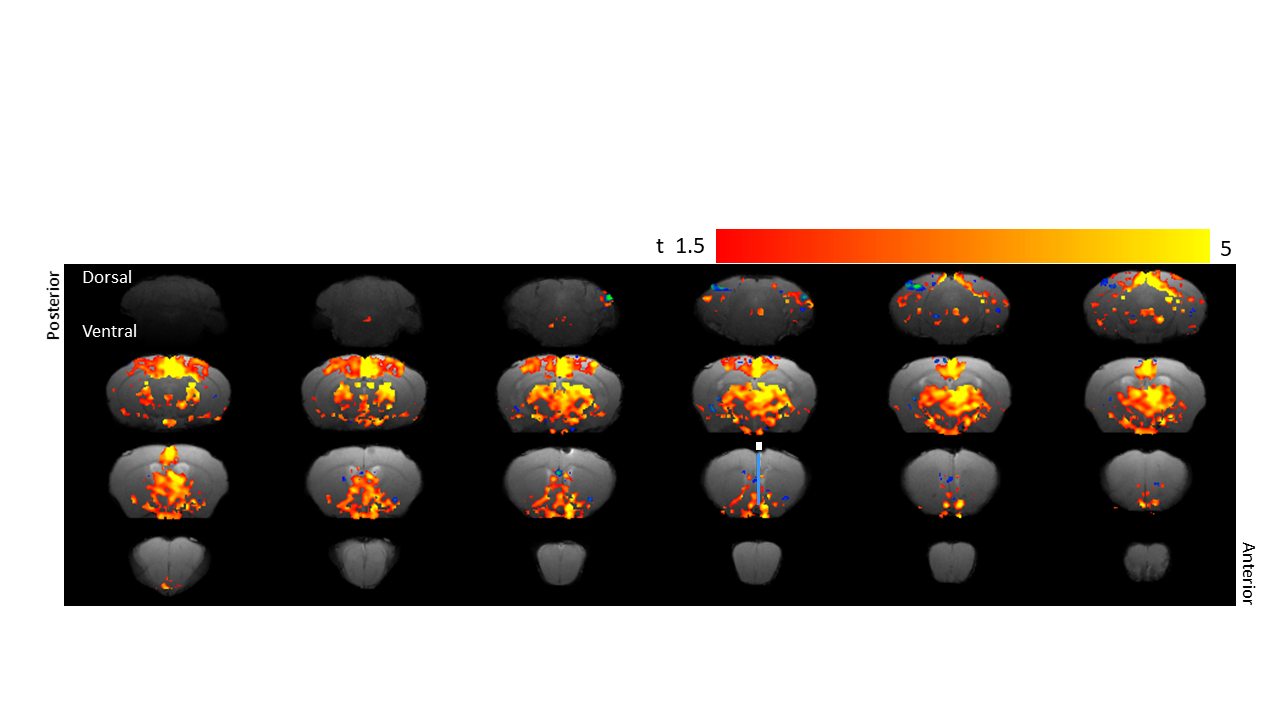
Optogenetic fMRI of the brain showed activated voxels on
stimulation of the basal forebrain across the selected forebrain and midbrain
regions. Highest activation was noted in the OPN, NTS, TH, NDB and MS. Bars in
the 16th slice from the posterior indicates the optical fiber probe
location for the optogenetic stimulation.
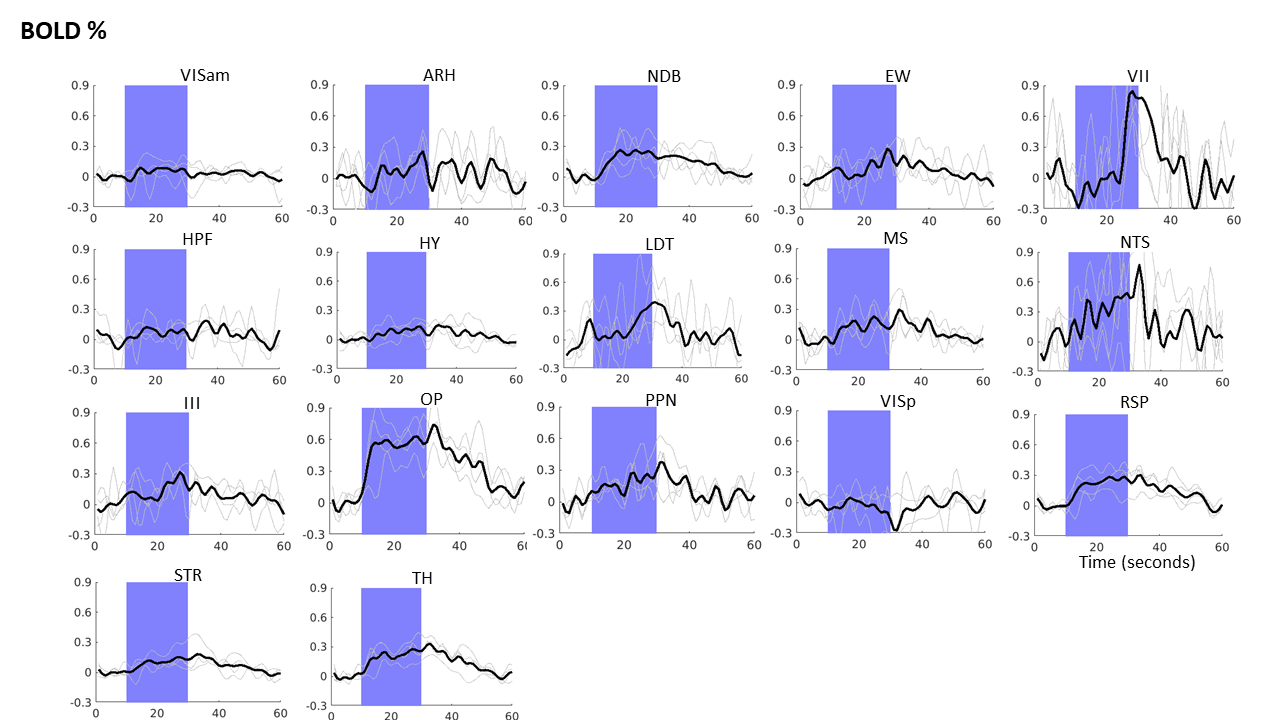
Optogenetic fMRI BOLD time profile shows the percentage
BOLD change across different brain regions on activation of the basal
forebrain. Blue areas indicates stimulation period.
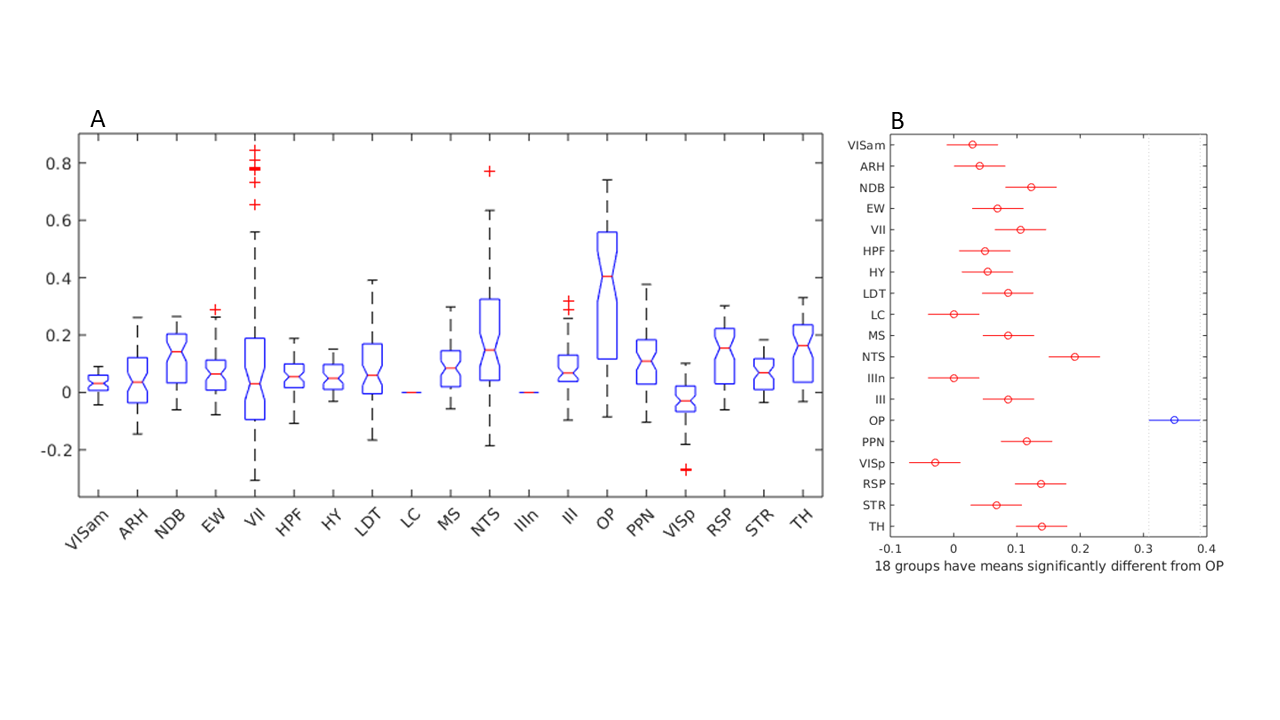
(A)
One-way ANOVA showing group mean differences are significant across the
regions. (B) Multiple comparison test indicating mean value of OP is
significantly different from all the other areas.
DOI: https://doi.org/10.58530/2023/3504