3503
Preliminary evaluation of brain neural networks following chemogenetically-induced activation of the motor cortex in rats1DRCMR, Copenhagen University Hospital Amager and Hvidovre, Hvidovre, Denmark, 2Department of Neurology, Copenhagen University Hospital Bispebjerg and Frederiksberg, Copenhagen, Denmark, 3Department of Clinical Medicine, Faculty of Health and Medical Sciences, University of Copenhagen, Copenhagen, Denmark
Synopsis
Keywords: Brain Connectivity, fMRI (resting state), Chemogenetics
Genetic and viral tools coupled with functional magnetic resonance imaging (fMRI) techniques provide unique opportunities to investigate the functional neural networks in the rodent brain. Chemogenetic tools can be used to selectively activate or inhibit specific neural populations and their projections, and in combination with fMRI, can reveal the underlying mechanisms of brain activity. We present early resting-state and pharmacological fMRI results regarding CNO-mediated activation of the hM3Dq DREADD in the motor cortex of rats.Introduction
Recent studies using Designer Receptors Exclusively Activated by Designer Drugs (DREADDs) technology demonstrated the necessity to use multi-modal approaches to fully understand the underlying neuronal mechanisms (1, 2, 3). Here, we conducted an early resting-state fMRI (rsfMRI) and pharmacological fMRI (phfMRI) in rats to establish and validate an appropriate protocol for the evaluation of brain neural networks changes induced by unilateral chemogenetic activation of the primary motor cortex (M1) using the excitatory Gq-DREADD activated by Clozapine-N-Oxide (CNO).Materials and Methods
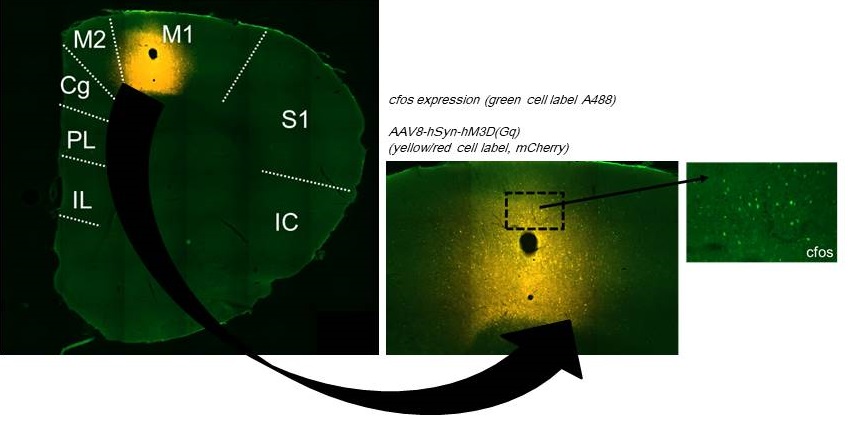
Female Fisher rats (n=7,180 ±20 g) (Charles River, Germany) were used. The expression of DREADD in the right M1 of rats was induced by injecting AAV8-hSyn-hM3D(Gq)-mCherry One month after viral-injections, rats were scanned in a 7T small animal MRI scanner (Bruker, Wissembourg, France) using a volume coil for transmission and a surface coil for reception. Each rat was installed under isoflurane (2-3%) in a dedicated bed equipped with a bite bar and ear bars. Respiration, temperature, heart-rate and partial pressure of O2 (SpO2) were monitored during scans. During MRI, the rats were sedated with a mixture of isoflurane (0.5%) and medetomidine (Med, Dexdomitor, Bolus (0.05 mg/kg) + sub-cutaneous infusion (0.1mg/kg/hr)). Adjustments and structural images (T2 RARE) were performed straight after the start of Med infusion. Functional MRI was initiated 40 minutes after the stabilization of the respiration rate (50-65 bpm). RsfMRI was conducted using a single shot Gradient Echo EPI sequence (TR/TE=1500/11ms; FOV= 30x 30 mm2; Matrix= 64x 64; 600 repetitions) prior to the injection of an intraperitoneal bolus injection of Clozapine-N-Oxide (CNO) (0.5 mg/kg and 1 mg/kg) and 60 minutes after CNO injection. Pharmacological blood oxygen level dependent fMRI (ph-BOLD fMRI) was conducted using the same sequence albeit at a TE=18ms. CNO bolus injection was performed 15 minutes after the start of the continuous acquisition and prolonged for 1 hour after the CNO injection. After the usual preprocessing steps (motion correction, slice time correction, smoothing (1x1x1 mm3), all functional images were coregistered to the structural T2-RARE images of one rat using SPM12. To analyze rsfMRI, an independent component analysis (ICA) investigation was conducted using GIFT toolbox using 20 independent components (4). Group analysis was performed using concatenated data and correlation matrices and connectograms were directly extracted from individual analyzes. Independent components were scaled to z scores and thresholded at |Z|>1.7. 3 rats were euthanized and underwent intracardial perfusion-fixation (4% PFA, 2h post-fixation) to examine viral expression. These cases were further processed for cfos immunohistochemistry.Results and Discussion
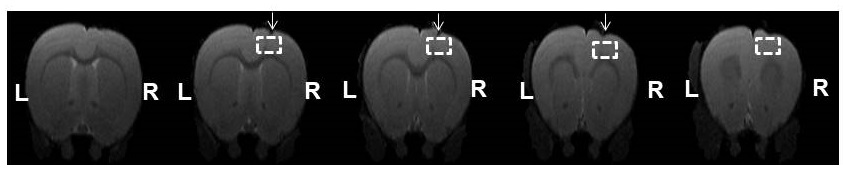
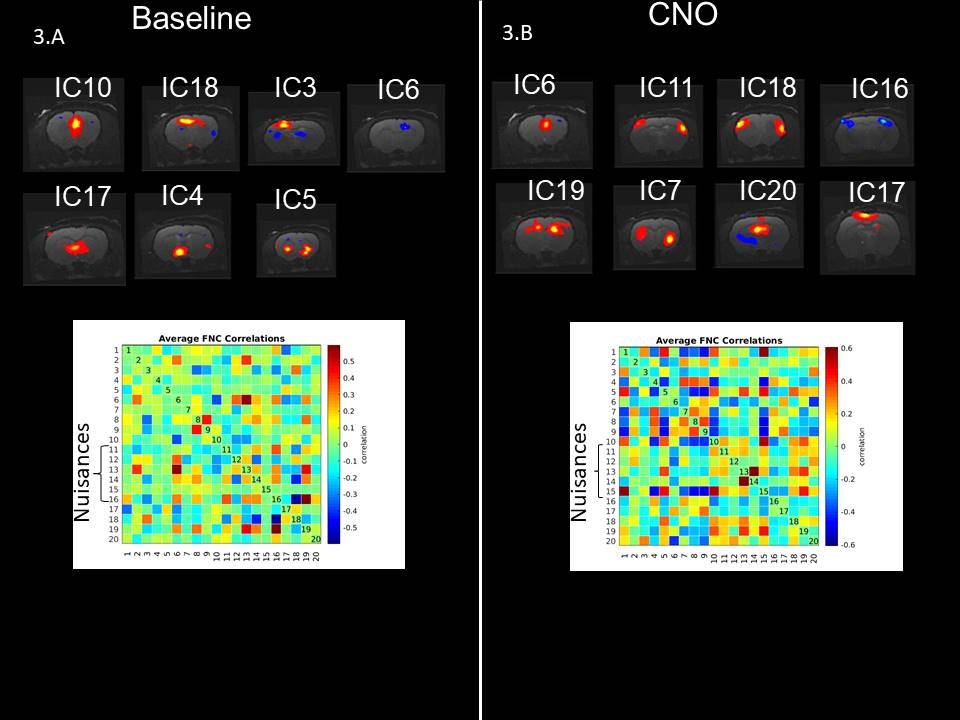
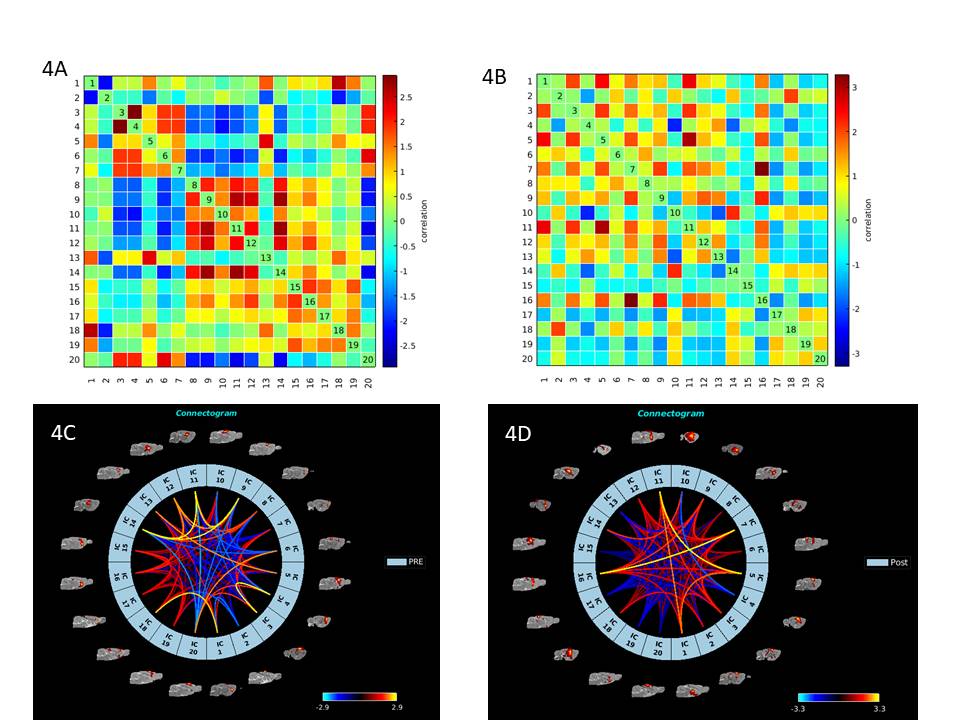
AAV8-hSyn-hM3D(Gq) expression in M1 was demonstrated using Cfos immunohistochemistry (Fig. 1).Viral injections in M1 demonstrated no major susceptibility artefacts as depicted on structural images of the rat brain (Fig 2). RsfMRI results were CNO dose-independent. Fig.3A and 3B compare ICA components obtained at baseline and post CNO respectively in a representative rat. The number of bilateral components post-CNO injection increased compared to baseline (6 versus 2). Fig.3.C and 3.D show the respective correlation matrices demonstrating a change in functional connectivity (fNC) for this rat upon CNO injection. The group fNC correlation matrices (3 rats, Fig.4.A and 4.B) evaluated at baseline and post-CNO confirmed a change in functional connectivity upon CNO injection. The baseline (Fig 4.C) and post-CNO connectograms (Fig 4.D) indicate increased fNC upon CNO activation in line with previous studies (5) with particularly enhanced motor cortical fNC.Conclusion
Our preliminary data indicate that CNO-mediated activation of the hM3Dq DREADD results in a modulation of regulation of excitatory motor cortex neurotransmission. Findings highlight the importance of careful interpretation of experiments involving chemogenetic manipulation.Acknowledgements
This project was funded by the Lundbeck Foundation (Experiment grant, grant nr. R370-2021-402). This project was funded by the Lundbeck Foundation (Experiment grant, grant nr. R370-2021-402). HL has received funding from the European Research Council (ERC) under the European Union’s Horizon 2020 research and innovation programme (grant agreement No 804746).References
1. Nakamura et al. fMRI detects bilateral brain network activation following unilateral chemogenetic activation of direct striatal projection neurons. Neuroimage. 2020; 220:117079. doi: 10.1016/j.neuroimage.2020.117079
2. Roelofs T, Verharen JPH, vanTilborg GAF et al. A novel approach to map induced activation of neuronal networks using chemogenetics and functional neuroimaging in rats: A proof-of-concept study on the mesocorticolimbic system. Neuroimage 2017 Aug 1;156:109-118.doi: 10.1016/j.neuroimage.2017.05.021
3. Giorgi A, Migliarini S, Galbusera A, Maddaloni G, Mereu M, Margiani G, Gritti M, Landi S, Trovato F, Bertozzi SM, Armirotti A, Ratto GM, De Luca MA, Tonini R, Gozzi A, Pasqualetti M. Brain-wide Mapping of Endogenous Serotonergic Transmission via Chemogenetic fMRI. Cell Rep. 2017 Oct 24;21(4):910-918.doi: 10.1016/j.celrep.2017.09.087.
4. Calhoun VD, Liu J, Adali T.A review of group ICA for fMRI data and ICA for joint inference of imaging, genetic, and ERP data. Neuroimage. 2009 Mar;45(1 Suppl):S163-72. doi: 10.1016/j.neuroimage.2008.10.057.
5. Rocchi F, Canella C, Noei S, Gutierrez-Barragan D, Coletta L, Galbusera A, Stuefer A, Vassanelli S, Pasqualetti M, Iurilli G, Panzeri S, Gozzi A. Increased fMRI connectivity upon chemogenetic inhibition of the mouse prefrontal cortex.Nat Commun. 2022 Feb 25;13(1):1056. doi: 10.1038/s41467-022-28591-3.
Figures