3499
The Restoration Ability of Short Nap after Sleep Deprivation on the Brain Cognitive Function: A Dynamic Functional Connectivity Analysis1Department of Radiology, Xijing Hospital, Fourth Military Medical University, Xi'an, China
Synopsis
Keywords: Brain Connectivity, fMRI (resting state)
As we known, consequences caused by Sleep deprivation (SD) are temporary and can be fully reversed with sufficient sleep. However, in many cases, long-duration recovery sleep is not feasible. Inspire by recent study, a short nap may be sufficient for rapid reversal of SD-induced brain function deficits. Based on dynamic functional connectivity and psychomotor vigilance task, our results showed that temporary cognitive impairment cause by SD could reversed to some extent by a nap. Additionally, dominant DFC states differed before and after SD, and their relative proportions affected the degree of cognitive impairment after SD and recovery after a nap.ABSTRACT
INTRODUCTIONSleep deprivation (SD) has various consequences, including sleepiness and impaired cognitive performance [1]. As we known that, these consequences are temporary and can be fully reversed with sufficient sleep. However, in many cases, long-duration recovery sleep is not feasible and rapid recovery from SD may be needed. Recently, one study reported that slow oscillatory transcranial direct current stimulation during a daytime nap improved mild cognitive impairment and helped patients consolidate memories [2], therefore, a short nap may be sufficient for rapid reversal of SD-induced brain function deficits. Dynamic functional connectivity (DFC) can reveal changes in patterns of brain connectivity, which reliably occur across time and subjects [3,4]. Thus, in this study, DFC analysis was used to evaluate brain network changes among three timepoints (baseline, after 30 hours of SD and a short nap after SD), to evaluate whether a short nap after SD can rapid reversal brain function impairment, and to what extent it can be reversed.
METHOD
Forty-five right-handed healthy subjects were recruited to our study. After selected by exclusion criteria and data pre-processing, data from thirty-eight subjects were finally used. All subjects underwent a resting state functional MRI (fMRI) scan at baseline (before SD or RW), after 30 hours SD and a short nap after SD, following by a psychomotor vigilance task (PVT). Pre-processed fMRI data were first decomposed into 100 independent components (ICs) using group independent component analysis, which were integrated in to seven resting state networks (RSN) [3]. A sliding window-based DFC method was used to calculate the DFC matrices [5]. K-means algorithm was used to cluster DFC matrices into 4 DFC states. The DFC metrics, fraction rate (proportion) and transition time [6], were calculated and PVT metrics, mean, middle, minimal, maximum response time and lapse time were recorded. Repeated-measures one-way analysis of variance (RM-ANOVA) was used to compare these metrics among three timepoints. Post-hoc T test (Bonferroni-corrected) was performed if the RM-ANOVA was statistically significant. Pearson correlation was used to assess the relationships between DFC and PVT metrics. The threshold for statistical significance was set at p < 0.05.
RESULT
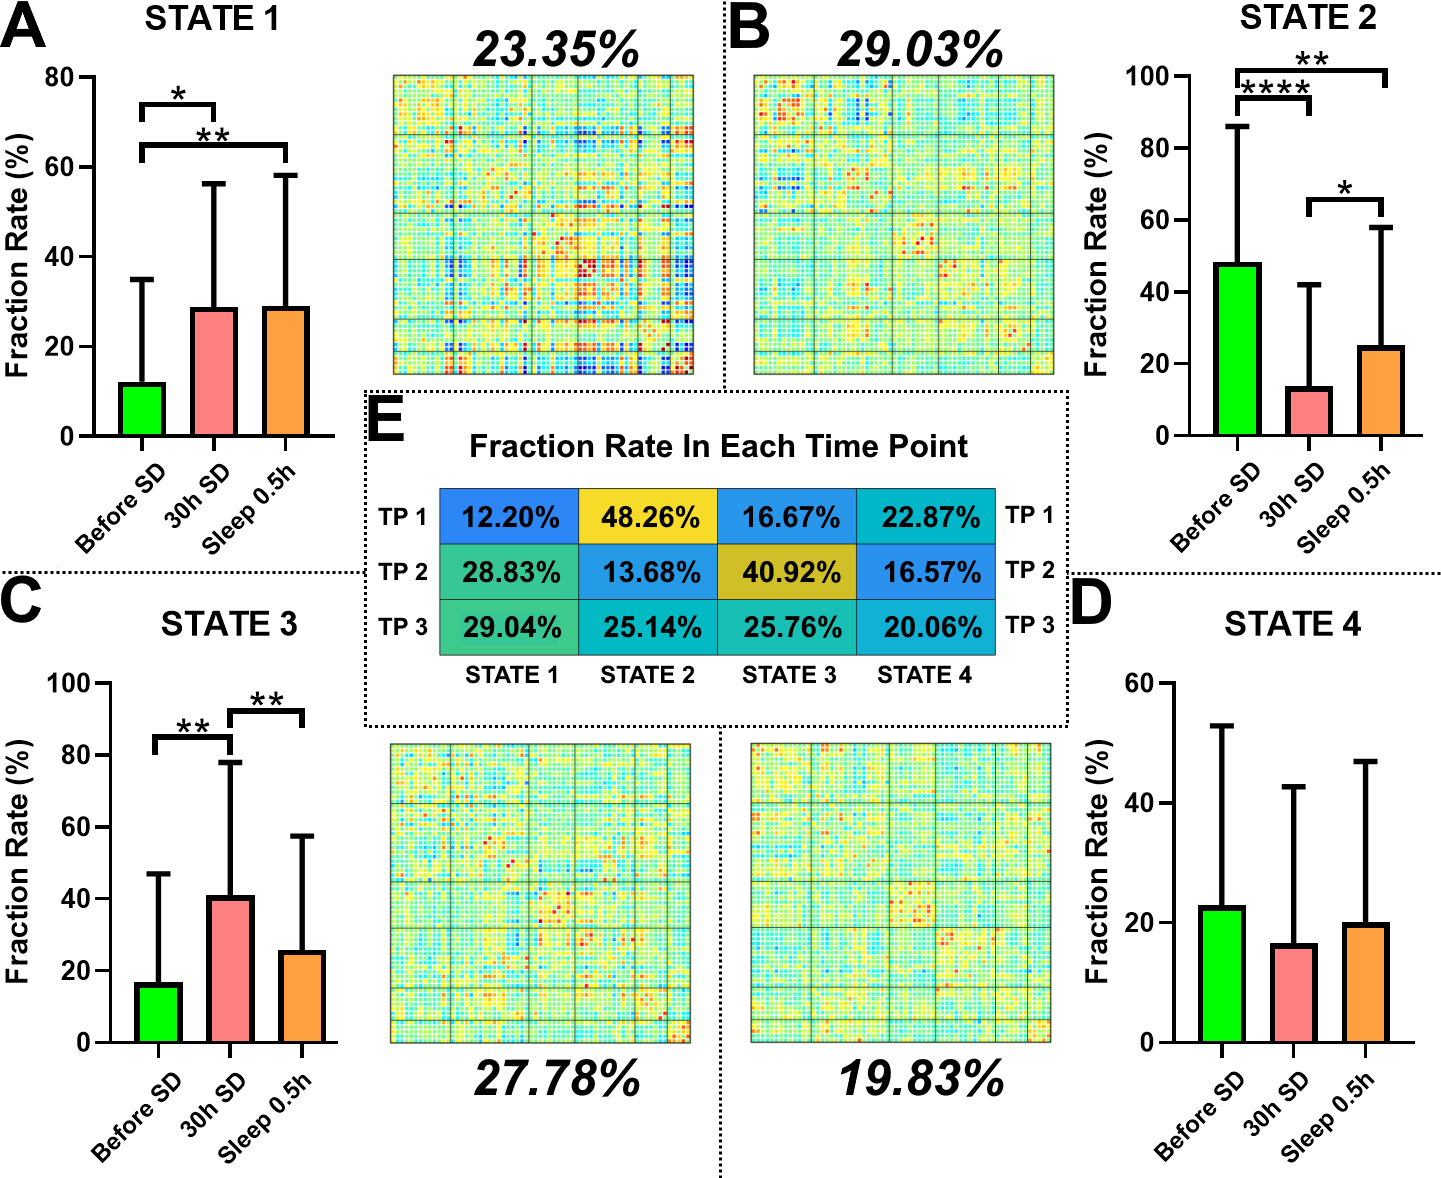
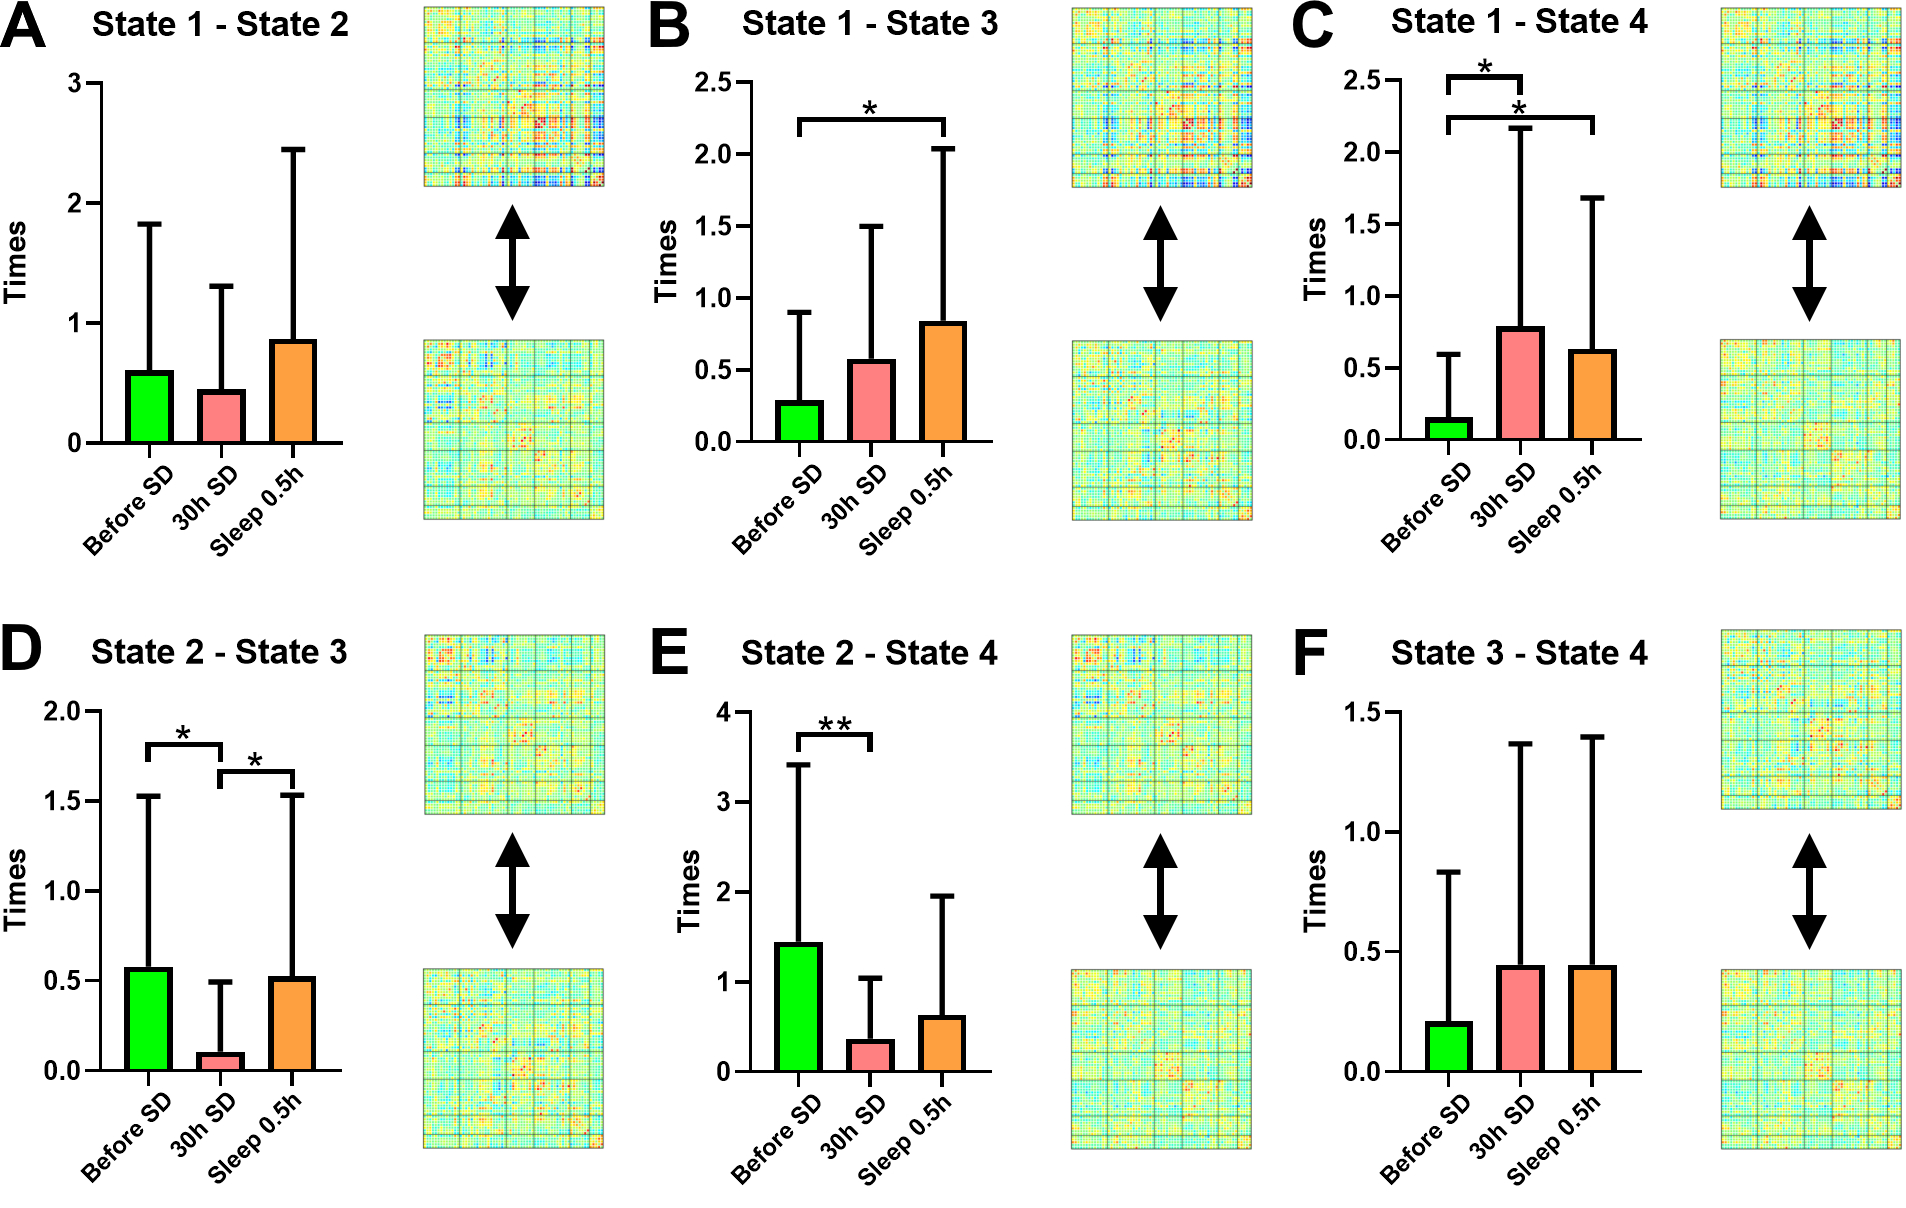
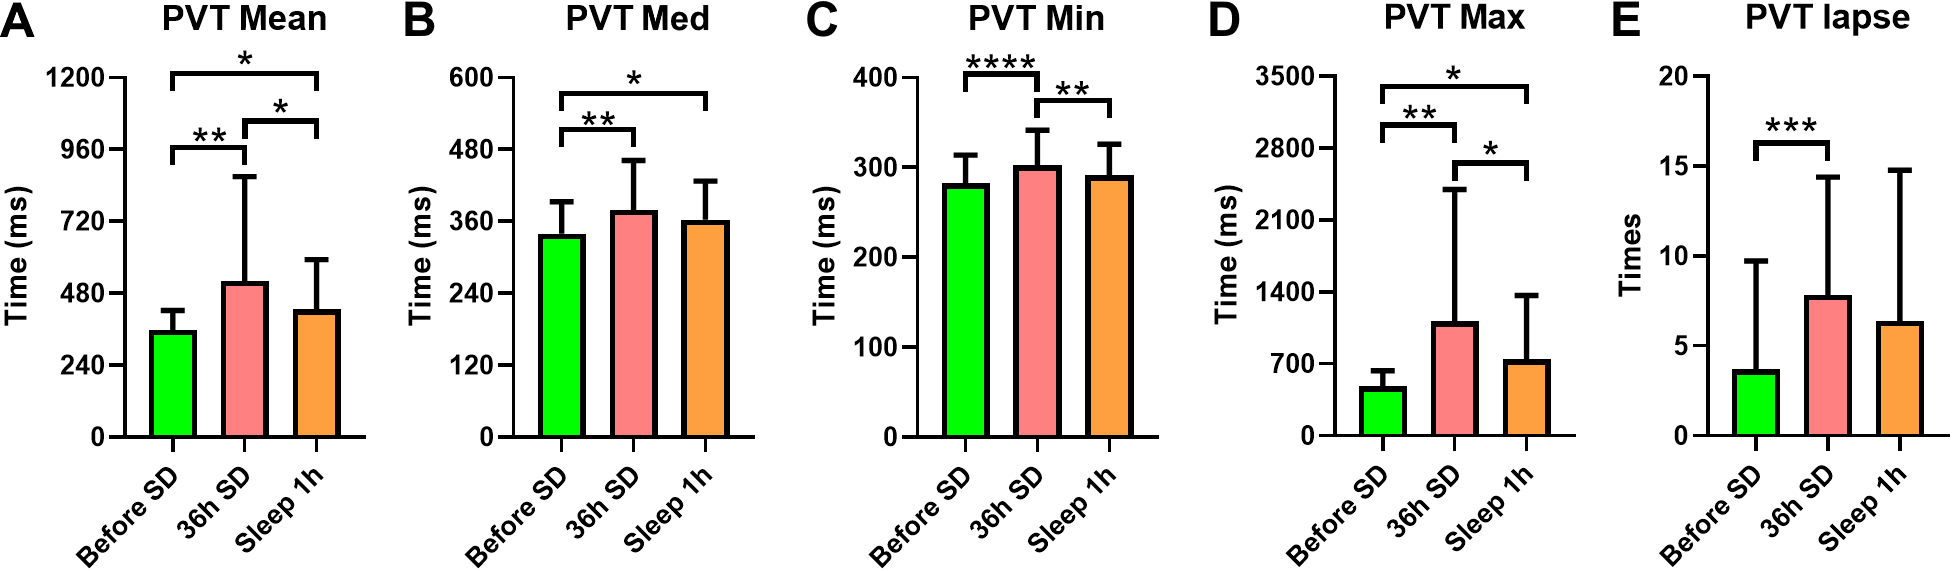
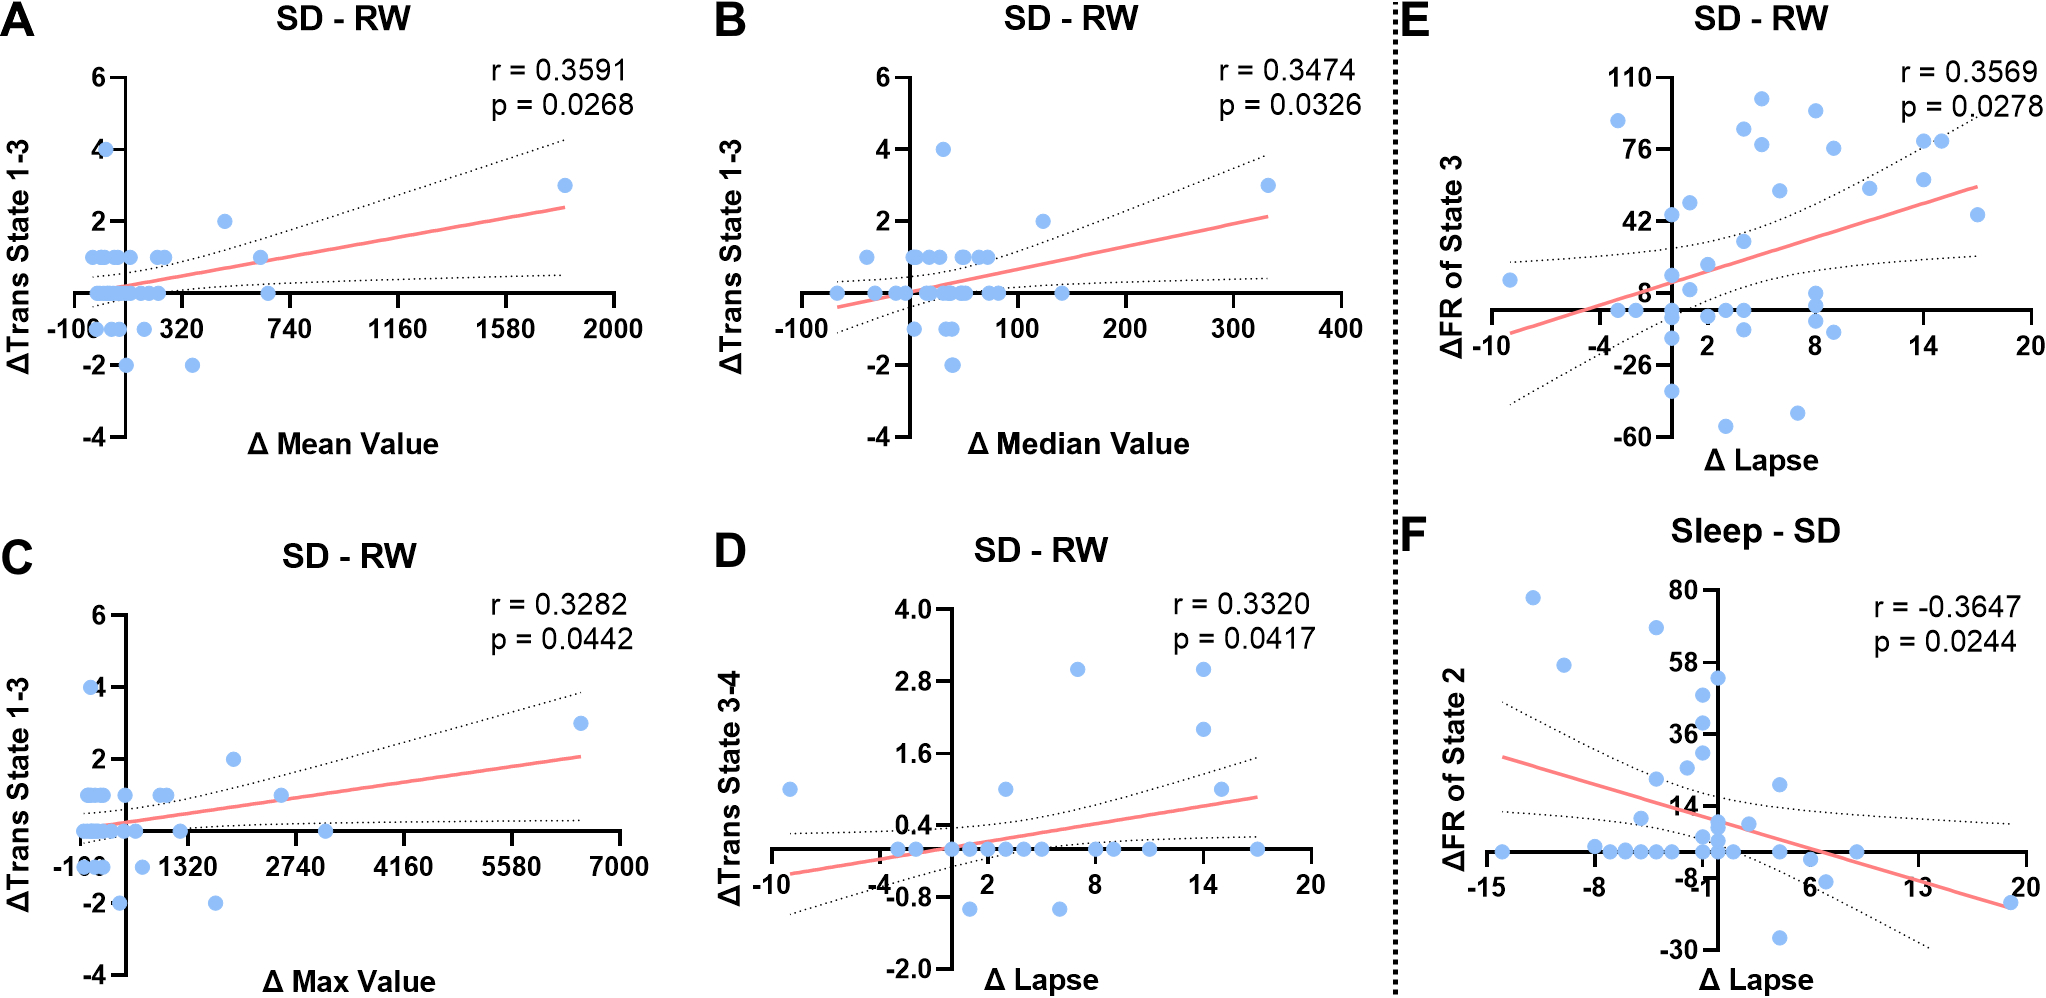
Before SD, states 2–4 were the dominant DFC states, with states 2 and 1 accounting for 48.26% and 12.20% of the total DFC, respectively. After 30 hours of SD, the proportions of states 1 and 3 had significantly increased; state 3 reached its highest proportion. After a short nap, the proportion of state 2 had significantly increased, and that of state 3 had significantly decreased (Fig1). The transition time between states 1 and 4 before SD was significantly lower than for the other two timepoints. The transition time between states 1 and 3 before SD was significantly lower than that after a short nap. The transition time between states 2 and 3 after 30 hours of SD was significantly lower than that between the other two timepoints. Finally, the transition time between states 2 and 4 before SD was significantly larger than that after 30 hours of SD (Fig2). After SD, all PVT indices were significantly increased. After a nap, the mean, minimum and maximum PVT response times were significantly decreased (Fig3). The transition time between states 1 and 3 was positively correlated with the changes in mean, median and maximum PVT response times. The change in transition time between states 3 and 4 positively correlated with the change in PVT lapse time. Finally, the change in proportion of state 3 positively correlated with the change in PVT lapse time after SD, while the change in proportion of state 2 negatively correlated with the change in PVT response time after a nap (Fig4).
DISCUSSION
Before SD, the state 2 was dominant. However, after SD, the proportion of state 2 was significantly decreased, and state 3 became dominant. These results suggested that the timepoints before and after SD may differ in terms of dominant stationary state. Sleep deprivation can lead to temporary cognitive impairment [7]. After SD, the proportion of state 1, 2, and 3 had significant changes, as well as the transitions between them. Also, all PVT metrics were significant increase, and the changes of some DFC metrics significantly correlated with some PVT metrics. But after a short nap, the proportion of state 2 and state 3 and the transitions between them trends to change toward before SD, as well as some PVT metrics. These results may indicate that after a nap, although subjects still needed to fend off sleep frequently, the brain state was returning to baseline. Interestingly, the fraction rate changes of state 3 and state 2 was positively and negatively correlated with the PVT lapse time changes of SD-RW and nap-SD, respectively. These results may suggest that the proportion of state 3 may be key to the cognitive function impairment that occurs after SD, while the proportion of state 2 to the recovery that occurs after a short nap.
CONCLUSION
SD led to temporary cognitive impairment, which was reversed to some extent by a nap. Additionally, dominant DFC states differed before and after SD, and their relative proportions affected the degree of cognitive impairment after SD and recovery after a nap.
Acknowledgements
we thank all those who have helped us during designing and writing this abstract.References
[1] Geiker NRW, Astrup A, Hjorth MF, Sjödin A, Pijls L, Markus CR. Does stress influence sleep patterns, food intake, weight gain, abdominal obesity and weight loss interventions and vice versa? Obes. Rev, 2018, 19:81–97. doi: 10.1111/obr.12603.
[2] Ladenbauer J, Ladenbauer J, Külzow N et al. Promoting Sleep Oscillations and Their Functional Coupling by Transcranial Stimulation Enhances Memory Consolidation in Mild Cognitive Impairment. J Neurosci, 2017, 37(30): 7111-7124. doi: 10.1523/JNEUROSCI.0260-17.2017.
[3] Allen EA, Damaraju E, Plis SM, Erhardt EB, Eichele T, Calhoun VD. Tracking whole-brain connectivity dynamics in the resting state. Cereb Cortex, 2014, 24(3):663-76. doi: 10.1093/cercor/bhs352.
[4] Li J, Zhang D, Liang A et al. High transition frequencies of dynamic functional connectivity states in the creative brain. Sci Rep, 2017, 7: 46072. doi: 10.1038/srep46072.
[5] Varoquaux G, Gramfort A, Poline JB, Thirion B. Brain covariance selection: better individual functional connectivity models using population prior. Advances in neural information processing systems. Vancouver, Canada, 2010.
[6] Smith SM, Miller KL, Salimi-Khorshidi G et al. Network modelling methods for FMRI. Neuroimage, 2011 54:875-891. doi: 10.1016/j.neuroimage.2010.08.063.
[7] Lloyd S (1982). Least squares quantization in PCM. IEEE Trans Inform Theory 28:129-137.
[8] Fiorenzato E, Strafella AP, Kim J et al. Dynamic functional connectivity changes associated with dementia in Parkinson's disease. Brain, 2019, 142(9): 2860-2872. doi: 10.1093/brain/awz192.
[9] Csipo T, Lipecz A, Owens C et al. Sleep deprivation impairs cognitive performance, alters task-associated cerebral blood flow and decreases cortical neurovascular coupling-related hemodynamic responses. Sci Rep, 2021, 11(1): 20994. doi: 10.1038/s41598-021-00188-8.
Figures