3495
Effect of acute severe hypoxic environment on brain network connectivity1Radiology, Mayo Clinic, Rochester, MN, United States, 2Anesthesiology and Perioperative Medicine, Mayo Clinic, Rochester, MN, United States, 3Physiology and Biomedical Engineering, Mayo Clinic, Rochester, MN, United States, 4Psychiatry and Psychology, Mayo Clinic, Rochester, MN, United States
Synopsis
Keywords: Brain Connectivity, fMRI, Hypoxia
Acute exposure to a severely low oxygen environment (<10%) can cause temporary deterioration of cognitive performance. To better understand the mechanism of the hypoxic-related temporary cognitive impairment in the human brain, we examined functional connectivity changes in brain networks during acute severe hypoxia while subjects performed a cognitive task. The acute severe hypoxic environment temporarily increases functional connectivity among salience (SN), default mode (DMN), executive central (ECN), sensorimotor, and visuospatial networks. We observed that increased connectivity of SN to DMN and to ECN during acute severe hypoxia is related with the behavioral cognitive deterioration.INTRODUCTION
Severe hypoxia, accompanied by an immediate drop in the blood oxygenation of both arteries and veins, is known to cause cognitive performance deterioration as well as extreme physiological perturbations [1-7]. However, little is known regarding how brain functional connectivity changes in response to acute severe hypoxia [8,9]. We examined functional connectivity in well-known human brain networks during acute severe hypoxia while subjects performed a cognitive task.To extract neuroactivity-related spontaneous BOLD signal from the bulk BOLD signal drop caused by reduced blood oxygenation with hypoxia stimulation, ANATICOR regression [10] derived from a local white matter was used in the preprocessing pipeline. Timeframe-wise functional connectivity with functional ROIs defined in the previous study [11] was examined to observe brain network reorganization with the acute severe hypoxia.
METHODS
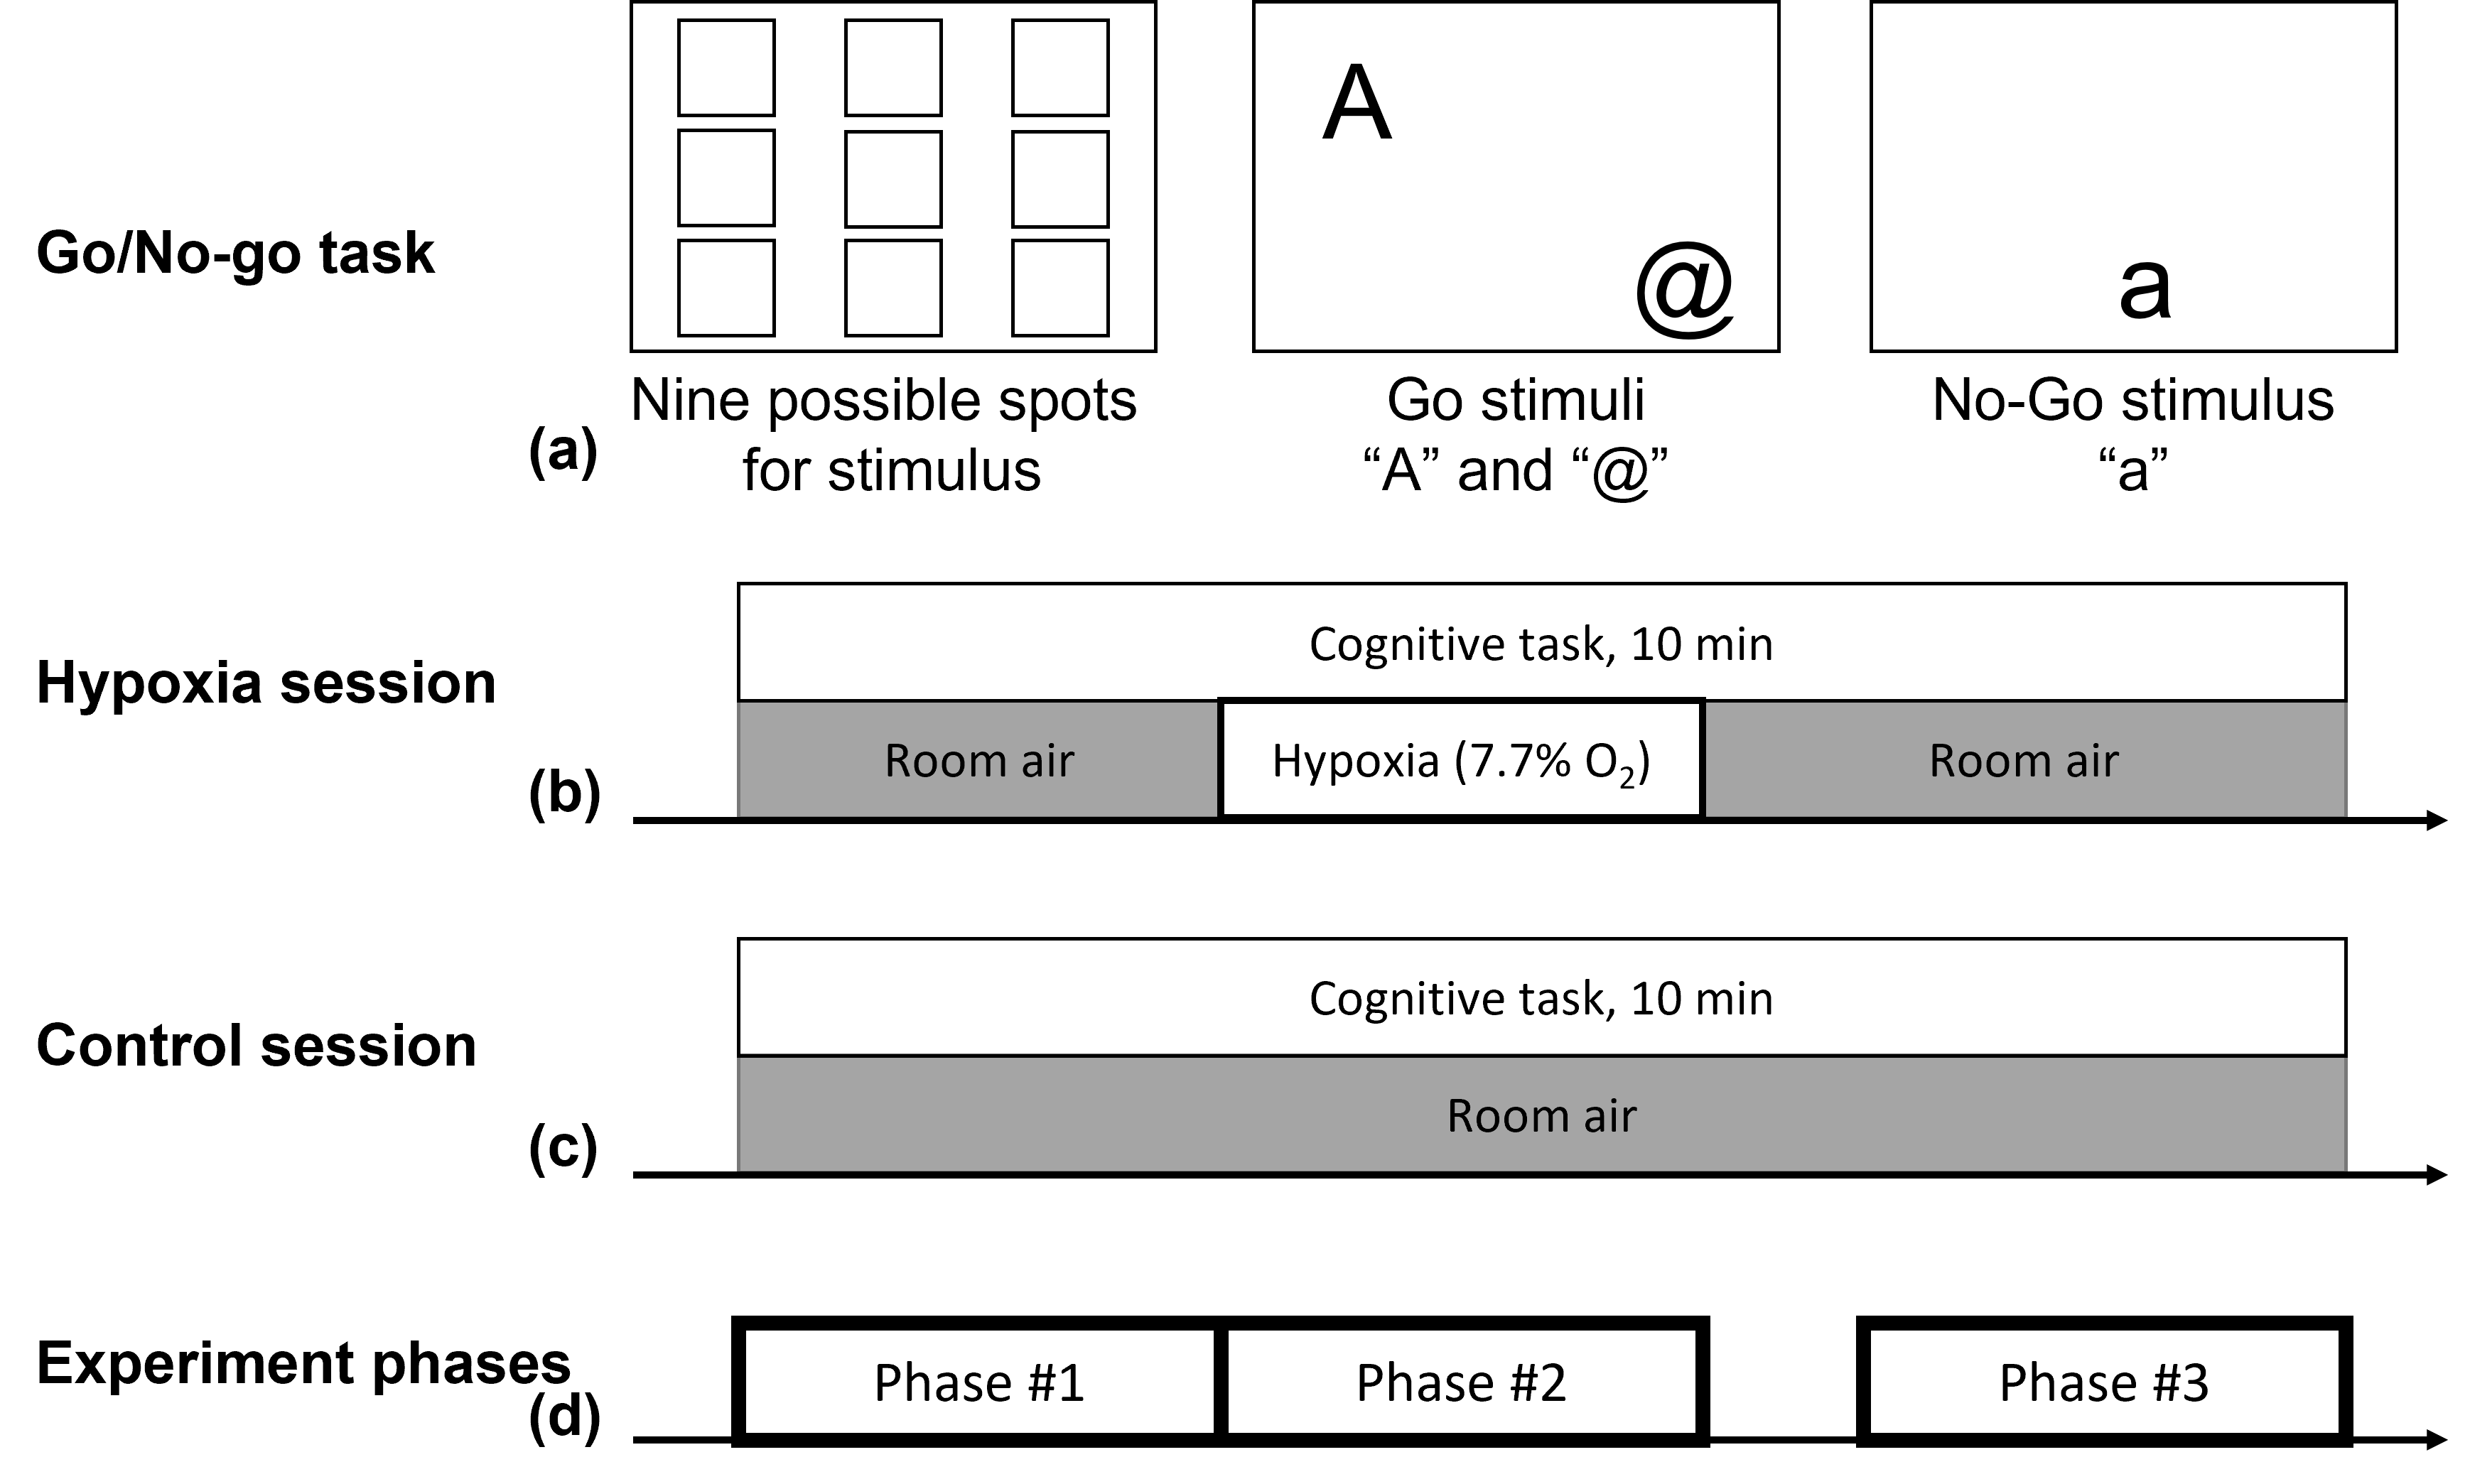
Total of 11 young healthy participants (6M/5F, 26.5 ± 4.4 years) were imaged using a high performance Compact 3T (C3T) MRI scanner [12], under an IRB-approved protocol with written informed consent. Each subject participated in two sessions of 10-minute BOLD fMRI measurement while performing Go/No-go task (identical session-to-session) [8]. One session included the hypoxic stimulation with a normobaric hypoxic gas mixture containing 7.7% O2 balanced with N2, approximating atmospheric conditions at 8000 m elevation. The experiment protocols are summarized in Figure 1.For fMRI acquisition, GRE-EPI imaging (TR 2 s, TE 30 ms, resolution 2.5 mm isotropic, 3 MB, 5/8 partial Fourier) were acquired with a 32-channel head coil (Nova Medical, MA, USA) on the C3T scanner [12, 13]. Also, a 3D MPRAGE sequence was acquired for T1-weighted anatomical imaging.
fMRI datasets were preprocessed including RETROICOR [14], spatial normalization to MNI template, motion (rigid-body displacement and their first derivative), local-white-matter (ANATICOR [10]) and Legendre polynomial regressions to mitigate artifacts arising from cardiac and respiratory fluctuations, motions and hypoxia/system-induced BOLD signal drift, which were performed with AFNI software package [15] and FreeSurfer [16].
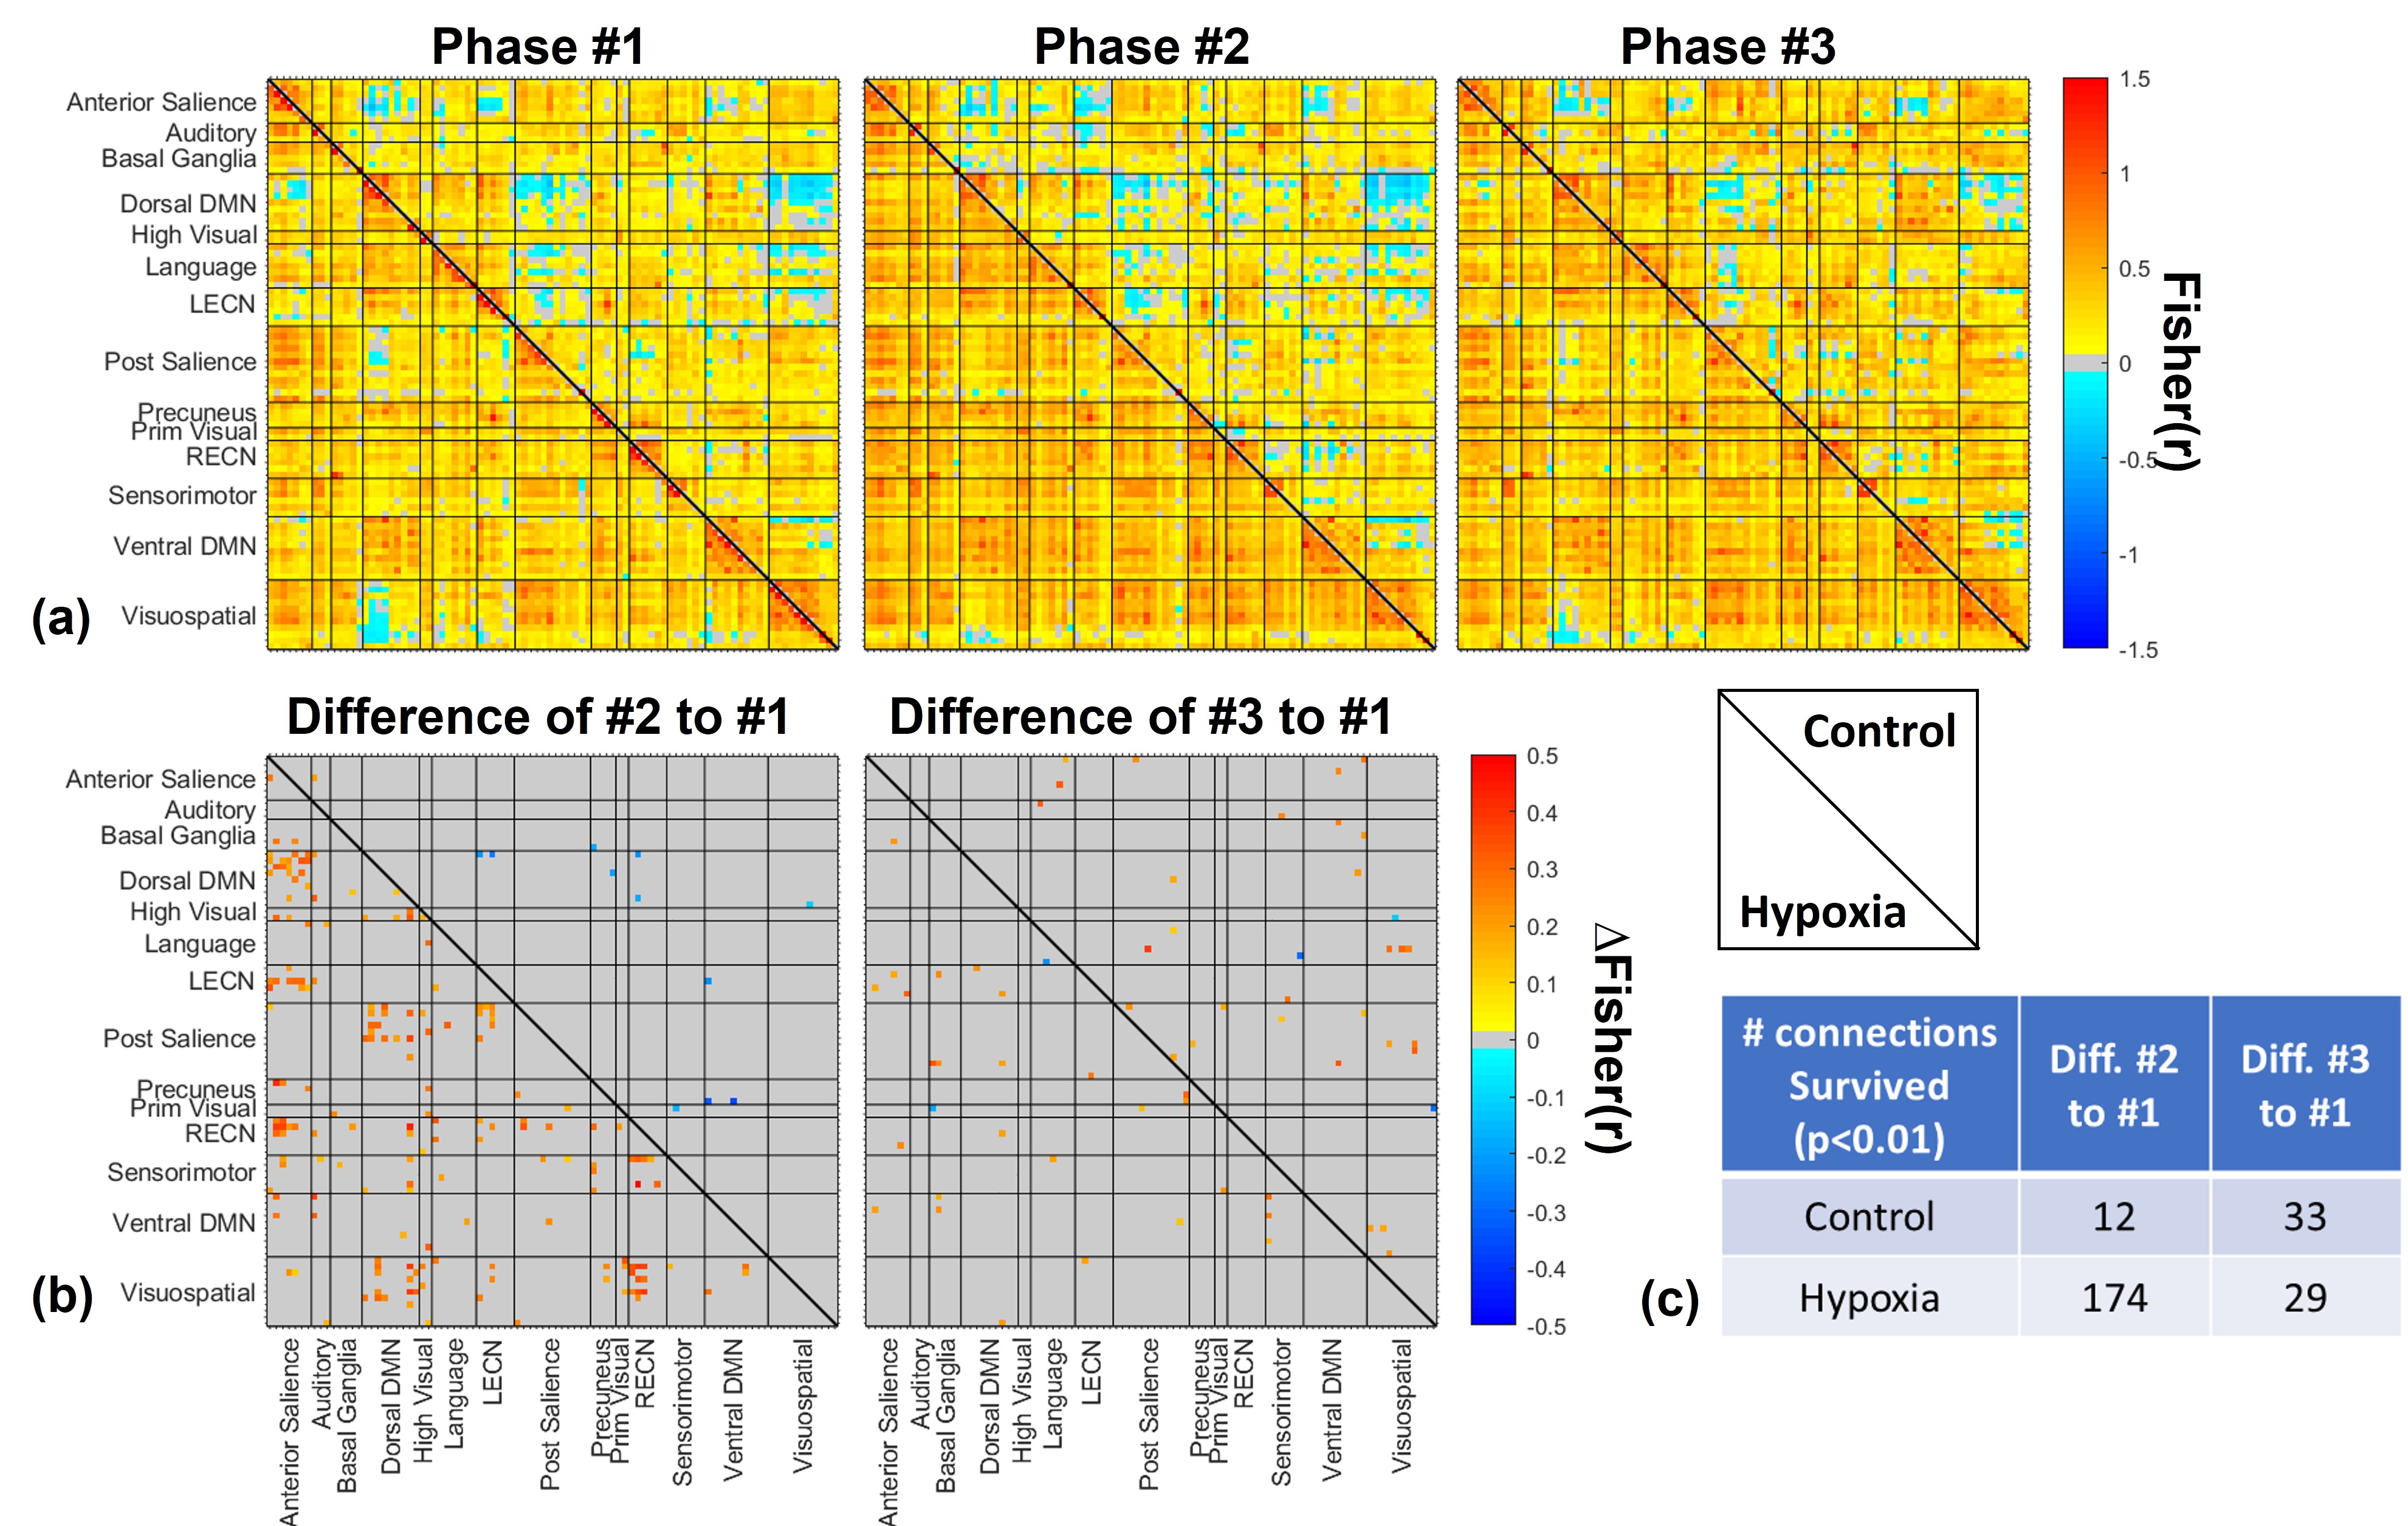
To examine functional connectivity in the three phases as depicted in Figure 1(d), functional connectivity of each phase was evaluated based on 14 brain networks consisting of 90 functional regions of interest (ROI) [11]. The preprocessed fMRI datasets (i.e., residual BOLD signal time course) were combined for each ROI in each phase of a subject and then Pearson correlations with Fisher z-transformation (i.e., Fisher(r)) among ROIs were calculated for each phase of each subject. To examine hypoxia effect, Group differences of ‘Phase #2-#1’ and ‘Phase #3-#1’ in functional connectivity were assessed and compared with those obtained in the control scan.
RESULTS
Since the data from two participants were rejected due to excessive motion during fMRI sessions, the data from nine participants (eight right-handed/one left-handed) were used for further analysis.Figure 2 shows the functional connectivity matrices and the difference between phases. Among 4005 connections originated from 90 ROIs, 174 connections (approximately 4.3% among 4005 connections) were significantly changed by hypoxia stimulation in the difference of ‘Phase #2-#1’, while at most 33 connections were varied in other comparisons.
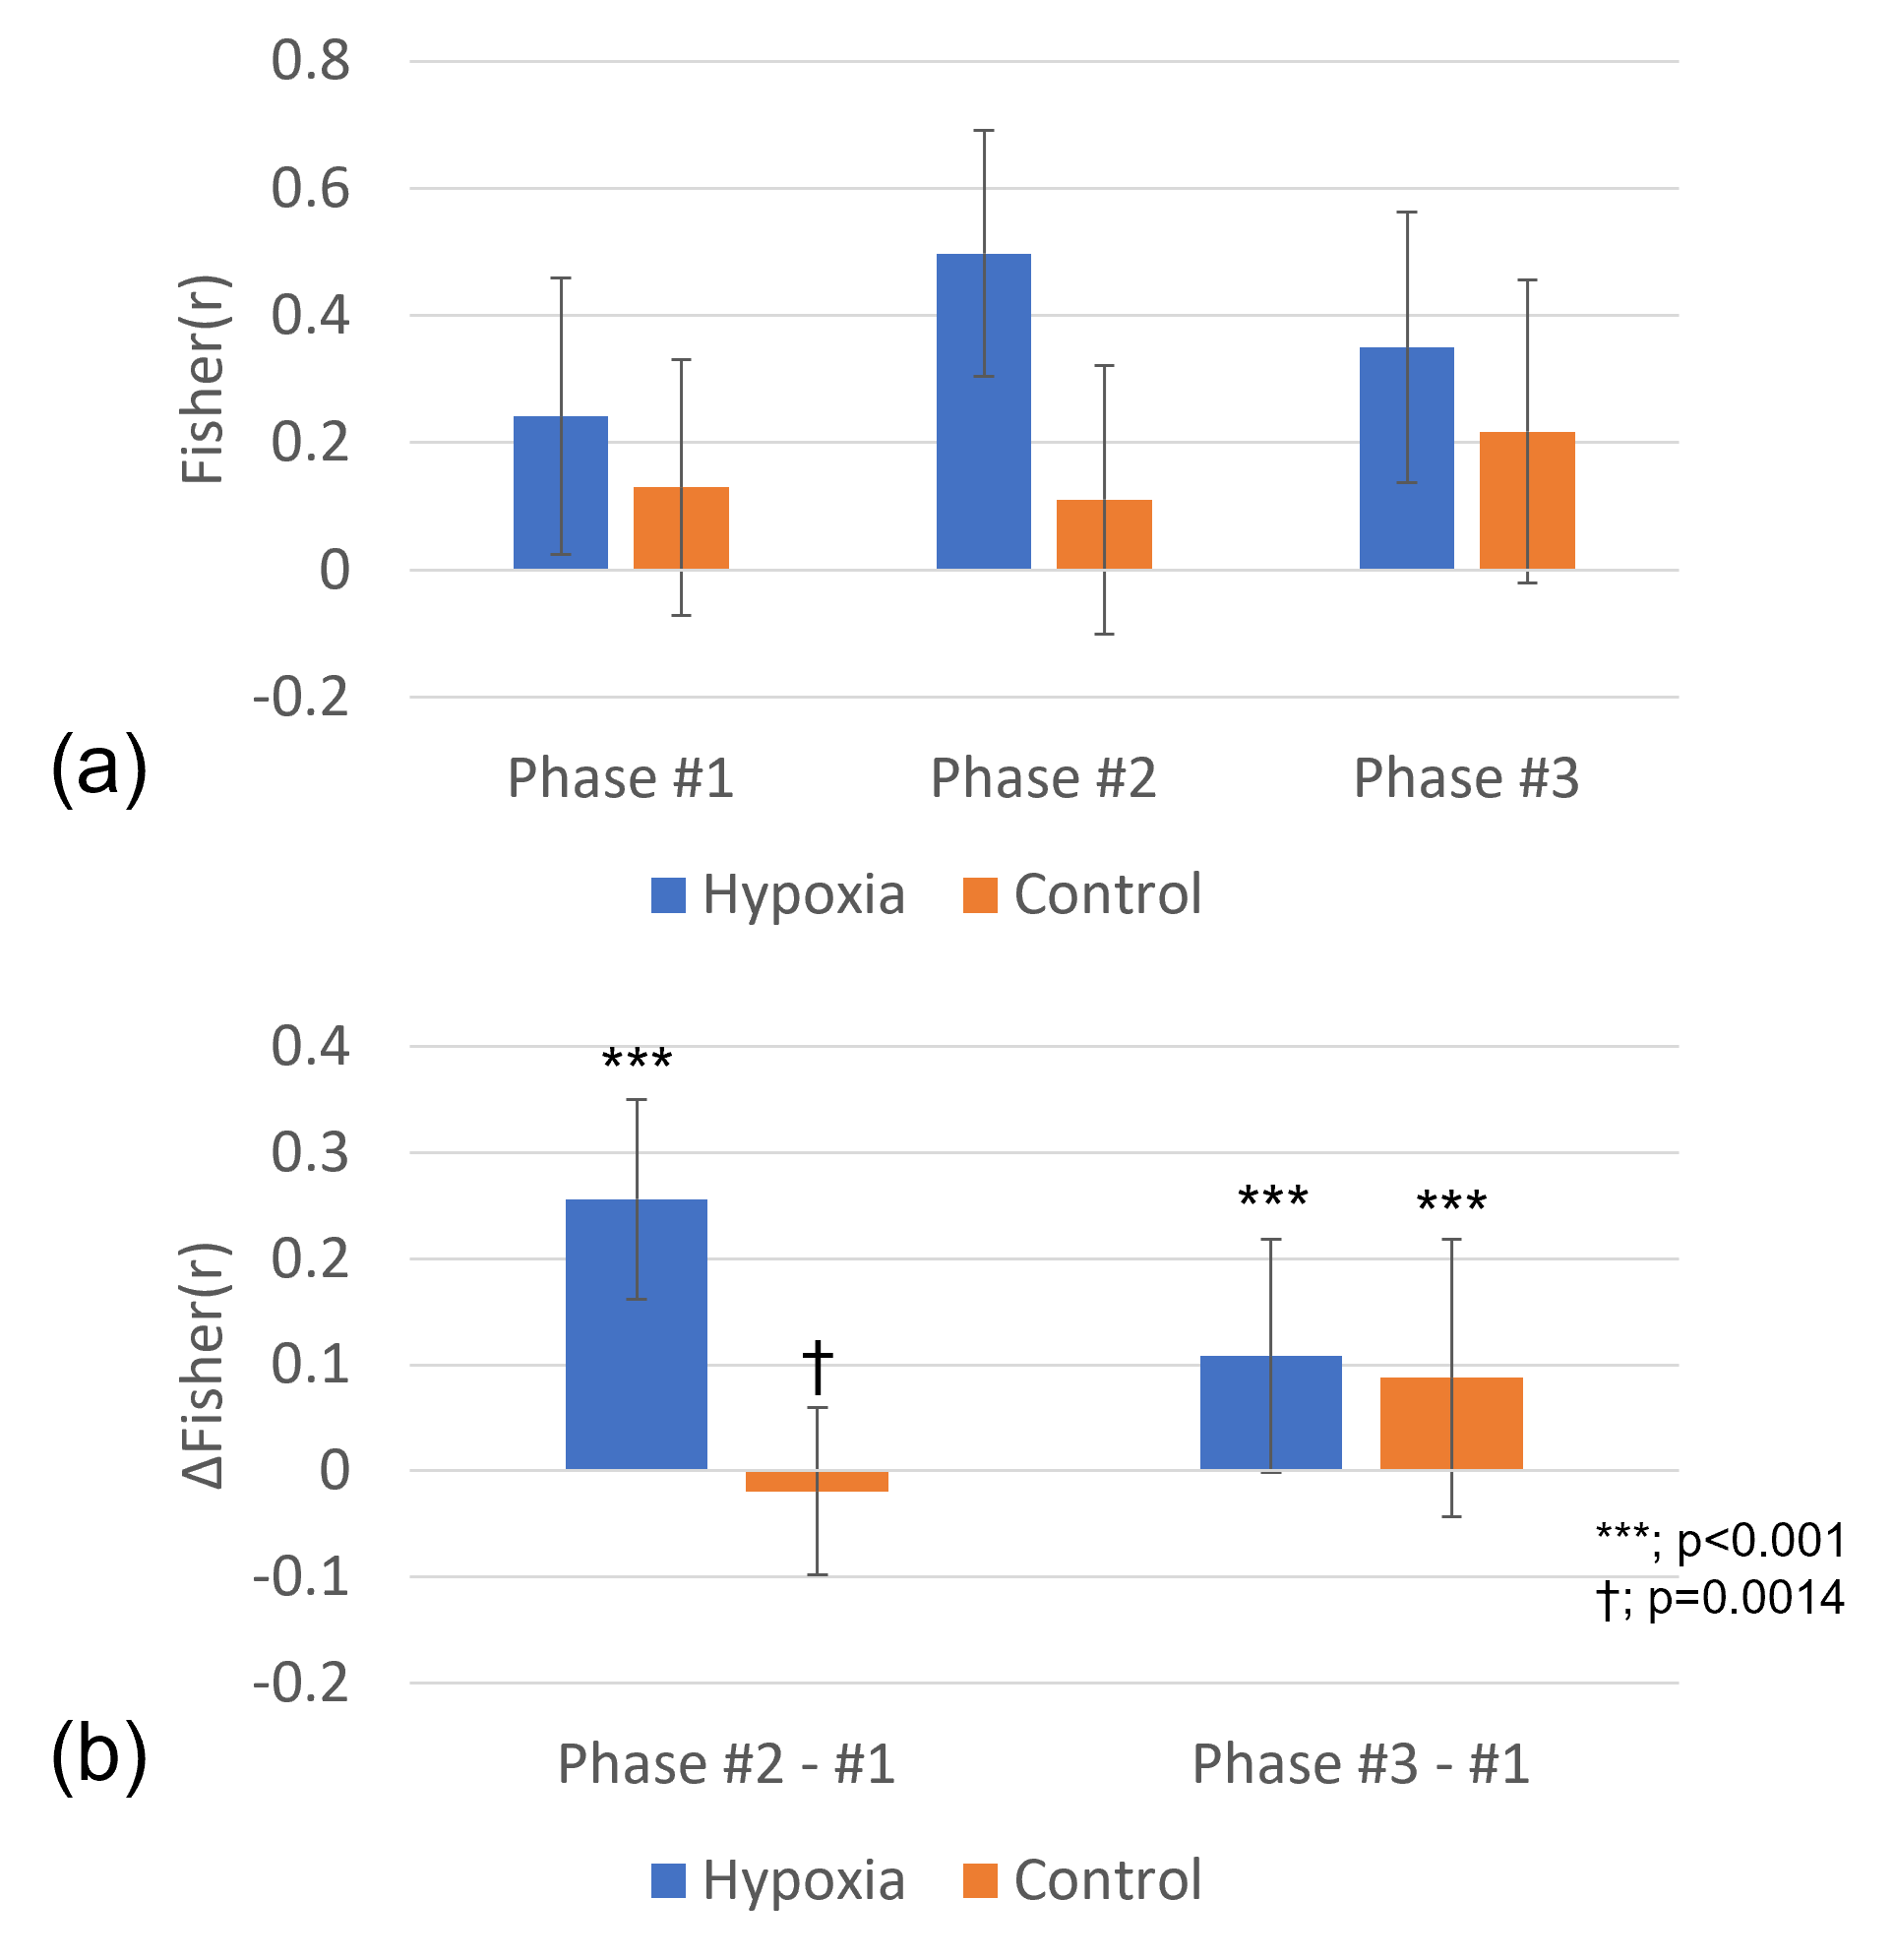
In Figure 3, the average of the 174 functional connections of interest, selected at lower triangle of the ‘Phase #2-#1’ matrix in Figure 2(b), was calculated. The functional connections of interest in the ‘Phase #2-#1’ difference remarkably increased by 0.256 (±0.094) from 0.241 (±0.217) to 0.498 (±0.194) during hypoxia, while a smaller change of -0.019 (±0.079) was observed in the control scan. In the ‘Phase #3-#1’ difference, the functional connections of interest in Phase #3 slightly increased compared to the Phase #1 for both scans.
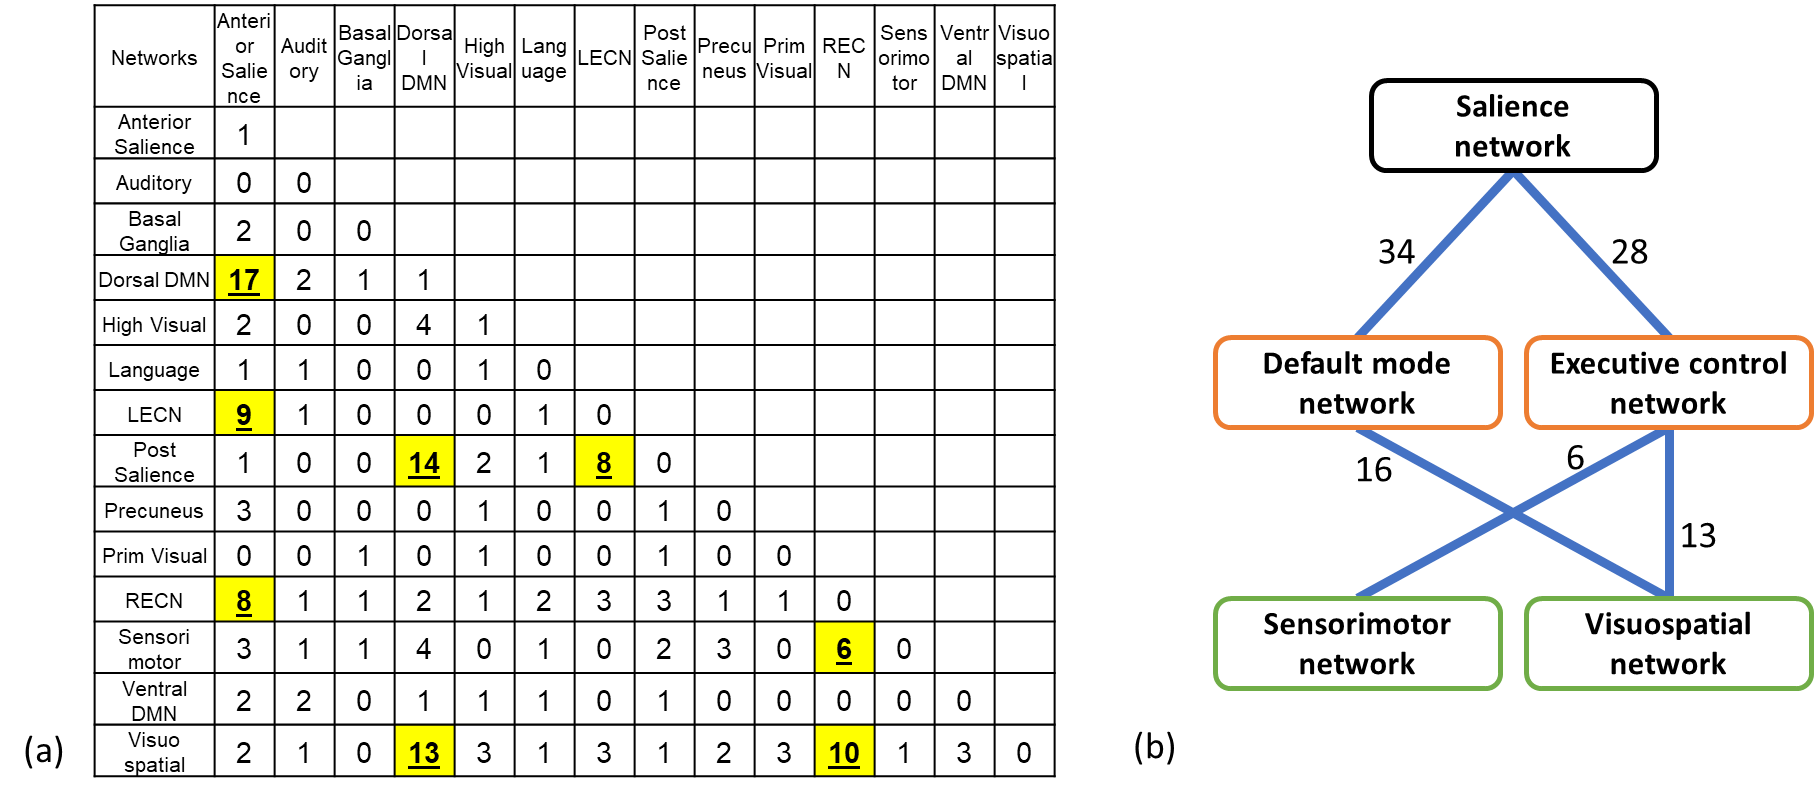
In a view of brain-network level connection in Figure 4(a), most of the more-connected connections by hypoxia stimulation were placed on “inter-network” connection among salience, default mode, and executive central, sensorimotor, and visuospatial networks (namely, SN, DMN, ECN, SMN, and VSN, respectively). Figure 4(b) showed simplified diagram for the numbers of the inter-network connections among the major five networks. However, few intra-network connections were changed.
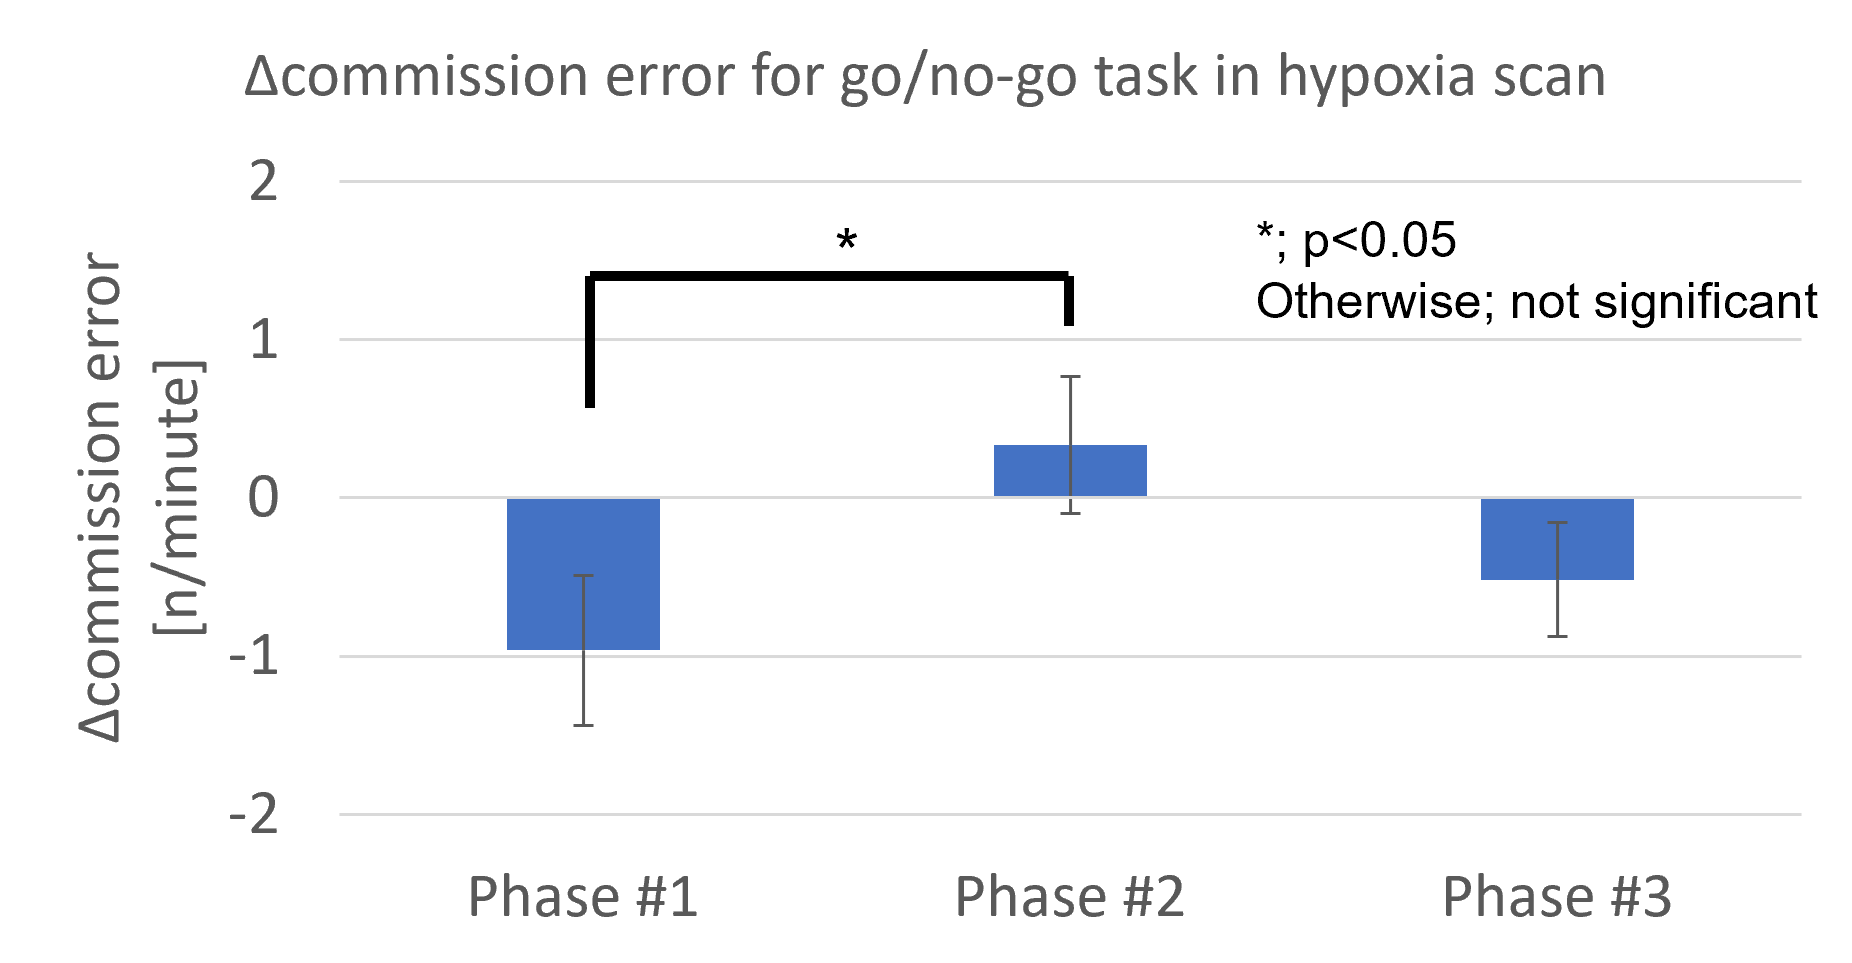
The behavioral results in Figure 5 verified that the hypoxia stimulation used in this study caused the temporary cognitive deterioration.
DISCUSSION and CONCLUSION
We attempted to understand the temporary cognitive deterioration resulting from an acute severe hypoxic environment in terms of brain functional connectivity. Hypoxia-induced change in functional connectivity was assessed with functional ROIs to compose well-known brain networks. The hypoxic stimulation would temporarily cause brain network reorganization accompanied by cognitive deterioration. Interestingly, we observed functional connectivity increased by hypoxic stimulation rather than decreased.Our results showed that SN connected more with both DMN and ECN by hypoxia stimulation. It has been reported that SN connected more with both DMN and ECN and that functional connectivity within DMN or ECN changed as a task load elevated with more difficult working memory tasks [17]. Since the task load did not change in our protocol, it is inferred that the increased connectivity with SN occurred because of temporary reduction in available cognitive resource by hypoxia, rather than increase in cognitive demands. Since intra-network connections in DMN and ECN did not change with hypoxia, it was expected as there was no change in task load as observed in the previous study [17].
Acknowledgements
This material is based upon work supported by the Office of Naval Research under Contract No. N00014-18-D-7001 and Grant No. N00014-16-1-3173. Any opinions, findings and conclusions or recommendations expressed in this material are those of the author(s) and do not necessarily reflect the views of the Office of Naval Research.References
1. Binks, A.P., et al., Gray matter blood flow change is unevenly distributed during moderate isocapnic hypoxia in humans. J Appl Physiol (1985), 2008. 104(1): p. 212-7.
2. Lawley, J.S., et al., Unexpected reductions in regional cerebral perfusion during prolonged hypoxia. J Physiol, 2017. 595(3): p. 935-947.
3. Harris, A.D., et al., Cerebral blood flow response to acute hypoxic hypoxia. NMR Biomed, 2013. 26(12): p. 1844-52.
4. Sicard, K.M. and T.Q. Duong, Effects of hypoxia, hyperoxia, and hypercapnia on baseline and stimulus-evoked BOLD, CBF, and CMRO2 in spontaneously breathing animals. Neuroimage, 2005. 25(3): p. 850-8.
5. Kang, D., et al. The impact of acute and severe hypoxia observed by pCASL MR brain imaging on Compact 3T MRI scanner. in Annual meeting of the Organization for Human Brain Mapping. 2021.
6. Kang, D., et al. Regional differences in cerebral BOLD signal response induced by severe transient hypoxia. in Annual meeting of the Organization for Human Brain Mapping. 2021.
7. Uchida, K., et al., A Novel Method to Measure Transient Impairments in Cognitive Function During Acute Bouts of Hypoxia. Aerosp Med Hum Perform, 2020. 91(11): p. 839-844.
8. Uchida, K., et al., Relationship between Decreased Oxygenation during Acute Hypoxia and Cognitive Deterioration in Healthy Humans. Faseb Journal, 2020. 34.
9. Buchholtz, Z.A., et al., Young Healthy Humans Demonstrate Reduced Executive Function in Moderate Hypoxia. The FASEB Journal, 2020. 34(S1): p. 1-1.
10. Jo, H.J., et al., Mapping sources of correlation in resting state FMRI, with artifact detection and removal. Neuroimage, 2010. 52(2): p. 571-82.
11. Shirer, W.R., et al., Decoding subject-driven cognitive states with whole-brain connectivity patterns. Cereb Cortex, 2012. 22(1): p. 158-65.
12. Foo, T.K.F., et al., Lightweight, compact, and high-performance 3T MR system for imaging the brain and extremities. Magn Reson Med, 2018. 80(5): p. 2232-2245.
13. Tan, E.T., et al., High slew-rate head-only gradient for improving distortion in echo planar imaging: Preliminary experience. J Magn Reson Imaging, 2016. 44(3): p. 653-64.
14. Glover, G.H., T.Q. Li, and D. Ress, Image-based method for retrospective correction of physiological motion effects in fMRI: RETROICOR. Magnetic Resonance in Medicine, 2000. 44(1): p. 162-167.
15. Cox, R.W., AFNI: software for analysis and visualization of functional magnetic resonance neuroimages. Comput Biomed Res, 1996. 29(3): p. 162-73.
16. Reuter, M., et al., Within-subject template estimation for unbiased longitudinal image analysis. Neuroimage, 2012. 61(4): p. 1402-18.
17. Liang, X., et al., Topologically Reorganized Connectivity Architecture of Default-Mode, Executive-Control, and Salience Networks across Working Memory Task Loads. Cereb Cortex, 2016. 26(4): p. 1501-1511.
Figures