3493
Comparing left vs right handed normal subjects using high spatial-resolution resting-state fMRI at 7T1Cleveland Clinic, Cleveland, OH, United States
Synopsis
Keywords: Brain Connectivity, Brain Connectivity
We present data from a series of resting-state data obtained at 7T using 1 mm isotropic resolution in separate concatenated groups of right handed (RH) and left handed (LH) normal control subjects. Whole brain connectivity maps are obtained from a large number of different seed parcels, many derived from FreeSurfer. We demonstrate the ability of this unique data to recapitulate known connectivity maps at the large scale and discern new findings at small scales.Introduction
We present data from a series of resting-state data obtained at 7T using 1 mm isotropic resolution in separate groups of right handed (RH) and left handed (LH) normal control subjects. Whole brain connectivity maps are obtained from a large number of different seed parcels, many derived from FreeSurfer. We demonstrate the ability of this unique data to recapitulate known connectivity maps at the large scale and discern new findings at small scales.Methods
Eighteen right handed (RH) and 20 left handed (LH) healthy control subjects were scanned, under an IRB-approved protocol, on a 7T (Siemens Magnetom (RH) and Terra (LH), with a SC72 gradient (Siemens Medical Solutions, Erlangen) using a 32-channel head coil (Nova Medical, Wilmington). Relevant sequences included a whole-brain anatomical MP2RAGE (T1w, 0.75 mm isotropic voxels), and resting state-fMRI (118 to 128 repetitions of 81 1.5mm thick axial slices acquired with TE/TR=19ms/2800ms, matrix 160x160, FOV 210mm x 210mm, receive bandwidth = 1562 Hz/pixel, MB=3, Grappa=2). Subjects were instructed to keep their eyes closed during scans and refrain from any motion. No sequences repeated.Data pre-processing: Each rsfMRI data was corrected for physiologic noise1, motion2, and B0. rsfMRI data was registered to their own anatomical MP2RAGE. Anatomical scans were registered nonlinearly to a modified MNI template (1mm isotropic resolution, slightly tilted and scaled to match Talraich positioning), after which rsfMRI data was warped to modified MNI template (ANTS). All MNI-warped rsfMRI data were spatially (2mm FWHM isotropic Gaussian) and temporally (0.01 – 0.10 Hz bandpass) filtered, variance normalized and concatenated to two large datasets (RH and LH), yielding equivalent time series with 2304 and 2560 volumes, respectively.
Functional connectivity (FC) analysis: Numerous parcellations of the 1 mm modified MNI template were generated, including cortical3 (slightly dilated), thalamus4, brainstem5, and cerebellum6 anatomical parcellations, as well as parcellations of major intrinsic connectivity networks7,8,9. Altogether, 425 ROIs across 21 parcellations were included for connectivity analysis (see below).
Each voxel in the brain was used as a seed (2mm sphere centered on voxel) to produce functional connectivity (FC) maps between that voxel and all gray matter voxels. The resulting t-score maps were non-parametrically transformed to z-score maps4. These maps were thresholded (z ≥ 2.0, cluster size ≥ 60) and the surviving voxels counted based on their overlap with the above parcellations. The resulting count (425 element vector per voxel) constitutes a connectivity profile or fingerprint for that voxel seed. This process was repeated for all voxels in the brain (~1.55 million voxels). Specific connectivity counts were normalized to a common seed ROI for comparisons.
Results
Overall connectivity maps between LH and RH subjects were remarkably consistent in overall patterns, suggesting a robustness of the method. See Fig 1 for a qualitative example of axial maps 1 mm thick covering a portion of the thalamus, with the seed regions in either the left or right sensorimotor regions, for both LH and RH subjects. Upon closer inspection there are important small and consistent differences (see example in Fig 2) comparing the focal connectivity map in the thalamus associated with a seed in either the precentral (motor) gyrus or postcentral gyrus (sensory). Concordant with the known thalamic homunculi10, the motor focus (concordant to ViM nuclei) is slightly anterior to sensory nuclei, best visualized comparing the centroid to the horizontal dashed line. Known anatomic motor networks are also recapitulated, Fig 3. Using a seed in the left vs right sensorimotor cortex the maps show connectivity maps in the Vim region of the thalamus and the dentate nucleus region. Note that ipsilateral thalamic connectivity is greater than contralateral, while contralateral dentate connectivity is greater than ipsilateral.Quantitative metrics of connectivity are provided in Table 1 (for connectivity from precentral gyrus to thalamus) and Table 2 (for connectivity from precentral gyrus to contralateral precentral gyrus). For clarity the connectivity numbers are normalized to the left precentral gyrus. As suggested qualitatively in Fig 3, thalamic connectivity is greatest to ipsilateral precentral gyrus. While thalamic connectivity is reduced for LH compared to RH, the contralateral precentral connectivity is higher for LH than RH. Parallel results for the postcentral gyrus were also obtained but not provided in this abstract.
Discussion
This new dataset has the potential to interrogate the fine detail of connectivity maps in the brain. Early results recapitulate known network connectivity in the thalamo-dentato-cortico network. In addition, a significant difference between RH and LH subjects is seen with the latter having reduced connectivity to the thalamus with increased connectivity to the contralateral cortex. These results within a portion of the motor networks could suggest a larger pattern of greater contralateral connectively in LH subjects, with greater connectivity in RH subjects, as investigated in other studies11,12,13.Conclusion
We present new data from high spatial resolution, whole brain connectivity maps obtained at 7T from concatenated groups of right-handed and left-handed normal subjects. Preliminary results are concordant with known networks, and indicate potential for exploring fine detail of whole brain connectivity.Acknowledgements
No acknowledgement found.References
1. Beall EB, Lowe MJ. Isolating physiologic noise sources with independently determined spatial measures. Neuroimage. 2007 Oct 1;37(4):1286-300.2. Beall EB, Lowe MJ. SimPACE: generating simulated motion corrupted BOLD data with synthetic-navigated acquisition for the development and evaluation of SLOMOCO: a new, highly effective slicewise motion correction. Neuroimage. 2014 Nov 1;101:21-34.
3. Destrieux C, Fischl B, Dale A, Halgren E (2010) Automatic parcellation of human cortical gyri and sulci using standard anatomical nomenclature. NeuroImage 53: 1-15
4. Iglesias JE, Insausti R, Lerma-Usabiaga G, Bocchetta M, Van Leemput K, Greve DN, van der Kouwe A; Alzheimer's Disease Neuroimaging Initiative, Fischl B, Caballero-Gaudes C, Paz-Alonso PM. A probabilistic atlas of the human thalamic nuclei combining ex vivo MRI and histology. Neuroimage (2018)
5. Bianciardi M, Toschi N, Edlow BL, Eichner C, Setsompop K, Polimeni JR, Brown EN, Kinney HC, Rosen BR, Wald LL. Toward an in vivo neuroimaging template of human brainstem nuclei of the ascending arousal, autonomic and motor systems. Brain Connect. 2015 Dec;5(10):597-607
6. Diedrichsen, J., Balsters, J. H., Flavell, J., Cussans, E., & Ramnani, N. (2009). A probabilistic atlas of the human cerebellum. Neuroimage.
7. Shirer WR, Ryali S, Rykhlevskaia E, Menon V, Greicius MD: Decoding subject-driven cognitive states with whole-brain connectivity patterns. Cereb Cortex (2012)
8. Yeo BTT, Krienen FM, Sepulcre J, Sabuncu MR, Lashkari D, Hollinshead M, Roffman JL, Smoller JW, Zollei L, Polimeni JR, Fischl B, Liu H, Buckner RL (2011) The organization of the human cerebral cortex estimated by intrinsic functional connectivity. J Neurophysiol 106: 1125-1165
9. Choi EY, Yeo BT, Buckner RL (2012) The organization of the human striatum estimated by intrinsic functional connectivity. J Neurophysiol 108: 2242-2263
10. Schaltenbrand G, Wahren W: Atlas for Stereotaxy of the Human Brain. Stuttgart, Thieme Medical Publishers, 1977.
11. Wang H, Zhou H, Guo Y, Gao L, Xu H. Voxel-Wise Analysis of Structural and Functional MRI for Lateralization of Handedness in College Students. Frontiers in Human Neuroscience. 2021; 15:687965.
12. Pool E, Rehme A, Eickhoff S, Fink G, Grefkes C. Functional resting-state connectivity of the human motor network: differences between right- and left-handers. Neuroimage. 2015; 109:298-306.
13. Joliot M, Tzourio-Mazoyer N, Mazoyer B. Intra-hemispheric intrinsic connectivity asymmetry and its relationships with handedness and language Lateralization. Neuropsychologia. 2016; 93(Pt B):437-447.
Figures
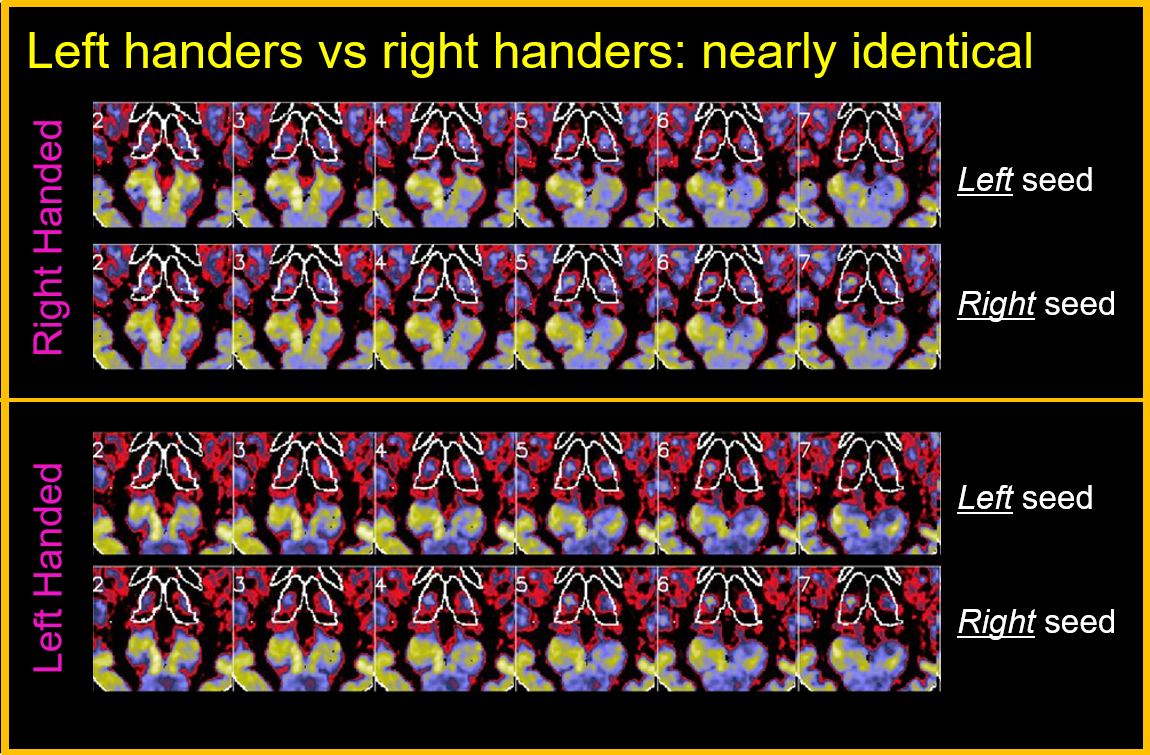
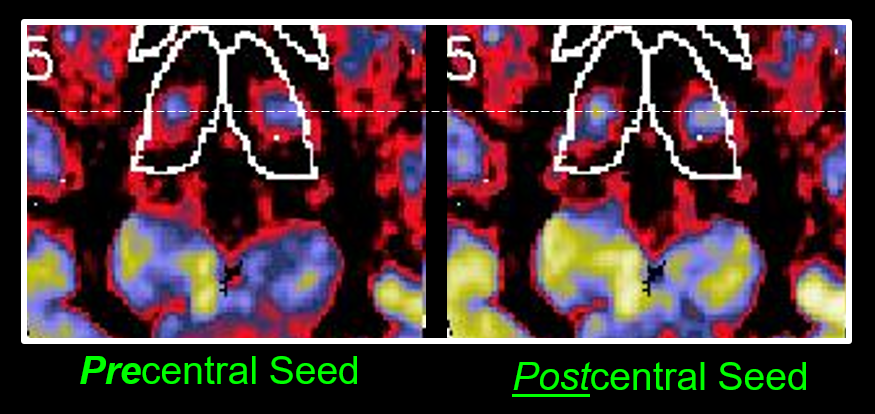
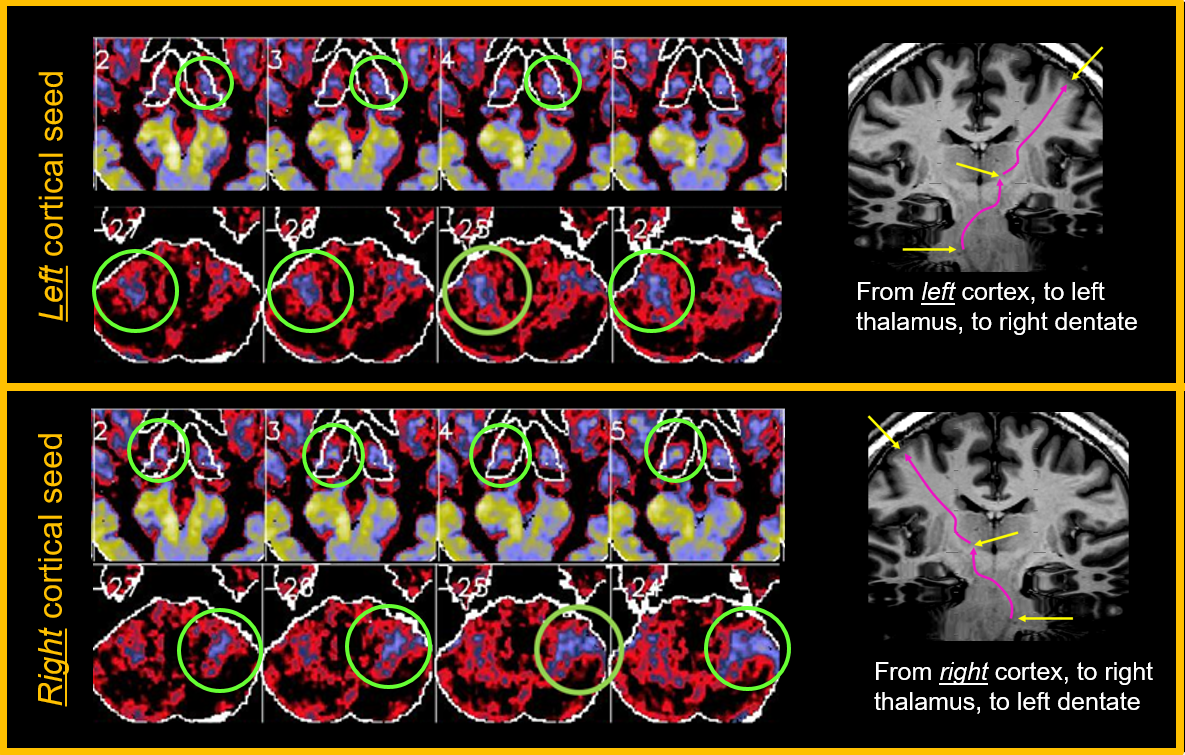
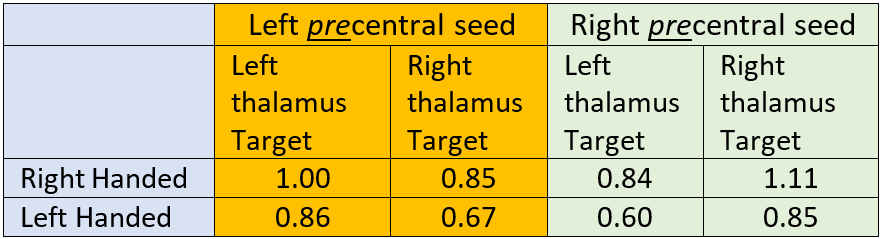
Table 1: Connectivity from precentral gyrus to thalami. Connectivity values are normalized to the left precentral-thalamus connection. In all cases ipsilateral connection to the thalamus is greater than contralateral. Left handed connectivity follows a similar pattern but is about 15-25% lower.
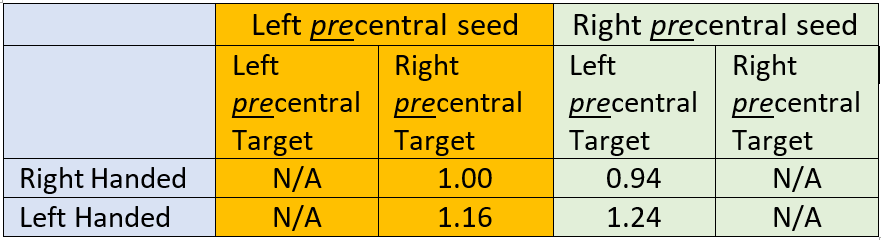
Table 2: Connectivity from precentral gyrus to contralateral precentral gyrus. Connectivity values are normalized to the left precentral-contralateral connection. Ipsilateral results representing the same seed and target are not applicable. In both cases, LH subject connectivity is increased compared to RH subjects, by about 15%-30%. In distinction to Table 1, these data could suggest increased inter-hemispheric connectivity for LH subjects, with corresponding increased intra-hemispheric connectivity for RH subjects.