3492
Reorganization of Functional Connectivity between White and Grey Matters during Normal Aging1Biomedical Engineering, Vanderbilt University, Nashville, TN, United States, 2VUIIS, Vanderbilt University Medical Center, Nashville, TN, United States, 3Radiology, Vanderbilt University Medical Center, Nashville, TN, United States, 4Electrical and Computer Engineering, Vanderbilt University, Nashville, TN, United States, 5Laboratory of Behavioral Neuroscience, National Institute on Aging, Baltimore, MD, United States
Synopsis
Keywords: Brain Connectivity, Aging
Resting state BOLD signals in white matter (WM) bundles have been found to be partially synchronized with signals in gray matter (GM) volumes, suggesting WM-GM functional connectivity (FC). However, little is known about whether or how these relationships change during normal aging, and traditional graph models are inappropriate. We introduced a novel graph model and applied it to assess WM-GM network properties in 1,462 healthy subjects (22–96years) and their age effects. Results show heterogenous alterations in WM-GM rsFC over adulthood with decreases mainly during late adulthood. Our results demonstrate there is substantial reorganization of WM-GM correlations during normal aging.INTRODUCTION
Normal aging has been associated with disrupted resting-state functional connectivity (rsFC) within brain networks1, but previous analyses have been limited to only gray matter (GM). White matter (WM) also exhibits BOLD fluctuations, and BOLD signals in WM bundles show reproducible synchronization with GM volumes2,3. However, little is known about how WM-GM rsFC changes during normal aging, or how functional networks containing WM undergo reorganization. Moreover, one methodological challenge is that generic graph models cannot be used to analyze WM-GM rsFC networks due to their intrinsic nature. We therefore introduce a new graph model to characterize the topological architecture of WM-GM rsFC and generate network properties. Using this we assessed network properties at the levels of WM-GM pairs, WM bundles, and functional networks for a healthy population and investigated age effects.METHODS
Data, preprocessing and quality controlThe rsfMRI and T1w images were obtained from three databases: ADNI-2 and -3, BLSA and OASIS-3 (N=1,462, age=22-96 years). An automatic high-performance pipeline was established to preprocess the large-scale data4, which included slice timing and head motion corrections, control for motion parameters5 and CSF signal, detrending and filtering (0.01-0.1Hz). Meanwhile, tissue probability maps (TPM) were segmented on T1w images6. The resulting rsfMRI and TPMs were spatially normalized into MNI space and subjected to a manual quality control procedure.
Functional connectivity and harmonization
To generate each WM-GM rsFC matrix, Pearson’s correlations of averaged time courses between atlas-defined WM bundles7,8 and GM parcels9 were computed. Then ComBat10 harmonization was performed on rsFC values to reduce site-effects using the neuroComBat package.
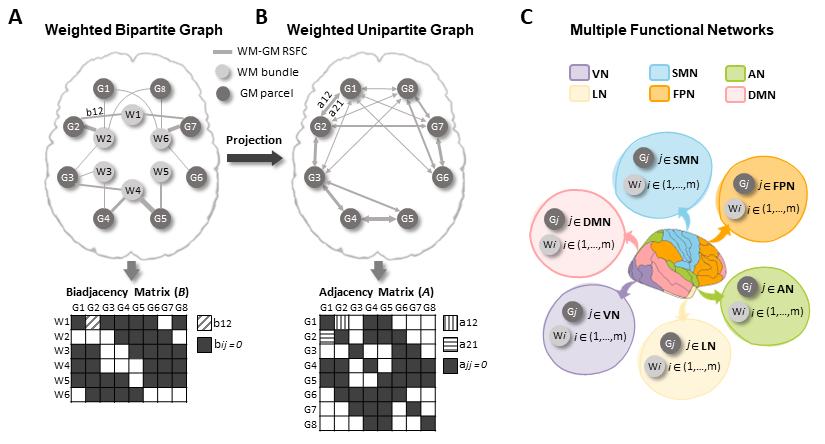
Bipartite graph and WM-GM rsFC connectome measures
A bipartite graph comprises two distinct groups of nodes (i.e., WM node $$$W_i$$$, and GM node $$$G_j$$$), with links connecting any two nodes between the groups11. This graph can be represented by a biadjacency matrix B in which the link weight (i.e., WM-GM rsFC) is the element (Fig 1A).
FC density (FCD) of WM bundle: This index measures the rsFC strength of the WM bundle connecting to entire cerebral cortex, formalized as:
$$$F C D\left(W_i\right)=\frac{1}{n} \sum_j^n b_{i j}$$$. (1)
Global efficiency (GE) of functional network: In the bipartite graph there are no closed triangular paths, so we projected the bipartite graph to a directed weighted unipartite graph (i.e., WM-mediated GM-GM graph) via
$$$a_{j j^{\prime}}=\left\{\begin{array}{lr}\sum_p b_{p j} & \left(b_{p j} \neq 0, b_{p j^{\prime}} \neq 0, j \neq j^{\prime}\right) \\0 & \left(j=j^{\prime}\right)\end{array}\right.$$$, (2)
where $$$a_{j j{\prime}}$$$ is the element of the projected adjacency matrix (Fig 1B).
All GM nodes were assigned into six functional networks (i.e., DMN, FPN, LN, AN, SMN and VN) according to Yeo’s definition12 (Fig 1C). The GE of the kth functional network was then calculated based on:
$$$G E\left(N_k\right)=\frac{1}{n_k\left(n_k-1\right)} \sum_j^{n_k} \sum_{j \prime, j \prime \neq j}^{n_k}\left(d_{j j_{\prime}}\right)^{-1}$$$, (3)
where $$$d_{j j \prime}$$$ is the shortest weighted path between two GM nodes inside the same network13,14.
Statistical analysis
We modeled the age trajectory of rsFC for each WM-GM pair or FCD for each WM bundle using multiple linear regressions (MLR) including both linear and quadratic models with sex and head motion (i.e., mean FD15) as covariates:
$$$y=\beta_0^{\text {lin }}+\beta_1^{\text {lin }} \times a g e+\beta_2^{l i n} \times \operatorname{sex}+\beta_3^{\text {lin }} \times F D+\epsilon$$$, (4)
$$$y=\beta_0^{q u a}+\beta_1^{q u a} \times a g e+\beta_2^{q u a} \times a g e^2+\beta_3^{q u a} \times \operatorname{sex}+\beta_4^{q u a} \times F D+\epsilon$$$, (5)
where $$$y$$$ is rsFC or FCD. The p-value of the t-test was adjusted using the FDR16, yielding a q-value. The best model was selected based on AIC17. Moreover, we further modeled the age effects in the late adulthood (age ≥ 70 years). Age effect on GE was modeled with MLR like in equation (4) and the p-value was corrected for 6 multiple comparisons.
RESULTS AND DISCUSSION
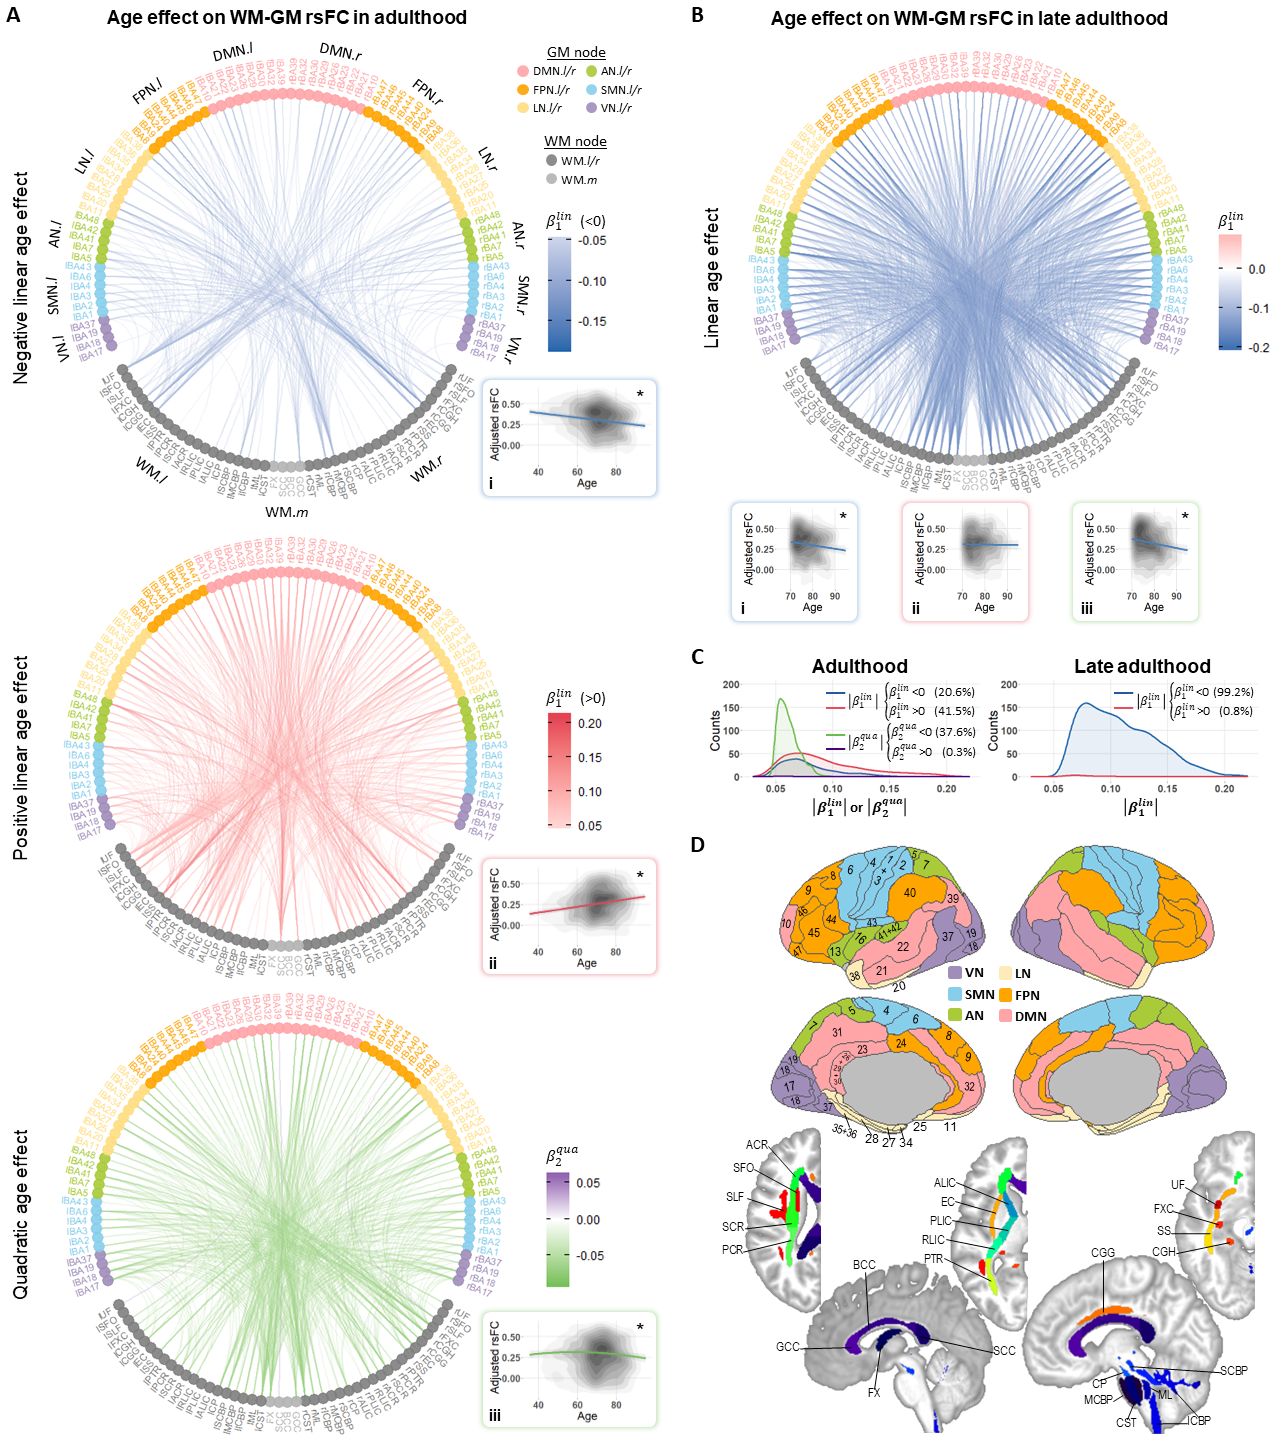
Age effect on WM-GM rsFCOur results revealed three major significant age effects on WM-GM rsFC over entire adulthood: negative linear, positive linear and inverted-U-shaped age effects (Fig. 2A). By contrast, the rsFC during late adulthood exhibited predominantly negative linear age effects (Fig. 2BC). The contrasts among these patterns hint that aging influences certain WM functional architectures disproportionately, consistent with previous reports1,18,19.
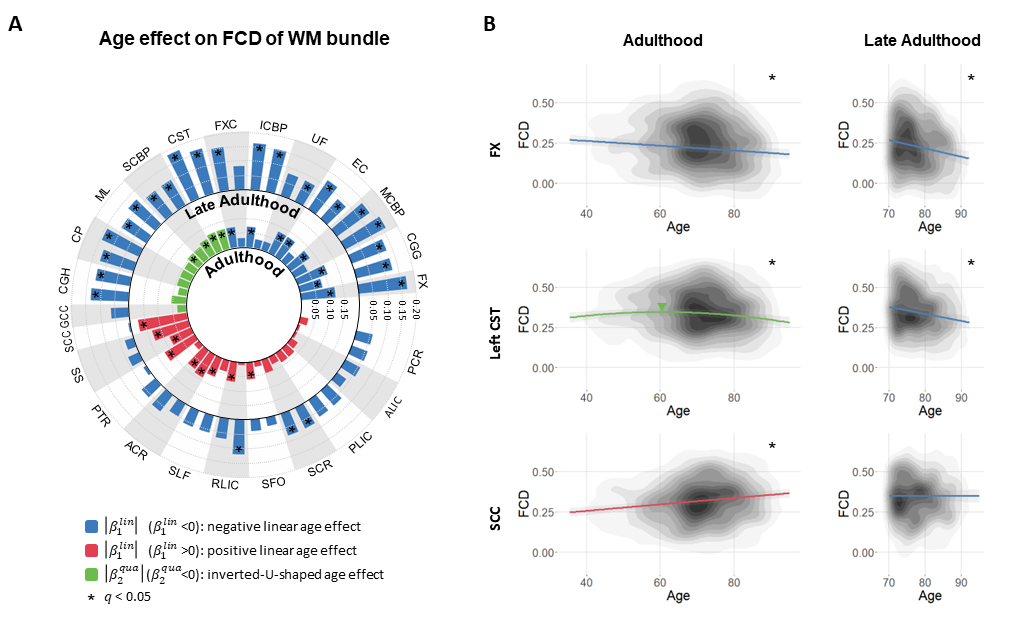
Age effect on FCD of WM bundle
Across the entire adulthood, three significant age effects were seen on FCD of WM bundles (Fig. 3A). The bundles found with declines in aging mainly serve for higher-order cognitions and motor-sensory associations. The bundles with positive age effect suggest an over-recruitment or/and compensation mechanism via network reorganization. During late adulthood, all WM bundles showed negative linear age effects to some extent (Fig. 3A), indicating that the compensation cannot balance the other changes in advanced aging.
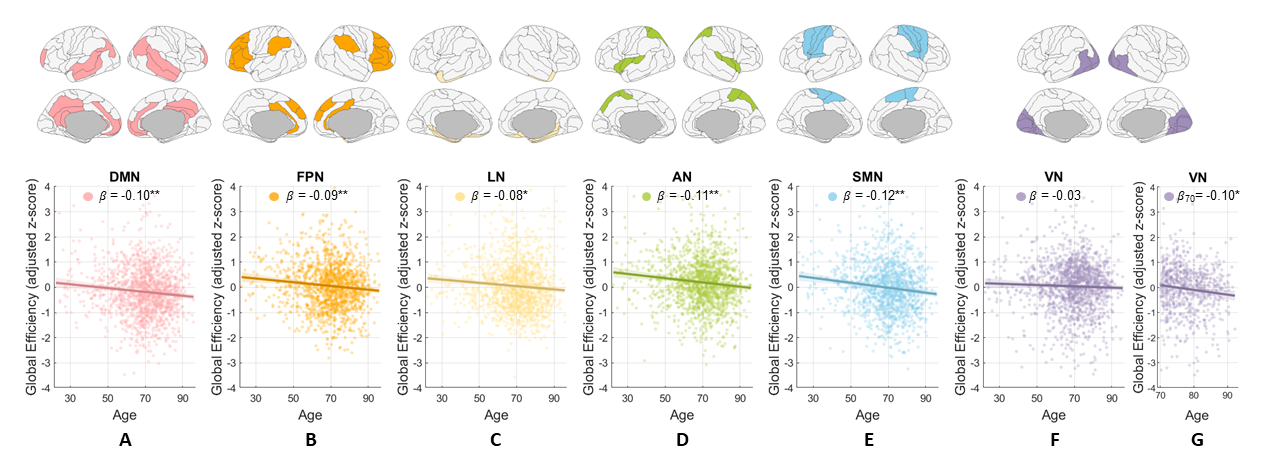
Age effect on GE of functional network
The GE values of six functional networks all declined with age over entire adulthood or during late adulthood (Fig. 4), indicating that all these WM-mediated networks begin to lose the ability to efficiently combine information from distributed parts or show dissolved integration as brain ages.
CONCLUSION
This study provides a model to quantitatively characterize the topology and properties of a WM-GM rsFC graph. More importantly, the large-scale analyses based on this model provide evidence that WM-GM rsFC networks undergo reorganization at multiple scales during normal and advanced aging.Acknowledgements
The project is supported by NIH grant 1RF1MH123201 (Gore and Landman) and by the Intramural Research Program of the National Institute on Aging of the NIH. ADNI data collection and sharing for this project was funded by NIH grant U01 AG024904), DOD award W81XWH-12-2-0012) and other grants (https://adni.loni.usc.edu/wp-content/uploads/how_to_apply/ADNI_Manuscript_Citations.pdf).References
1. Jockwitz C, Caspers S. Resting-state networks in the course of aging—differential insights from studies across the lifespan vs. amongst the old. Pflugers Arch. 2021;473(5):793-803. doi:10.1007/s00424-021-02520-7
2. Ding Z, Huang Y, Bailey SK, et al. Detection of synchronous brain activity in white matter tracts at rest and under functional loading. Proc Natl Acad Sci U S A. 2018;115(3). doi:10.1073/pnas.1711567115 3. Gore JC, Li M, Gao Y, et al. Functional MRI and resting state connectivity in white matter - a mini-review. Magn Reson Imaging. 2019;63. doi:10.1016/j.mri.2019.07.017
4. Gao Y, Lawless D, Li M, et al. Automatic preprocessing pipeline for white matter functional analyses of large-scale databases. In: Proceeding of SPIE Medical Imaging. San Diego; 2023.
5. Friston KJ, Williams S, Howard R, Frackowiak RSJ, Turner R. Movement-related effects in fMRI time-series. Magn Reson Med. 1996;35(3). doi:10.1002/mrm.1910350312
6. Gaser C, Dahnke R. CAT – A Computational Anatomy Toolbox for the Analysis of Structural MRI Data. bioRxiv. Published online 2022.
7. Mori S, Oishi K, Jiang H, et al. Stereotaxic white matter atlas based on diffusion tensor imaging in an ICBM template. Neuroimage. 2008;40(2):570-582. doi:10.1016/j.neuroimage.2007.12.035
8. van Baarsen KM, Kleinnijenhuis M, Jbabdi S, Sotiropoulos SN, Grotenhuis JA, van Cappellen van Walsum AM. A probabilistic atlas of the cerebellar white matter. Neuroimage. 2016;124:724-732. doi:https://doi.org/10.1016/j.neuroimage.2015.09.014
9. Lancaster JL, Woldorff MG, Parsons LM, et al. Automated Talairach Atlas labels for functional brain mapping. Hum Brain Mapp. 2000;10(3). doi:10.1002/1097-0193(200007)10:3<120::AID-HBM30>3.0.CO;2-8
10. Johnson WE, Li C, Rabinovic A. Adjusting batch effects in microarray expression data using empirical Bayes methods. Biostatistics. 2007;8(1):118-127. doi:10.1093/biostatistics/kxj037
11. Newman MEJ, Strogatz SH, Watts DJ. Random graphs with arbitrary degree distributions and their applications. Phys Rev E. 2001;64(2):26118. doi:10.1103/PhysRevE.64.026118
12. Yeo BTT, Krienen FM, Sepulcre J, et al. The organization of the human cerebral cortex estimated by intrinsic functional connectivity. J Neurophysiol. 2011;106(3):1125-1165. doi:10.1152/jn.00338.2011
13. Rubinov M, Sporns O. Complex network measures of brain connectivity: Uses and interpretations. Neuroimage. 2010;52(3):1059-1069. doi:https://doi.org/10.1016/j.neuroimage.2009.10.003
14. Latora V, Marchiori M. Efficient Behavior of Small-World Networks. Phys Rev Lett. 2001;87(19):198701. doi:10.1103/PhysRevLett.87.198701
15. Power JD, Barnes KA, Snyder AZ, Schlaggar BL, Petersen SE. Spurious but systematic correlations in functional connectivity MRI networks arise from subject motion. Neuroimage. 2012;59(3):2142-2154. doi:10.1016/j.neuroimage.2011.10.018
16. Benjamini Y, Hochberg Y. Controlling the False Discovery Rate: A Practical and Powerful Approach to Multiple Testing. Journal of the Royal Statistical Society: Series B (Methodological). 1995;57(1):289-300. doi:https://doi.org/10.1111/j.2517-6161.1995.tb02031.x
17. Akaike H. A new look at the statistical model identification. IEEE Trans Automat Contr. 1974;19(6):716-723. doi:10.1109/TAC.1974.1100705
18. Andrews-Hanna JR, Snyder AZ, Vincent JL, et al. Disruption of Large-Scale Brain Systems in Advanced Aging. Neuron. 2007;56(5):924-935. doi:https://doi.org/10.1016/j.neuron.2007.10.038
19. Hedden T, Gabrieli JDE. Insights into the ageing mind: a view from cognitive neuroscience. Nat Rev Neurosci. 2004;5(2):87-96. doi:10.1038/nrn1323
Figures