3490
Topology of visual cortical connections shapes spatial structure of perception1Cardiff University Brain Research Imaging Centre, Cardiff University, Cardiff, United Kingdom, 2Shenzhen Institute of Advanced Technology, Chinese Academy of Sciences, Shenzhen, China, 3University of Chinese Academy of Sciences, Beijing, China
Synopsis
Keywords: Brain Connectivity, fMRI
Visual experience is highly spatial. Much of what we perceive, we perceive in space. However, the spatial structure of visual experience is often taken for granted and its neural mechanism is rarely studied. Here we tested a novel theoretical framework that proposes lateral connections in primary visual cortex as the neural basis underlying the spatial structure of visual experience. We found that the inhomogeneity in spatial localization ability across visual field correlated with the variability in lateral connection length across primary visual cortex, suggesting a mapping between the topography of visual cortical connectivity and the spatial structure of visual perception.Introduction
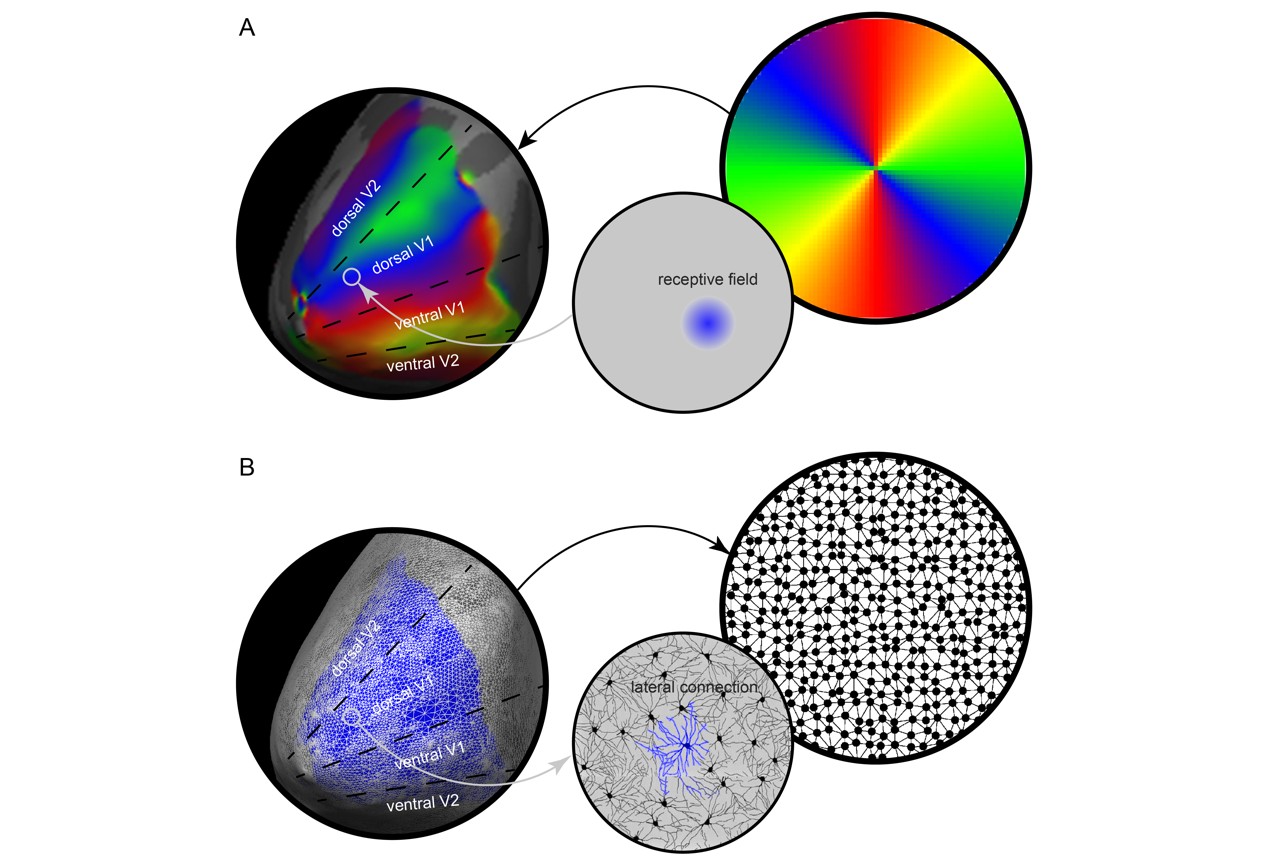
Space is the basis of human vision. If visual experience lost spatial structure, perception of low-level features such as orientations, distances, sizes, and high-level objects such as faces, scenes, characters, would all cease to be possible. However, the ability to have spatially structured visual experience comes so natural that it is often taken for granted and its neural mechanism is rarely studied.Mirroring the fundamental role of space in human visual perception, a spatial map of visual field is present in almost every area of human visual cortex1-3, in which individual neural populations respond to specific locations in visual field (receptive field) and nearby neural populations to nearby locations (Figure 1A). As a result, lateral connections between neural populations in visual cortex effectively form a net that links locations in visual field (Figure 1B). Here we tested a theoretical framework that proposes the topographic organization of lateral connections as the neural basis underlying the spatial structure of visual experience 4-6.
Methods
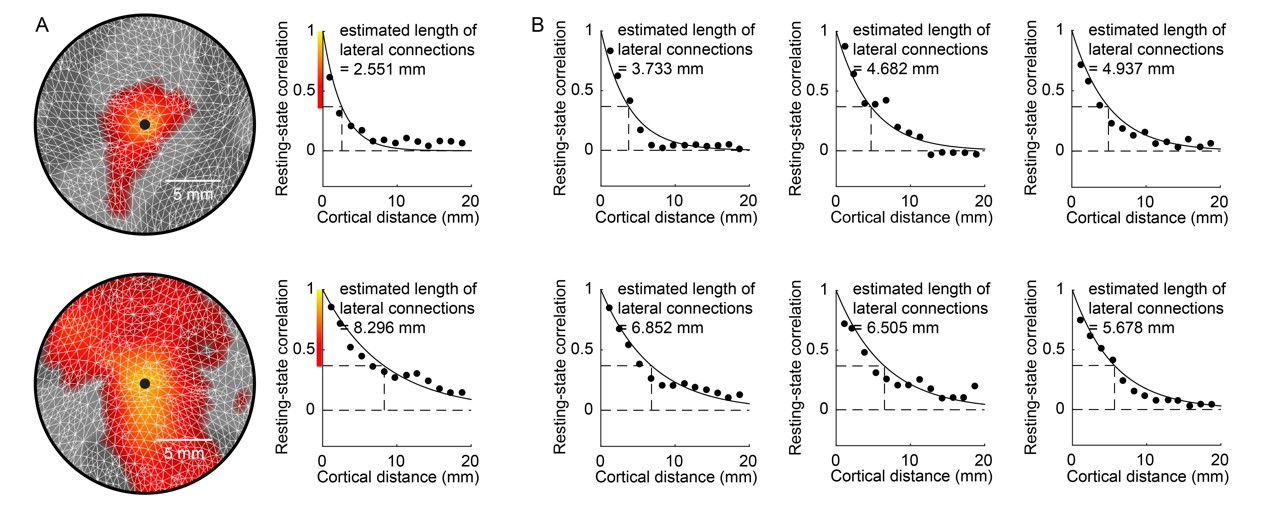
To test this hypothesis, we studied how the topographic organization of lateral connections in primary visual cortex (V1) related to the spatial structure of visual perception. In particular, we examined how the marked variability in spatial localization ability across visual field is underlined by the variability in lateral connection length across V1.We estimated the length of lateral connections for individual neural populations (voxels) in V1 from resting-state functional connectivity map. From the resting-state fMRI data, we derived a functional connectivity map for each V1 voxel, showing the correlation in resting-state fMRI activity between this seed voxel and the rest voxels in V1 (Figure 2A). We then estimated the length of lateral connections based on the decay of functional connectivity with cortical surface distance (Figure 2B). To quantity the decay of functional connectivity with cortical surface distance, we extracted the cortical surface coordinates from Freesurfer surface-based reconstruction of structural MRI data, and calculated cortical surface distance between every two voxels 7, 8. For each V1 voxel, its correlation in resting-state activity with other V1 voxels was plotted against its cortical surface distance to these voxels (Figure 2). The plot was binned into data points at a bin size of 1.5 mm, and fitted with an exponential decay function. The exponential decay constant provided an estimate of lateral connection length.
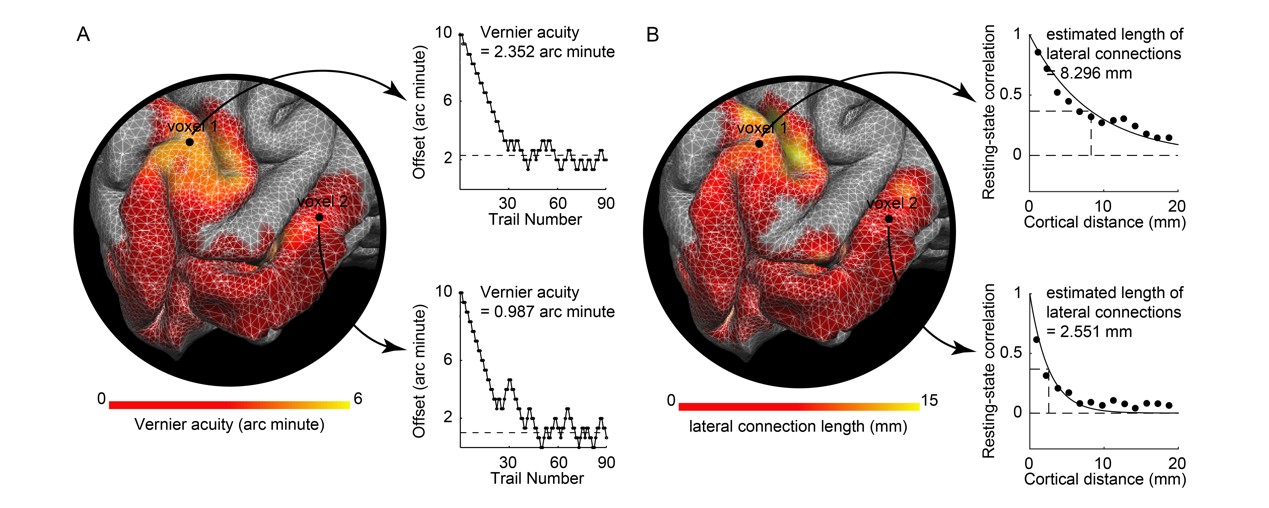
We then measured spatial localization ability at different regions in visual field through psychophysics experiments. We measured spatial localization ability (Vernier acuity), the ability to tell if two adjacent line segments are aligned or misaligned 9, at thirteen non-overlapping, evenly distributed regions in visual field covering six polar angles (45, 90, 135, 225, 270, 315 degrees) and three eccentricities (0, 4.7, 6.7 degrees). The measure at each visual field region took place in a separate psychophysical experiment, in which a pair of collinear bars and a pair of horizontally offset bars were presented in a randomized order, and participants answered which presentation contained the horizontally offset pair. The horizontal offset was adjusted in a two-up-one-down staircase to measure the Vernier acuity threshold below which participants could not make the correct answer (Figure 3).
Results
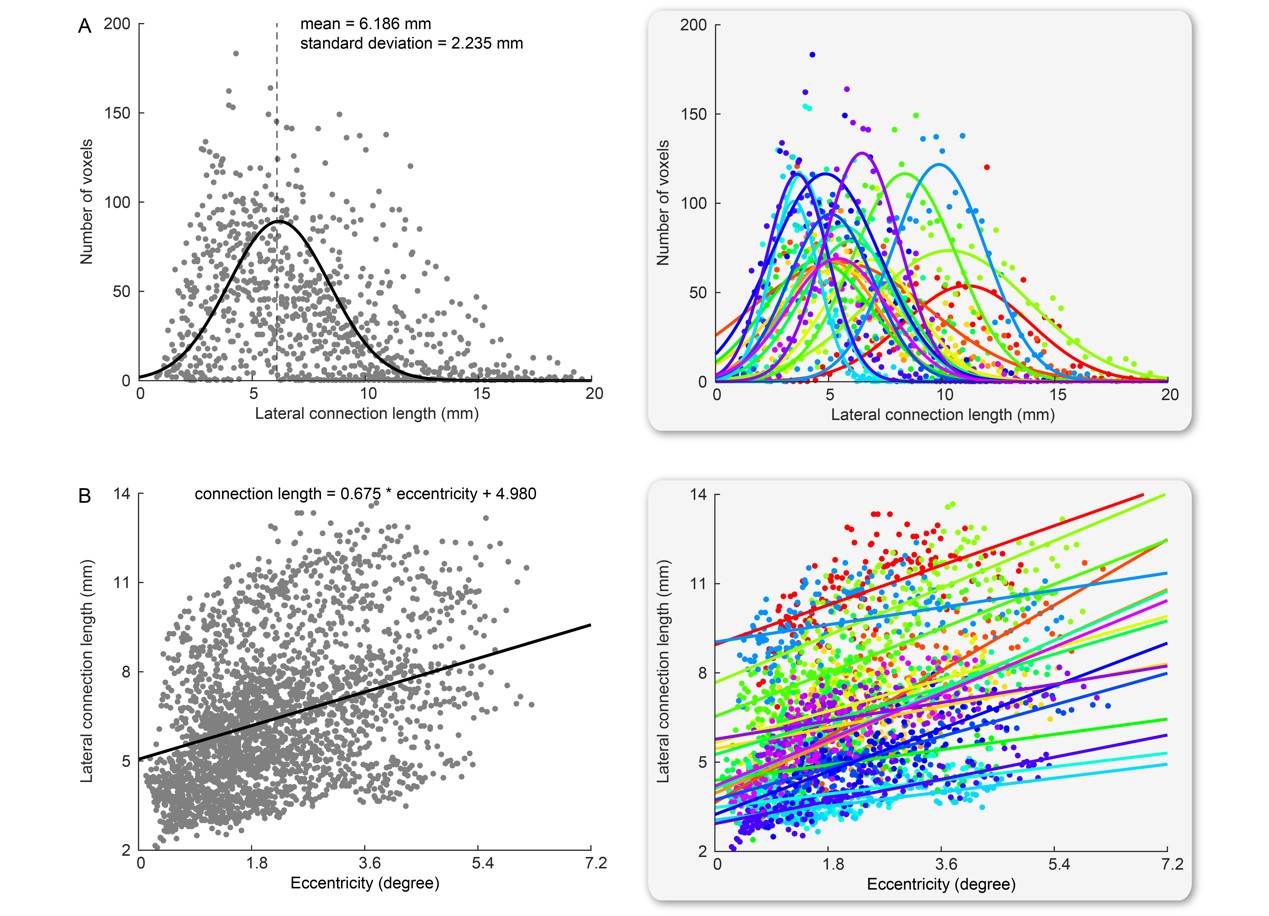
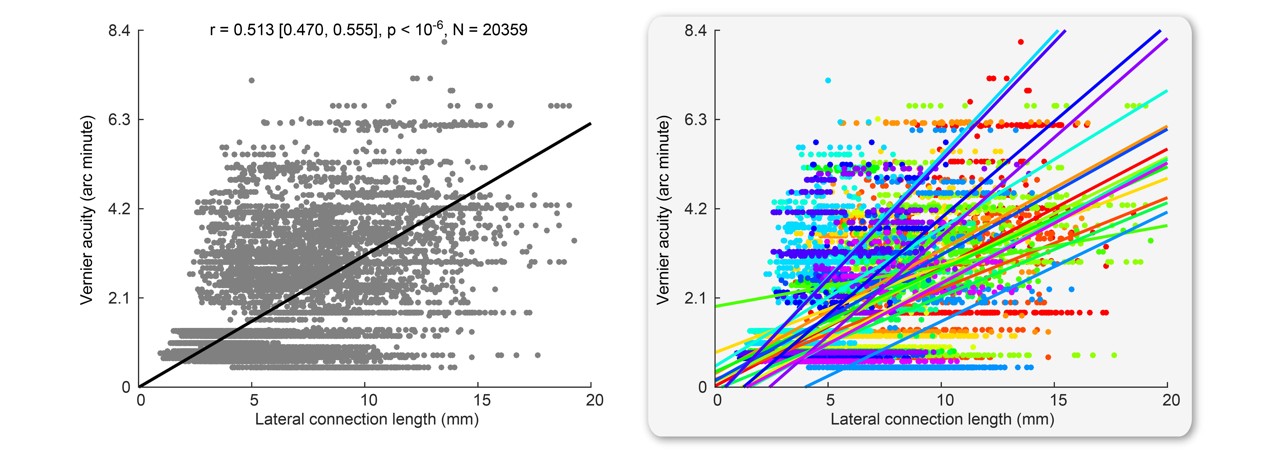
We found that the length of lateral connections varied substantially across different voxels in V1 (Figure 4A) and increased systematically along visual field eccentricity (Figure 4B). This eccentricity-dependent change mirrored the systematic change in spatial localization ability along visual field eccentricity. We observed a significant correlation between spatial localization ability and lateral connection length across voxels in V1 (Figure 5). Specifically, higher spatial localization ability (lower Vernier acuity threshold) was associated with shorter lateral connection (r = 0.513, 95% C.I. of r = [0.470, 0.555], p < 10-6, N = 20359 voxels; threshold value of r for establishing significance at data length of 20359 voxels with FDR correction for multiple comparison = 0.016). The correlation was observed both across the group of eighteen participants (Figure 5) and within individual participants. Moreover, the correlation was contributed jointly by eccentricity and polar angle (with eccentricity regressed out, r = 0.248, 95% C.I. of r = [0.189, 0.305], p < 10-6, N = 20359 voxels; threshold value of r for establishing significance at data length of 20359 voxels with FDR correction for multiple comparison = 0.016).Discussion and Conclusion
We found that the length of lateral connections, estimated from the decay of resting-state functional connectivity with cortical surface distance, varied substantially across different neural populations in V1 and increased systematically along visual field eccentricity. The variability in lateral connection length across V1 correlated with the variability in spatial localization ability across visual field. Our findings suggest a mapping between the topology of V1 lateral connections and the spatial structure of perception. They provide empirical support for the theoretical framework that proposes lateral connections as the neural basis of visual spatial structure4-6.Acknowledgements
This study was supported by Wellcome Trust (209192/Z/17/Z); GuangDong Basic and Applied Basic Research Foundation (2021A1515010200).References
[1] Sereno, M. I., Dale, A. M., Reppas, J. B., et al. Borders of multiple visual areas in humans revealed by functional magnetic resonance imaging. Science. 1995, 268: 889-893.
[2] Katzner, S., Weigelt, S. Visual cortical networks of mice and men. Current Opinion in Neurobiology. 2013, 202-206.
[3] Wang, L., Mruczek, R. E., Arcaro, M. J., et al. Probabilistic maps of visual topography in human cortex. Cerebral Cortex.2014, 25, 3911-3931.
[4] Tononi, G., Edelman, G. M. Consciousness and complexity. Science, 1998, 282(5395): 1846-1851.
[5] Tononi, G., Edelman, G. M., Sporns, O. Complexity and coherency: integrating information in the brain. Trends in Cognitive Sciences, 1998, 2(12): 474-484.
[6] Tononi, G., Boly, M., Massimini, M., et al. Integrated information theory: from consciousness to its physical substrate. Nature Reviews Neuroscience, 2016, 17: 450-461.
[7] Dale, A. M., Fischl, B., Sereno, M. I. Cortical surface-based analysis: I. Segmentation and surface reconstruction. Neuroimage, 1999, 9, 179-194.
[8] Fischl, B., Sereno, M. I., Dale, A. M. Cortical surface-based analysis: II: inflation, flattening, and a surface-based coordinate system. Neuroimage, 1999, 9: 195-207.
[9] Findlay, J. M. Feature detectors and vernier acuity. Nature, 1973, 241: 135.
Figures