3488
Autocorrelation of the fMRI signal dynamically changes during different brain states1University of Calgary, Calgary, AB, Canada, 2Department of Psychology, University of Toronto, Toronto, ON, Canada, 3Rotman Research Institute at Baucrest, Toronto, ON, Canada
Synopsis
Keywords: Brain Connectivity, fMRI
The autocorrelation (AC) of fMRI signal is affected by brain function and state. We used fMRI data acquired during working memory, mathematical computation, visual attention, and rest, and showed that the AC signal of gray matter dynamically changes across different task blocks. The dynamic AC (dAC) can be used to estimate brain-state changes with high accuracy. Classifier accuracy is correlated with the task performance; Subjects with better task performance have better accuracy in the dAC-based brain state classification. This study shows that the AC of the fMRI signal over time dynamically changes by the cognitive processes.Introduction
Recent evidence suggests that the autocorrelation (AC) of the fMRI signal is affected by ongoing functional and cognitive processes1-3. Previously we have shown that the AC pattern across the whole gray matter varies between blocks of different task performance4. However, it is not clear if the AC pattern dynamically changes at more fine-grained temporal windows within the task block itself. In this study we used a continuous, multitask fMRI paradigm to study changes in the dynamic autocorrelation (dAC) of the fMRI signal. Our objectives are to investigate: (1) how the AC pattern dynamically changes within and between different brain states, and (2) if the brain state can be estimated based on the AC pattern.Method
We used a publicly available dataset (FCStateClassif5), which consists of eight 3-minutes blocks of four tasks (two-back working memory (WM), Mathematical computation (Math), visual attention (Video), and resting-state (Rest), with two blocks for each task). The fMRI data of 18 healthy subjects were acquired on a Siemens 7 Tesla MRI scanner with a 32-element receive coil. Functional runs were obtained using a GE-EPI sequence (TR = 1.5 s, TE = 25 ms, voxel size = isotropic 2mm). For each of the three tasks, three behavioral measures of percent correct answers, percent missing answers, and reaction time were estimated for each subject. fMRI preprocessing steps include brain extraction, motion correction, spatial smoothing with a 5mm FWHM kernel and regression of 6 estimated motion parameters. Sliding window technique with 1TR shift is used to calculate dynamic AC (dAC). Signal of each voxel is partitioned into multiple overlapping segments with 15-sample length (22.5 seconds). The autocorrelation of each window is calculated using MATLAB’s ARfit toolbox. This gives a time series of AC value, which can be used to investigate dynamic changes in the AC value.Dynamic AC was averaged across the gray matter voxels of each subject and then a group-average plot of the dAC was generated to show how consistent the AC values are across each task block. Next, patterns of AC values across the gray matter were used to classify time points into four classes associated with the four tasks. Clustering was performed at the individual level using a k-mean clustering algorithm. Adjusted rand index (ARI) was used to evaluate the performance of clustering. An ARI of one would indicate perfect clustering with no error and ARI of zero would indicate random clustering. Moreover, sensitivity, specificity, and accuracy scores for each task was calculated. Perfect clustering of a task would have accuracy, sensitivity and specificity scores of one, whereas a random clustering would have scores around 0.25. Finally, correlation between the clustering performance (ARI) and three behavioral measures of each task was calculated.
Results
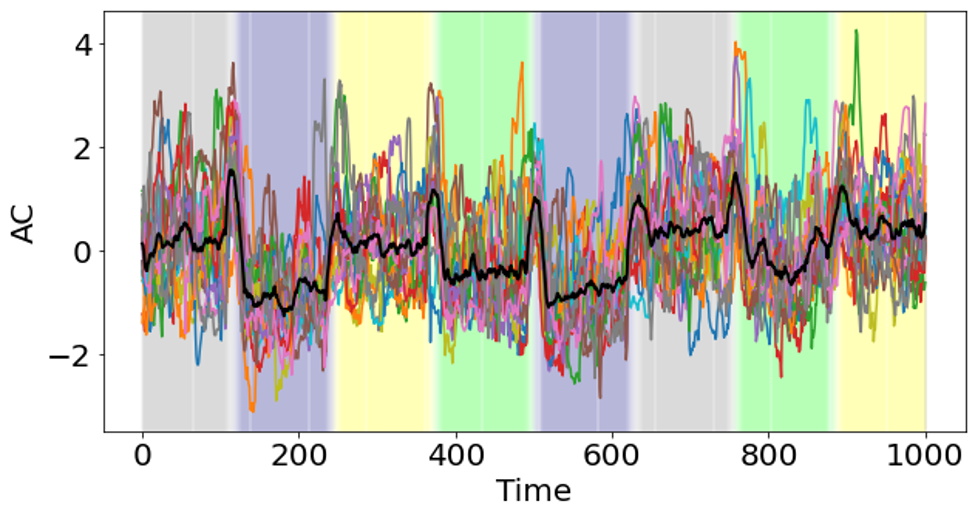
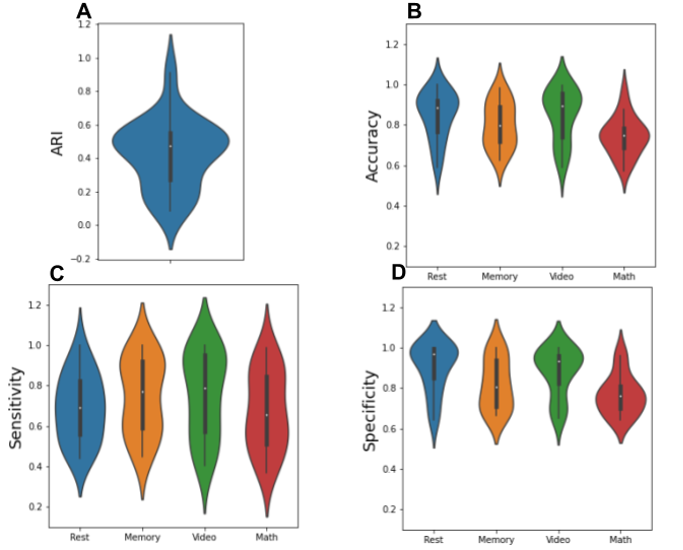
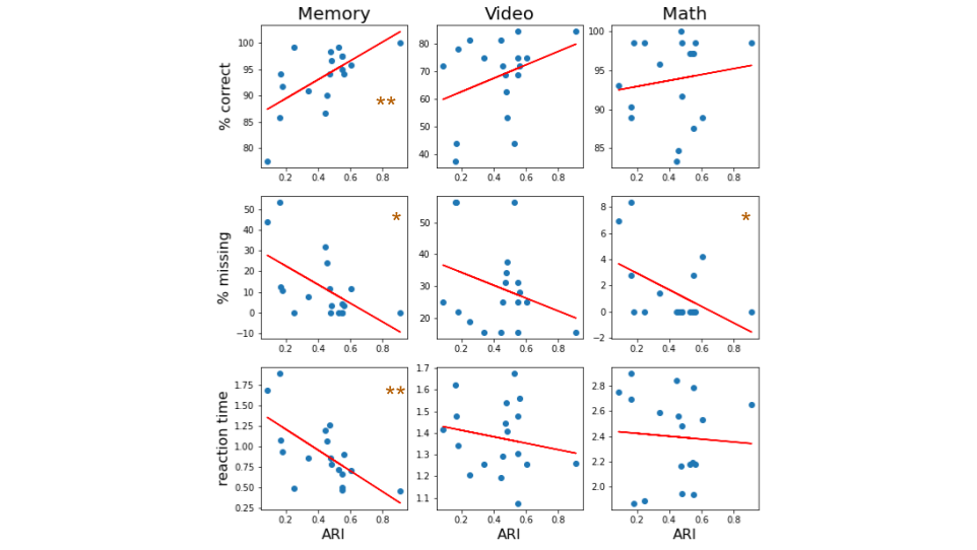
Figure 1 shows the group-average dAC (black line), along with the dAC for each individual (colored lines), averaged across the whole gray matter. The plot shows different AC values in different task blocks. The AC values during memory blocks are the lowest, followed by math blocks. dAC shows sudden jumps during the intervals between task blocks, when instructions are presented. Next, the AC pattern of each 15-sample block was used to cluster each block into 4 groups. ARI, accuracy, sensitivity and specificity values are presented in Figure 2. All tasks show considerably better ARI, accuracy, sensitivity and specificity than a random classifier, demonstrating that the brain states can be estimated based on the AC pattern across the brain. Sensitivity of the four tasks is comparable, while the Math task has lower specificity and accuracy than the other three tasks.Figure 3 shows the correlation between the behavioral measures of each task and the clustering performance. Percent correct is positively correlated with the clustering performance, whereas percent missing and reaction time are negatively correlated with the clustering performance. The correlation only reached significance for the memory task.
Discussion
We found that the AC of the fMRI signal dynamically changed, and that this change was meaningfully associated with the brain state and function. The pattern of dAC across brain can be used to predict the brain state. Among the four tasks, Math had the lowest accuracy due to high number of false positives and specificity. Overall, better task performance (higher percent of correct responses, lower percent of missing responses, and shorter reaction time) is associated with more accurate clustering. This suggests that dAC can better estimate the brain state in the subjects who are more engaged and has better task performance. This finding supports the hypothesis that the AC of fMRI signal carries with it important signatures of brain function.Acknowledgements
Data used in the preparation of this work were obtained from the NIMH’s Lab of Brain and Cognition (LBC; Principal Investigators: Javier Gonzalez-Castillo, Peter A. Bandettini). LBC funding was provided by the National Institute of Mental Health, Division of Intramural ResearchPrograms (NIMH DIRP).References
1. Arbabshirani, M. R. et al. Autoconnectivity: A new perspective on human brain function. J. Neurosci. Methods 323, 68-76 (2019).
2. Bouffard, N. R., Golestani, A., et al. Single voxel autocorrelation uncovers gradients of temporal dynamics in the hippocampus and entorhinal cortex during rest and navigation. BioRxiv (2021).
3. Coughlan, G. et al. Transcranial magnetic stimulation to the angular gyrus modulates the temporal dynamics of the hippocampus and entorhinal cortex. Accepted at Cerebral Cortex.
4. Golestani, A. M. et al. Brain function induces alteration in the autocorrelation of the fMRI signal. ISMRM (2021).
5. Gonzales-Castillo, J. et al. Tracking ongoing cognition in individuals using brief, whole-brain functional connectivity patterns. Proc. Natl, Acad, Sci. USA 112, 8762-8767 (2015).
Figures