3487
Evaluation of whole-brain oxygen metabolism in Alzheimer's disease using QSM and quantitative BOLD1Peking Union Medical College, Beijing, China, 2Department of Radiology, China–Japan Friendship Hospital, Beijing, China, 3Department of Biomedical Engineering, Cornell University, New York, NY, United States, 4Weill Cornell Medical College, Department of Radiology, New York, NY, United States, 5Department of Radiology, Weill Cornell Medical College, New York, NY, United States
Synopsis
Keywords: Alzheimer's Disease, Alzheimer's Disease
We assessed the whole-brain oxygen metabolism perturbations in AD using QSM and quantitative BOLD. mGRE data and QQ model was employed to calculate OEF and ASL data was used to reconstruct CBF map. The CMRO2 can be estimated from CBF and OEF based on Fick’s principle. Our results demonstrated a characteristic whole-brain hypoperfusion and hypometabolism pattern in AD, predominantly located within default-mode network. Additionally, decreased CBF and CMRO2 in substructures of bilateral hippocampus strongly correlated with global cognition. QQ model-based noninvasively quantitative measurements have a great potential to be complementary biomarkers for evaluating cognitive impairment in AD.Background and Purpose
Patients with Alzheimer's disease (AD) often present with a mixed pathology of vascular and metabolic changes, and vascular disease is considered a risk factor for AD (1). It’s hypothesized that the disruption of normal mitochondrial function and hypometabolic level of cerebral oxygen may appear much earlier in AD than other hallmark pathological changes. Oxygen extraction fraction (OEF), cerebral blood flow (CBF) and cerebral metabolic rate of oxygen (CMRO2) are crucial indicators of cerebral oxygen utilization, blood supply and energy consumption, respectively. Quantitative susceptibility mapping (QSM) plus quantitative blood oxygen level–dependent magnitude (QSM+qBOLD or QQ)-based model is a great tool for OEF measurement in clinical practice (2,3). However, to our knowledge, QQ-algorithm based OEF and CMRO2 mapping has not yet been applied in AD pathology evaluation.The purpose of this study was to evaluate the whole-brain pattern of OEF, CBF and CMRO2 perturbation in AD, and investigate the relationship between regional cerebral oxygen metabolism and global cognition.
Methods
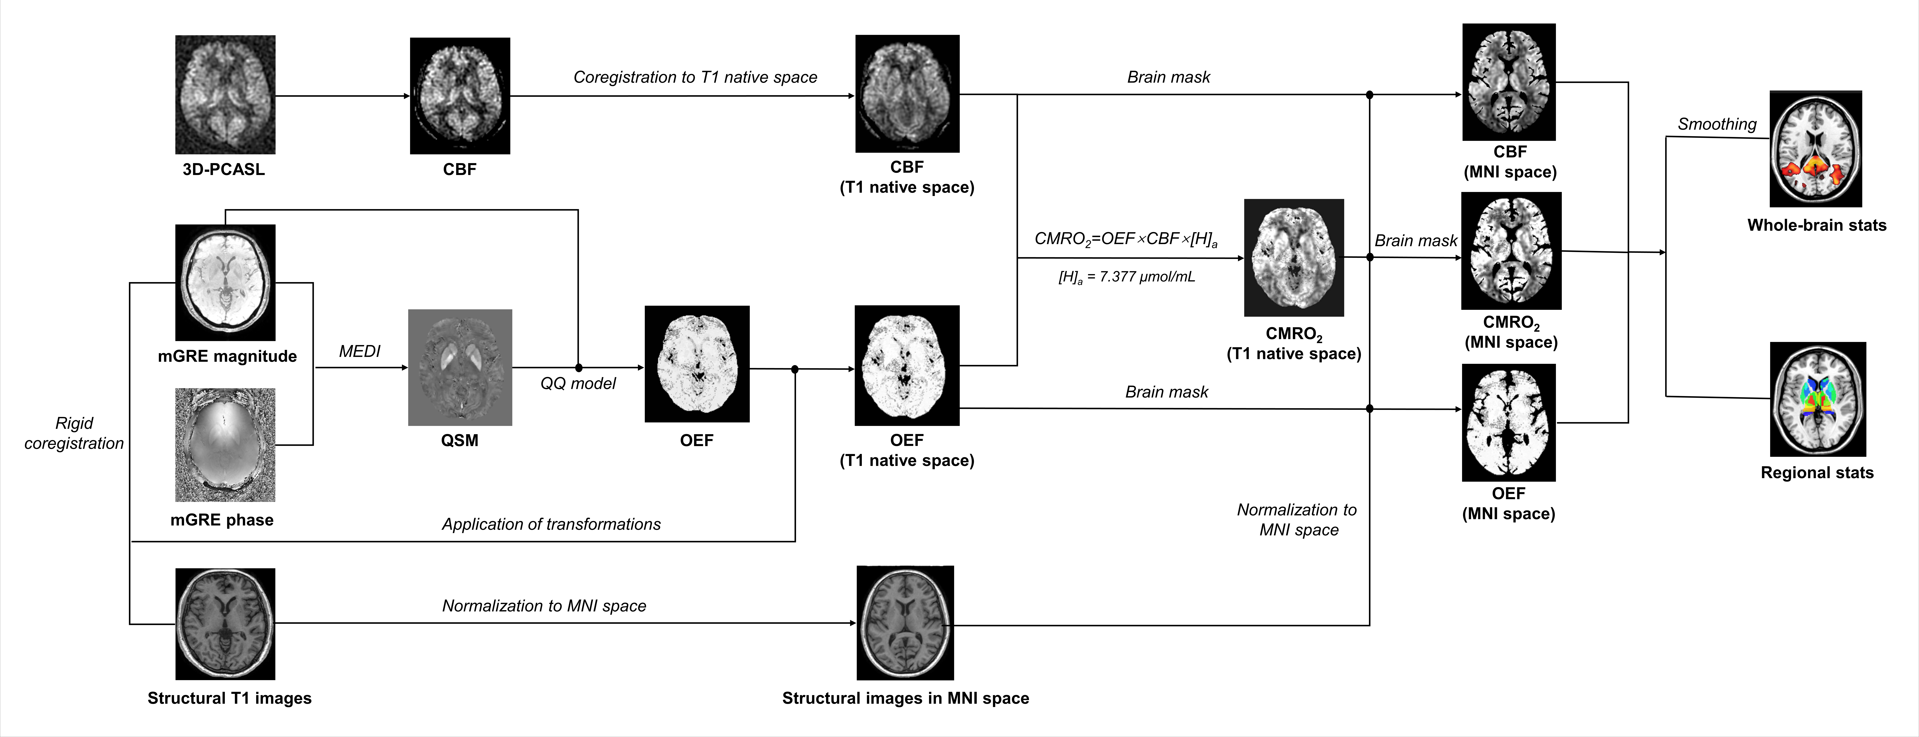
AD patients and age-matched healthy controls (HC) were prospectively recruited in this study. Mini-Mental State Examination (MMSE) was used to evaluate cognitive status for the entire cohort. All participants underwent MR examinations using a 3.0T MR scanner (Discovery MR750, General Electric) and an eight-channel head coil. The imaging protocol included a 3D T1-weighted fast spoiled gradient-echo sequence for anatomical imaging, a resting-state 3D pseudo-continuous arterial spin labeling (3D-PCASL) sequence with one post label delay for CBF calculation and a 3D gradient-echo multi-echo (3D-mGRE) sequence for QSM and OEF analyses. (1) 3D-mGRE: TE1st/ΔTE/ TE8th = 3.19 ms/2.37 ms/19.77 ms; TR= 22.9 ms; bandwidth = 62.5 Hz/pixel; slice thickness = 1.0 mm; FOV = 256 mm × 256 mm; voxel size = 1 × 1× 1 mm3; (2) 3D-PCASL: TR = 4,817 ms; TE =14.6 ms; flip angle=111°; PLD =1,525 ms; spiral in readout of 12 arms with 1024 sample points; slice thickness=4 mm; field FOV =240 mm×240 mm; voxel size=1.875×1.875×4 mm3.The entire postprocessing pipeline is shown in Figure 1.We applied advanced QQ-based model for OEF calculation. In short, the total field maps were estimated from a non-linear fit of mGRE phase data (4), and the mean magnitude image was used to generate the binary brain mask using the brain extraction tool in FSL. The local field maps were calculated using Laplacian boundary value (5) method to remove background field variation. QSM maps were generated using Morphology-enabled dipole inversion (MEDI) with automatic uniform cerebrospinal fluid (CSF) zero reference (MEDI+0) (6). The OEF maps were then estimated based on the QQ model with the combination analyses of phase signal on QSM and mGRE magnitude signal using qBOLD. To improve the robustness of QQ-based QEF against noise and the accuracy of OEF, the temporal clustering, tissue composition, and total variation algorithm (CCTV) was used(2).The CBF maps were reconstructed from the PCASL data using perfusion FuncTool in GE. According to Fick principle, CMRO2 maps were calculated using following formulation: CMRO2= CBF×OEF×[H]a. Whole-brain OEF, CBF and CMRO2 analyses were performed using FSL. The associations between these measures in 36 substructures of deep brain gray matter and MMSE score were assessed by partial correlation analysis.
Results
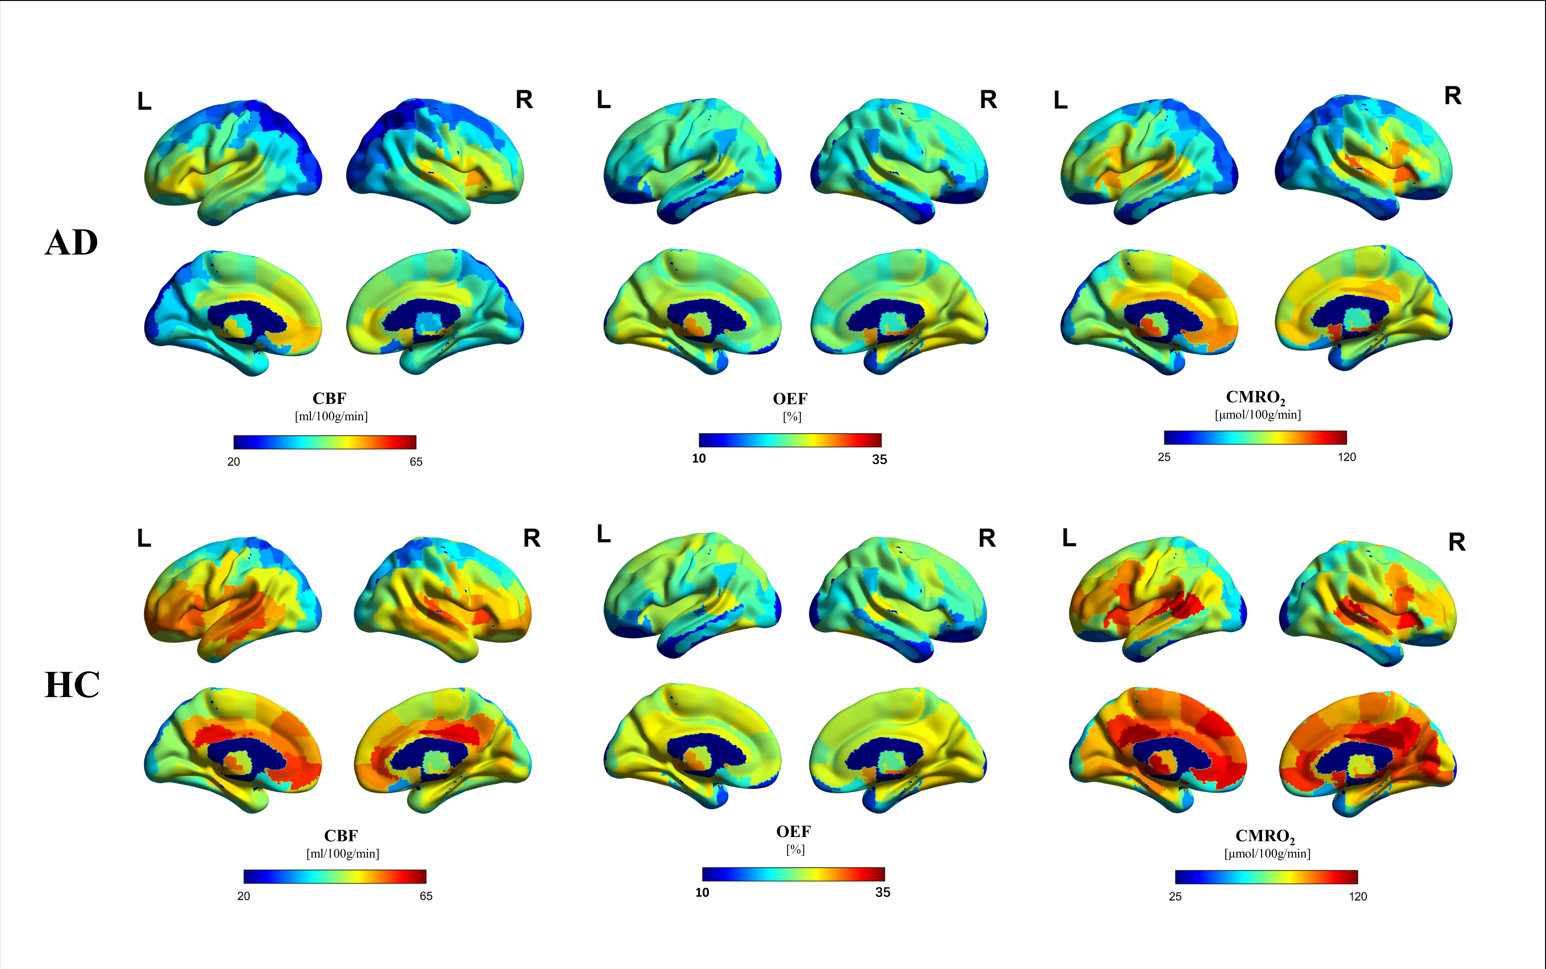
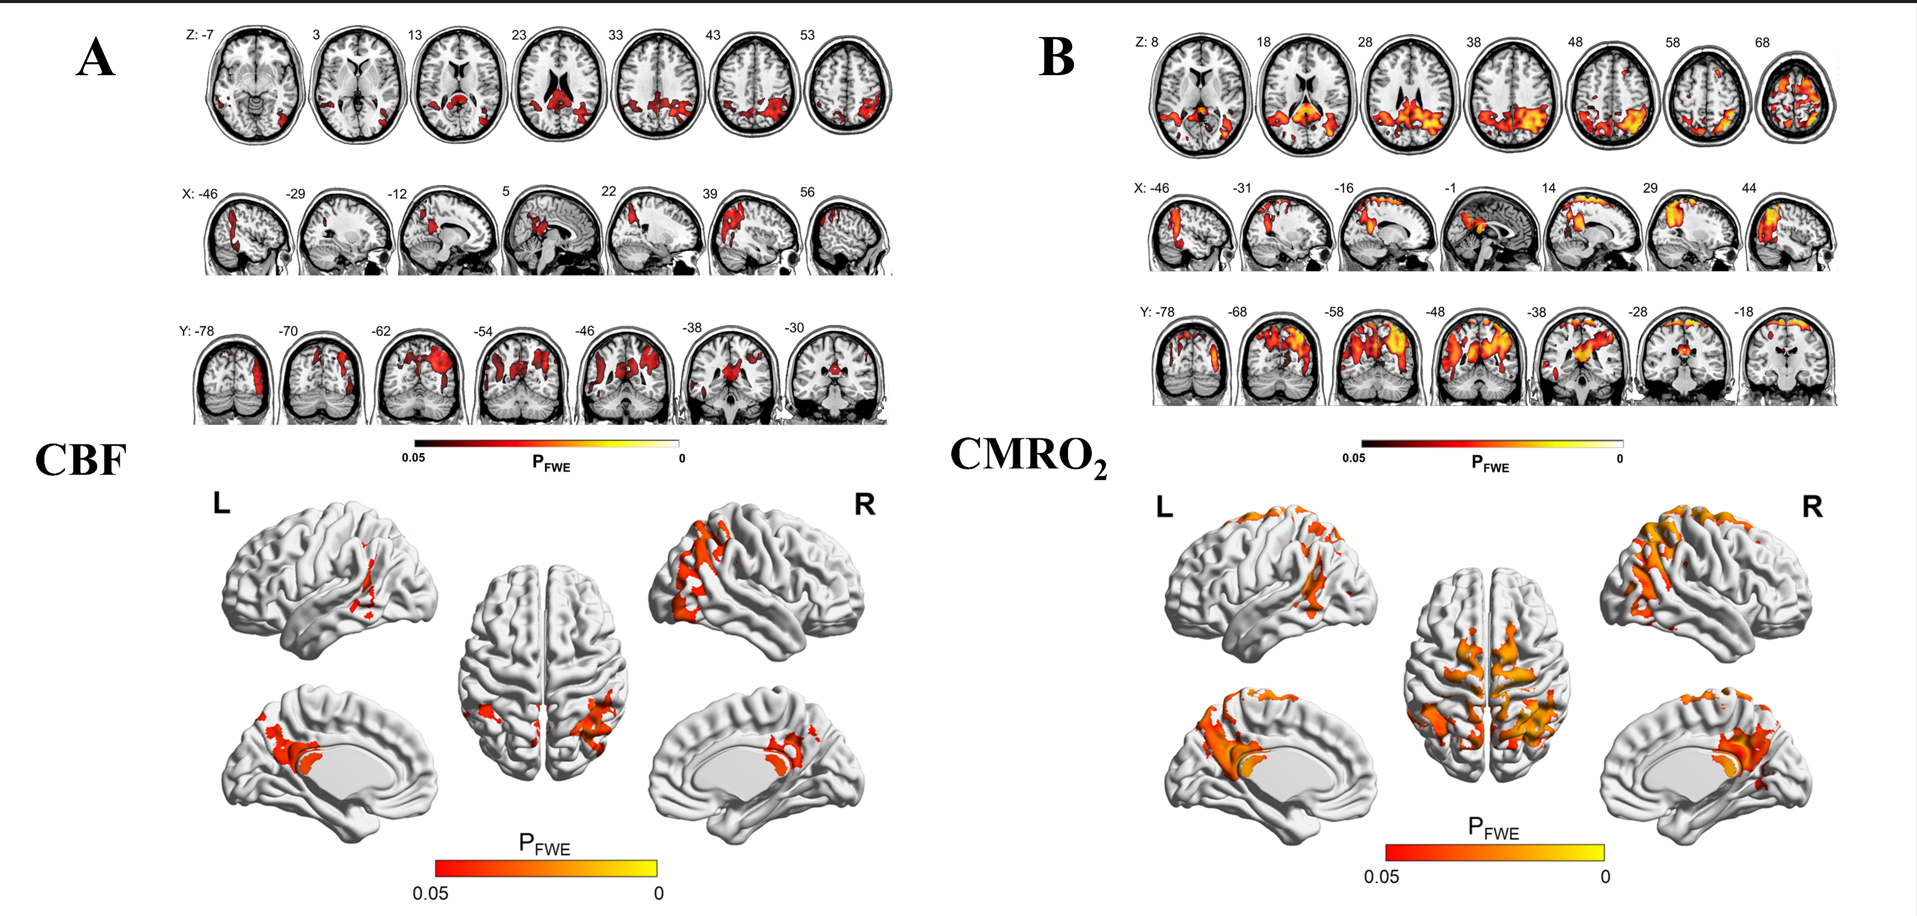
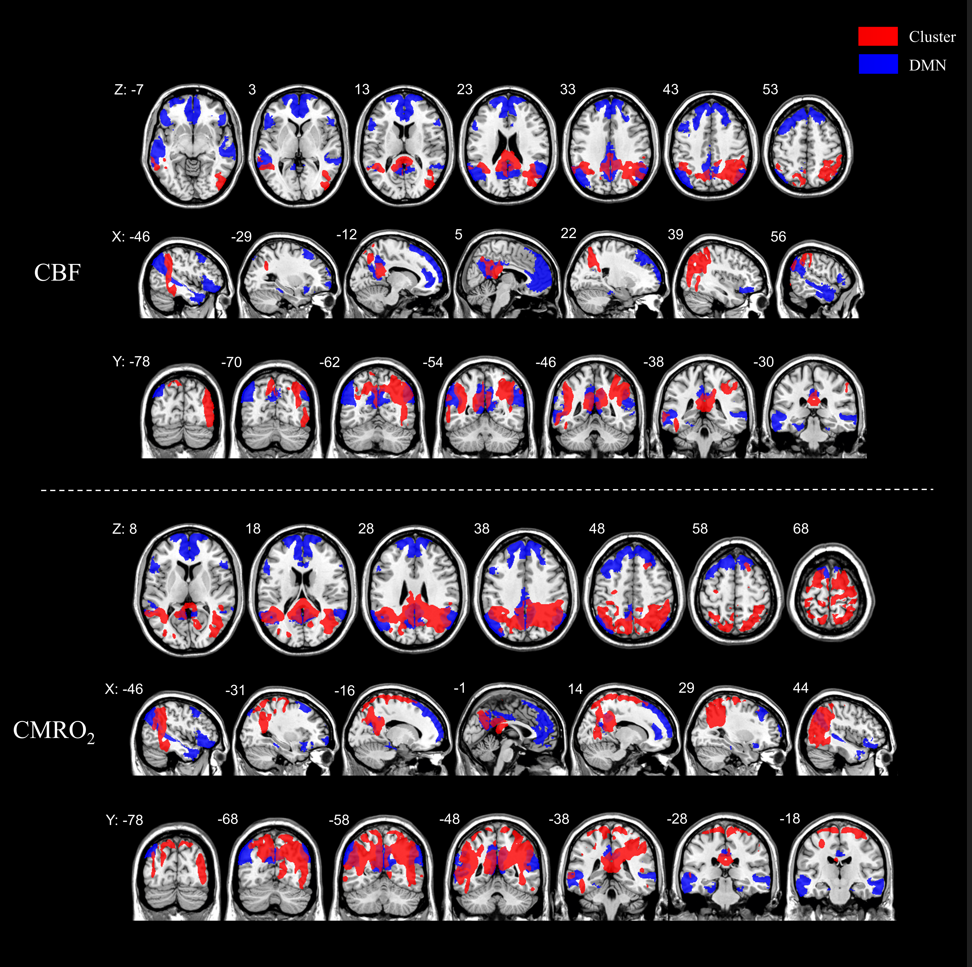
Twenty-six AD patients (mean age 67.9±7.0 years; 8 male) and 25 healthy controls (mean age 64.8±7.5 years; 7 male) were included in this study. The mean CBF, OEF and CMRO2 values of 246 cortical regions defined by the BNA246 atlas were shown in Figure2. The distributional patterns of CBF, OEF and CMRO2 across the whole-brain cortex were visually similar in AD to those in HC. In both AD and HC groups, the brain areas with relatively higher CBF, OEF and CMRO2 values were in the frontal and temporal lobes. Through the visual assessment of Figure2, cortical CBF and CMRO2 values were lower in AD than in HC. However, the OEF value shows little difference between AD and HC.We found CBF and CMRO2 values significantly decreased in AD compared with HC dominantly in bilateral precuneus and parietotemporal regions (p<0.05 corrected for multiple comparisons; Figure 3), which distributed a characteristic hypoperfusion and hypometabolism pattern within default-mode network (DMN)(Figure 4).
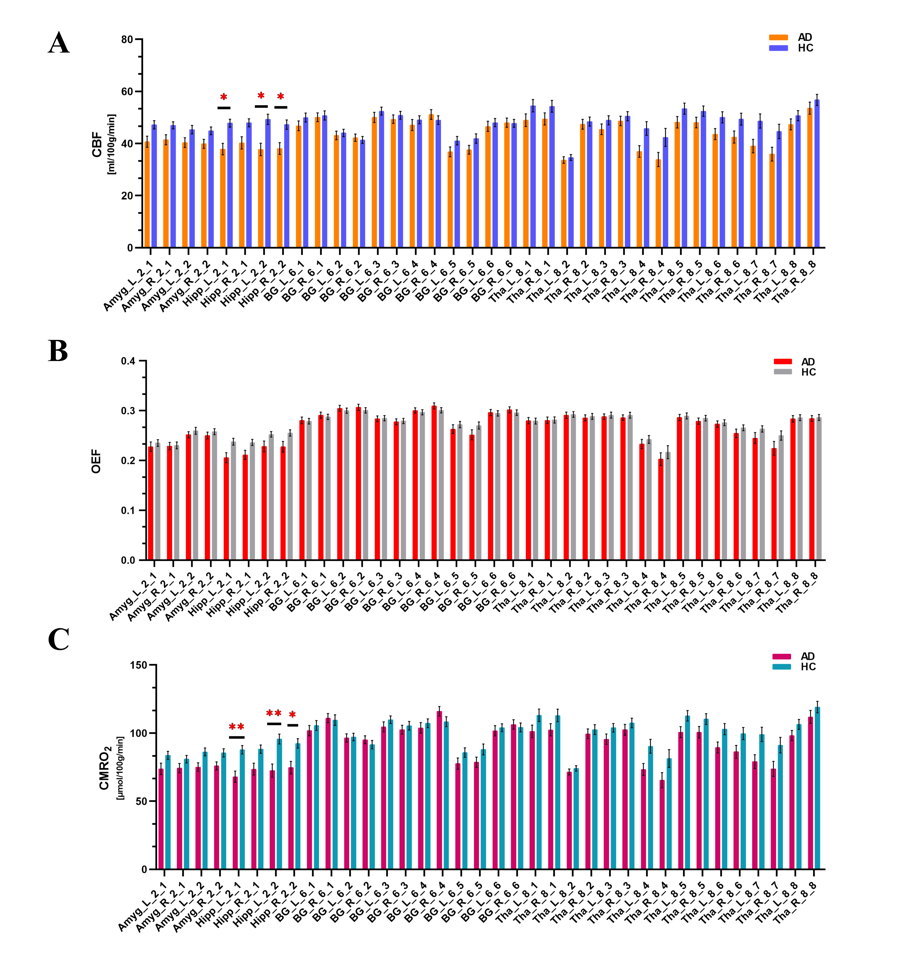
The regional analysis in deep gray matter showed that CBF and CMRO2 values decreased in bilateral caudal hippocampus and left rostral hippocampus (Figure 5). In the entire cohort, MMSE scores was positively correlated with CBF values in bilateral rostral (left rostral: r=0.56, P<0.001; right rostral: r=0.40, P=0.004) and caudal hippocampus (left caudal: r=0.49, P<0.001; right caudal: r=0.395, P=0.005) after multiple comparisons. Also, the MMSE score had a significantly positive association with CMRO2 in bilateral rostral (left rostral: r=0.57, P<0.001; right rostral: r=0.42, P=0.002) and caudal hippocampus (left caudal: r=0.54, P<0.001; right caudal: r=0.40, P=0.004) in the whole cohort with FDR correction.
Conclusions
CMRO2 imaged by the QQ method can be a potential biomarker for AD, which is more readily available in MR systems for clinical practice. CMRO2 in hippocampus may be a useful tool for monitoring cognitive impairment.Acknowledgements
The authors thank all participants in the study. The authors also thank Lizhi Xie (GE Healthcare, MR Research China, Beijing), who helped to optimize the MR scanning protocol.References
(1) Kivipelto M, Helkala EL, Laakso MP, Hänninen T, Hallikainen M, Alhainen K, Soininen H, Tuomilehto J, Nissinen A. Midlife vascular risk factors and Alzheimer's disease in later life: longitudinal, population based study. BMJ. 2001 Jun 16;322(7300):1447-51.
(2) Cho J, Spincemaille P, Nguyen TD, Gupta A, Wang Y. Temporal clustering, tissue composition, and total variation for mapping oxygen extraction fraction using QSM and quantitative BOLD. Magn Reson Med. 2021 Nov;86(5):2635-2646.
(3) Cho J, Lee J, An H, Goyal MS, Su Y, Wang Y. Cerebral oxygen extraction fraction (OEF): Comparison of challenge-free gradient echo QSM+qBOLD (QQ) with 15O PET in healthy adults. J Cereb Blood Flow Metab. 2021 Jul;41(7):1658-1668.
(4) Liu T, Wisnieff C, Lou M, Chen W, Spincemaille P, Wang Y. Nonlinear formulation of the magnetic field to source relationship for robust quantitative susceptibility mapping. Magn Reson Med. 2013 Feb;69(2):467-76.
(5) Zhou D, Liu T, Spincemaille P, Wang Y. Background field removal by solving the Laplacian boundary value problem. NMR Biomed. 2014 Mar;27(3):312-9.
(6) Liu Z, Spincemaille P, Yao Y, Zhang Y, Wang Y. MEDI+0: Morphology enabled dipole inversion with automatic uniform cerebrospinal fluid zero reference for quantitative susceptibility mapping. Magn Reson Med. 2018 May;79(5):2795-2803.
Figures