3481
Reproducibility of quantitative 1H-decoupled, NOE-enhanced 31P-MRS in the human brain at 3 T.1Neuro-SysMed & Mohn Medical Imaging- and Visualization Center (MMIV), Bergen, Norway, 2Neuro-SysMed & University of Bergen, Bergen, Norway, 3Haukeland University Hospital, Bergen, Norway, 4University of Bergen, Bergen, Norway, 5Mohn Medical Imaging- and Visualization Center (MMIV), Bergen, Norway, 6Neuro-SysMed & University of Bergen & Haukeland University Hospital, Bergen, Norway
Synopsis
Keywords: Data Analysis, Spectroscopy, 31P
1H-decoupled NOE-enhanced 31P-MRS has promising applications in the diagnosis and stratification of neurodegenerative diseases such as Alzheimer's disease, Parkinson's disease and amytrophic lateral sclerosis (ALS) due to its ability to longitudinally and noninvasively measure changes to cell metabolism and energy conversion, which is heavily involved in these diseases. To aid clinical translation, this study focuses on assessing the reproducibility of 1H-decoupled NOE-enhanced 31P-MRS by measuring the resonances of metabolites involved in neural energy metabolism.Introduction
1H-decoupled, NOE-enhanced 31P Magnetic Resonance Spectroscopy (MRS) has recently seen renewed interest due to its ability to non-invasively assess the energy status of the human brain. Metabolites crucial to cellular energy conversion such as nicotinamide adenine dinucleotide (NAD) and adenosine triphosphate (ATP) are both identifiable and quantifiable by 31P-MRS1,2. This has promising implications in research on neurodegenerative disorders such as Parkinson’s disease, Alzheimer’s disease and amyotrophic lateral sclerosis.In this study 31P-MRS with 1H decoupling and NOE-enhancement schemes was used to measure the resonances of the common brain metabolites phosphocreatine (PCr), ATP and NAD in a healthy individual at several timepoints over 24 hours in a clinical setting to investigate the reproducibility of the measurements as well as any possible biological fluctuations.
Methods
One individual underwent 31P-MRS in a 3 T Biograph mMR scanner (Siemens Healthineers, Germany) using a dual-tuned 1H/31P birdcage coil (Rapid Biomed, Germany). A total of 9 scans was carried out over the course of 24 hours at t = 0, 0.5, 1, 2, 3, 4, 6, 8 and 23.5 hrs.31P spectroscopy data were acquired using a 3D chemical shift imaging (CSI) FID sequence with WALTZ4 1H decoupling and continuous wave nuclear Overhauser effect (NOE) enhancement3,4. A CSI grid with an 8 x 8 matrix and nominal voxel size of 30 x 30 x 80 mm3, 1024 samples, readout length = 512 ms, 1000 Hz bandwidth, field of view (FOV) = 240 x 240 x 80 mm3, TE/TR = 2.3 ms / 3.0 s, 10 averages, flip angle = 90 degrees and total acquisition duration of 14.5 minutes, were used. Rectangular NOE pulses of 10 ms length, interpulse delay 1ms, train length 10 prior and WALTZ4 decoupling (2ms pulses, 180 deg. flip angle) were applied prior to 31P-excitation and during the first half of the acquisition window respectively. The FOV was centered on the brain midline and aligned parallel to the anterior and posterior commissure.
The spectral data was analyzed in MATLAB using the FID-A and OXSA toolboxes5,6. Two different voxel selection methods were used and compared in terms of their effect on reproducibility. The first method selected voxels from the whole brain, while the second selected voxels restricted to the occipital lobe. The spectral data was normalized with respect to PCr, which is assumed to be stable and well-maintained in tissue.
Of note, two of the measurements, no. 4 & 5,(t = 2 hrs, 3 hrs) appeared to be outliers and were excluded for comparison with the whole data set.
Results
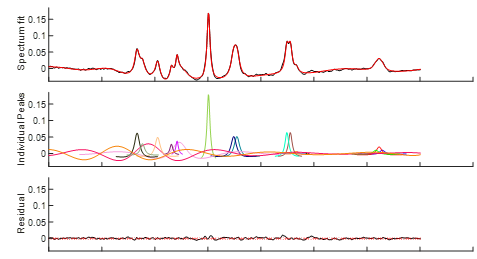
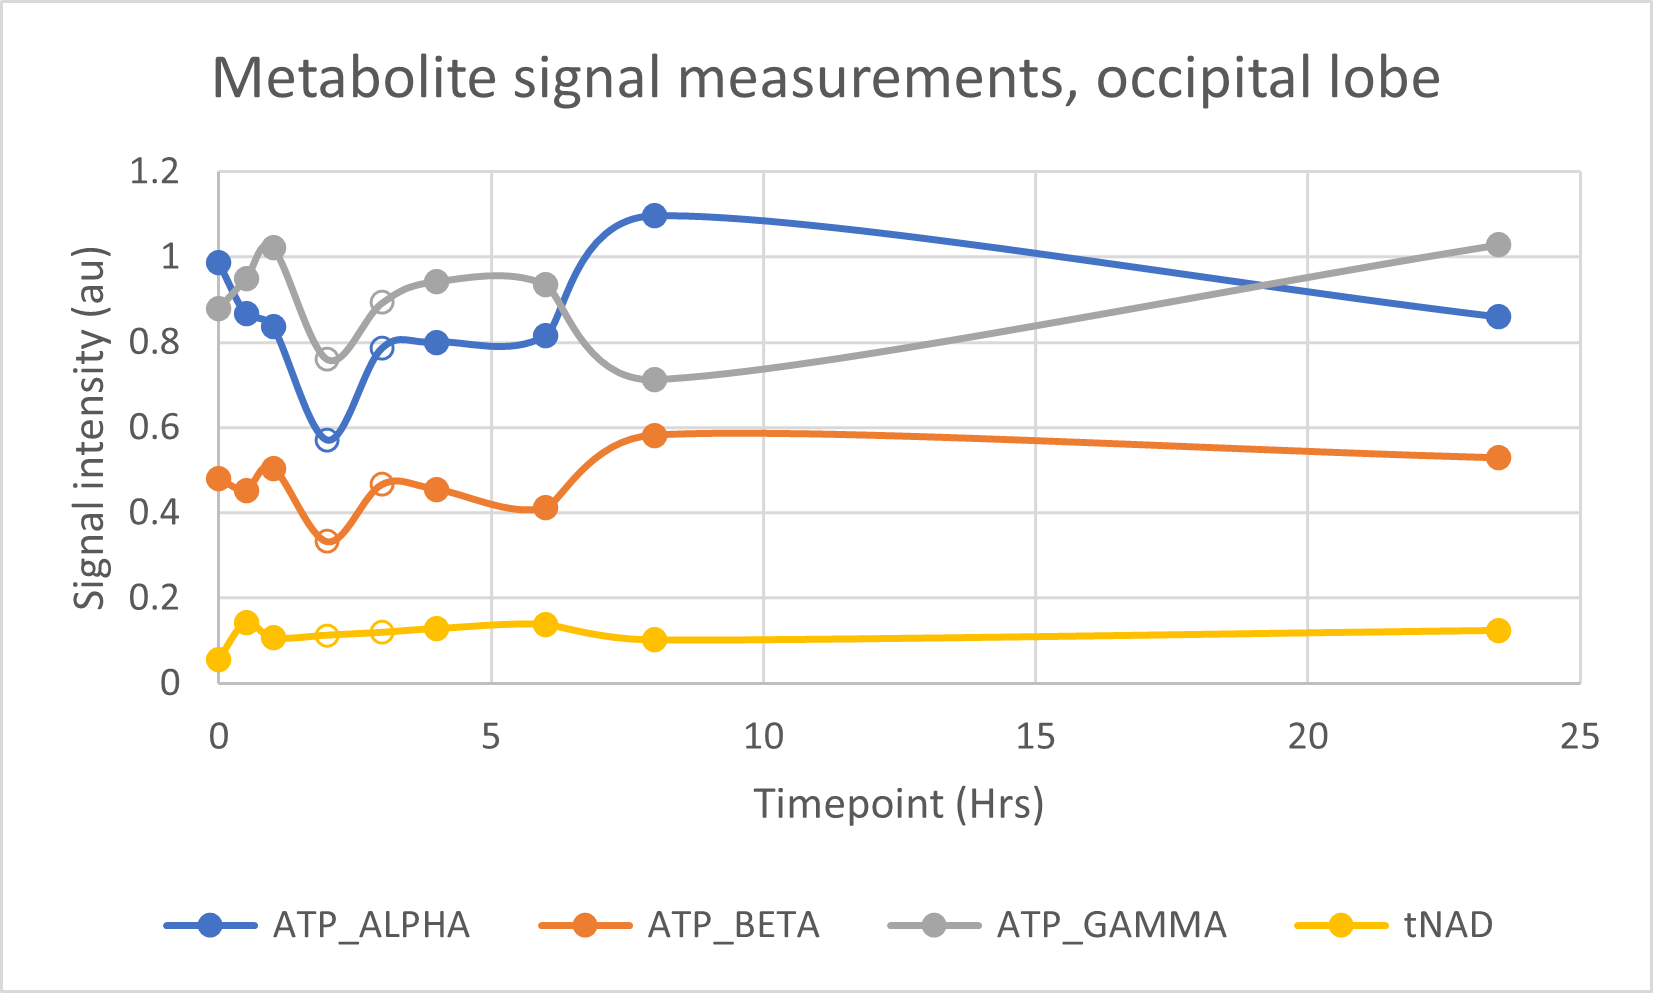
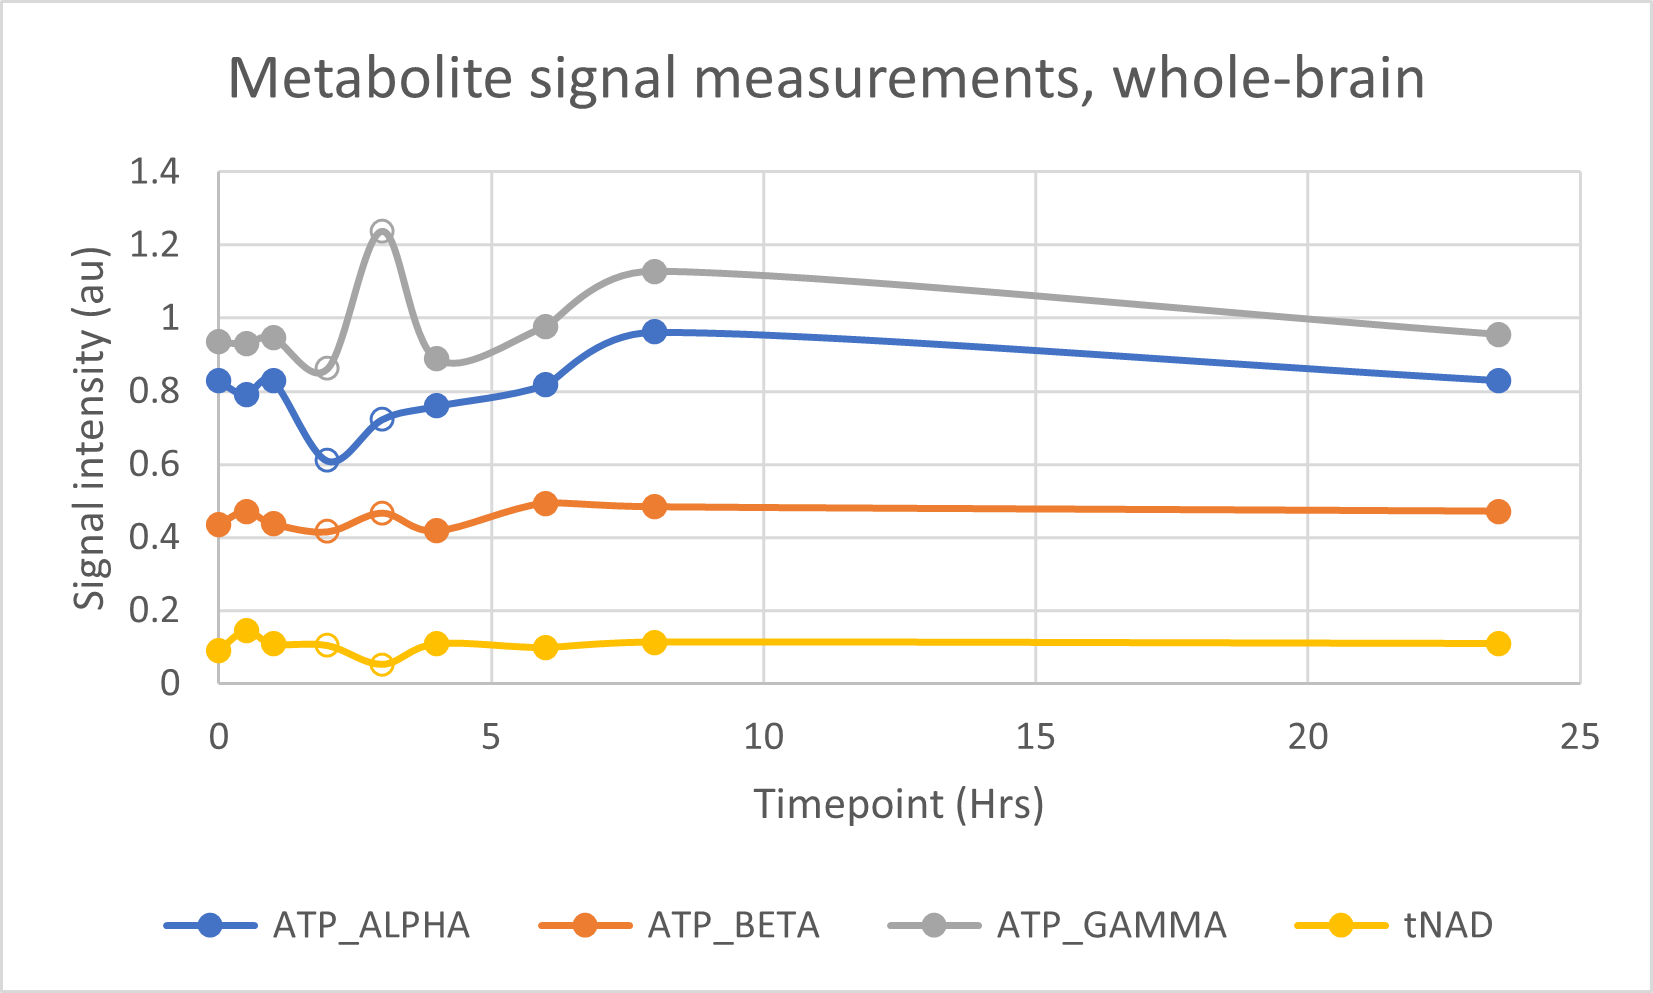
The MR spectrum in Figure 1 shows, among other peaks, the three ATP (α-, β-and γ-) resonances. They appear to the right of the dominant PCr singlet in the order γ – α – β. The NAD resonances are of very low intensity due to their low in vivo concentration, and they also overlap with the α-ATP resonance. These resonances are observed as a ‘shoulder’ on the α-ATP resonance.Figures 2 & 3 show the measured metabolite signals normalized with respect to PCr as a function of time for the whole-brain- and occipital lobe voxel selection methods, respectively.
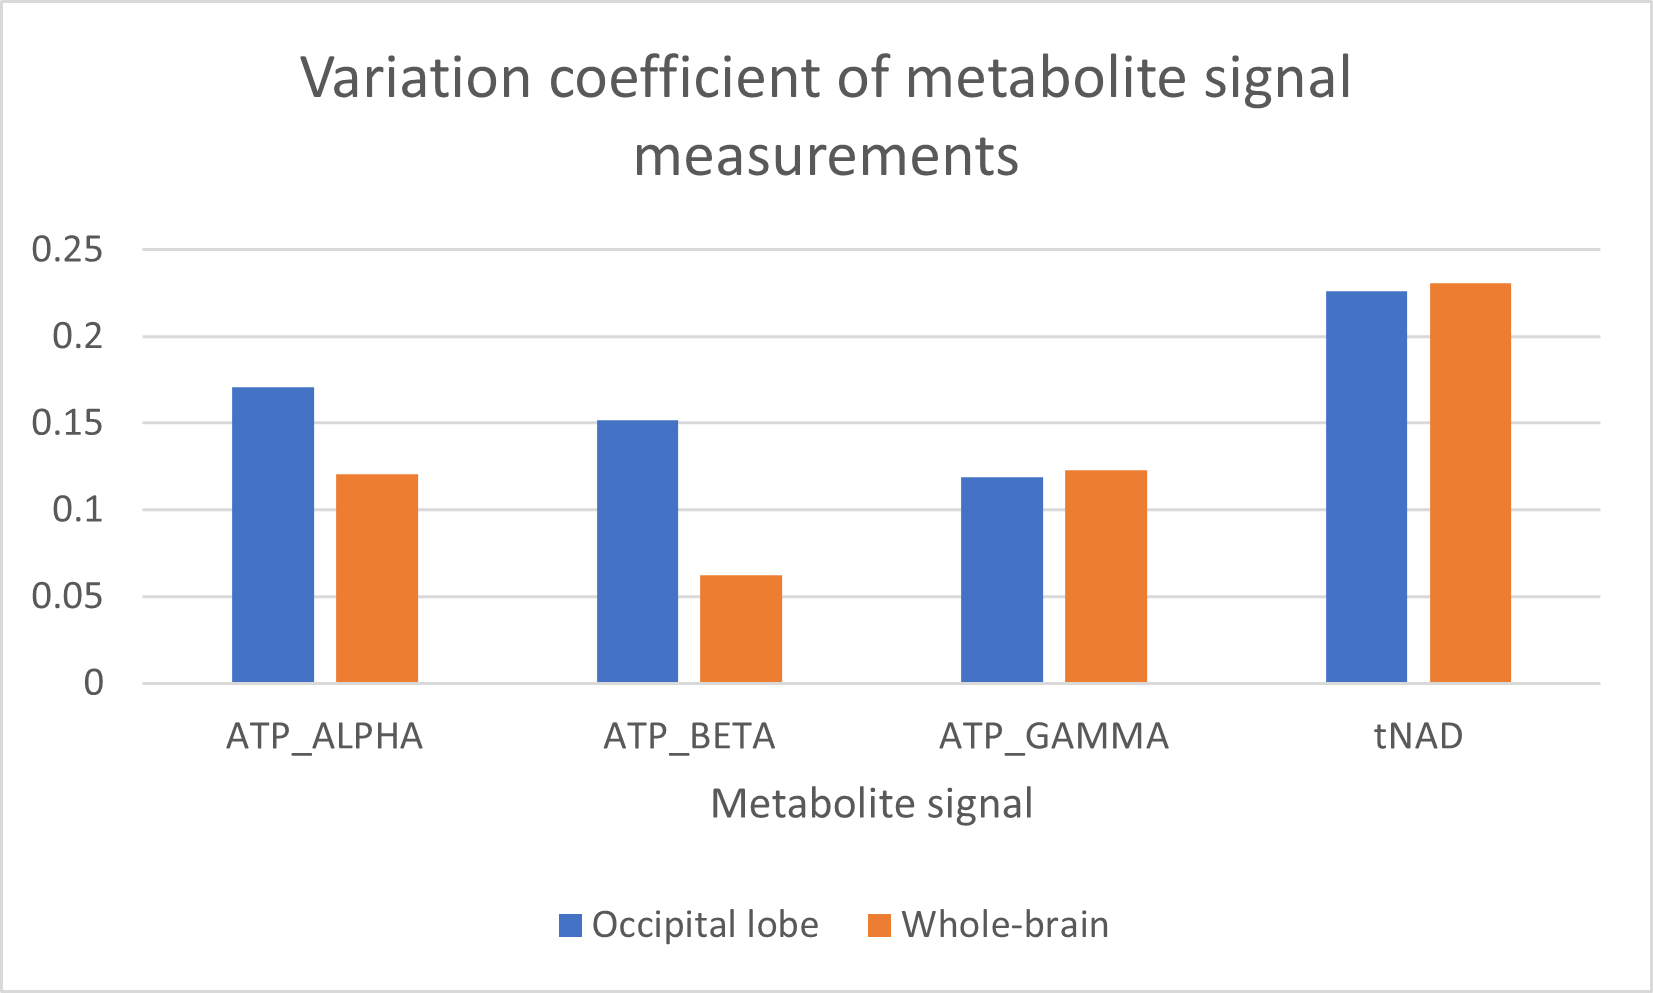
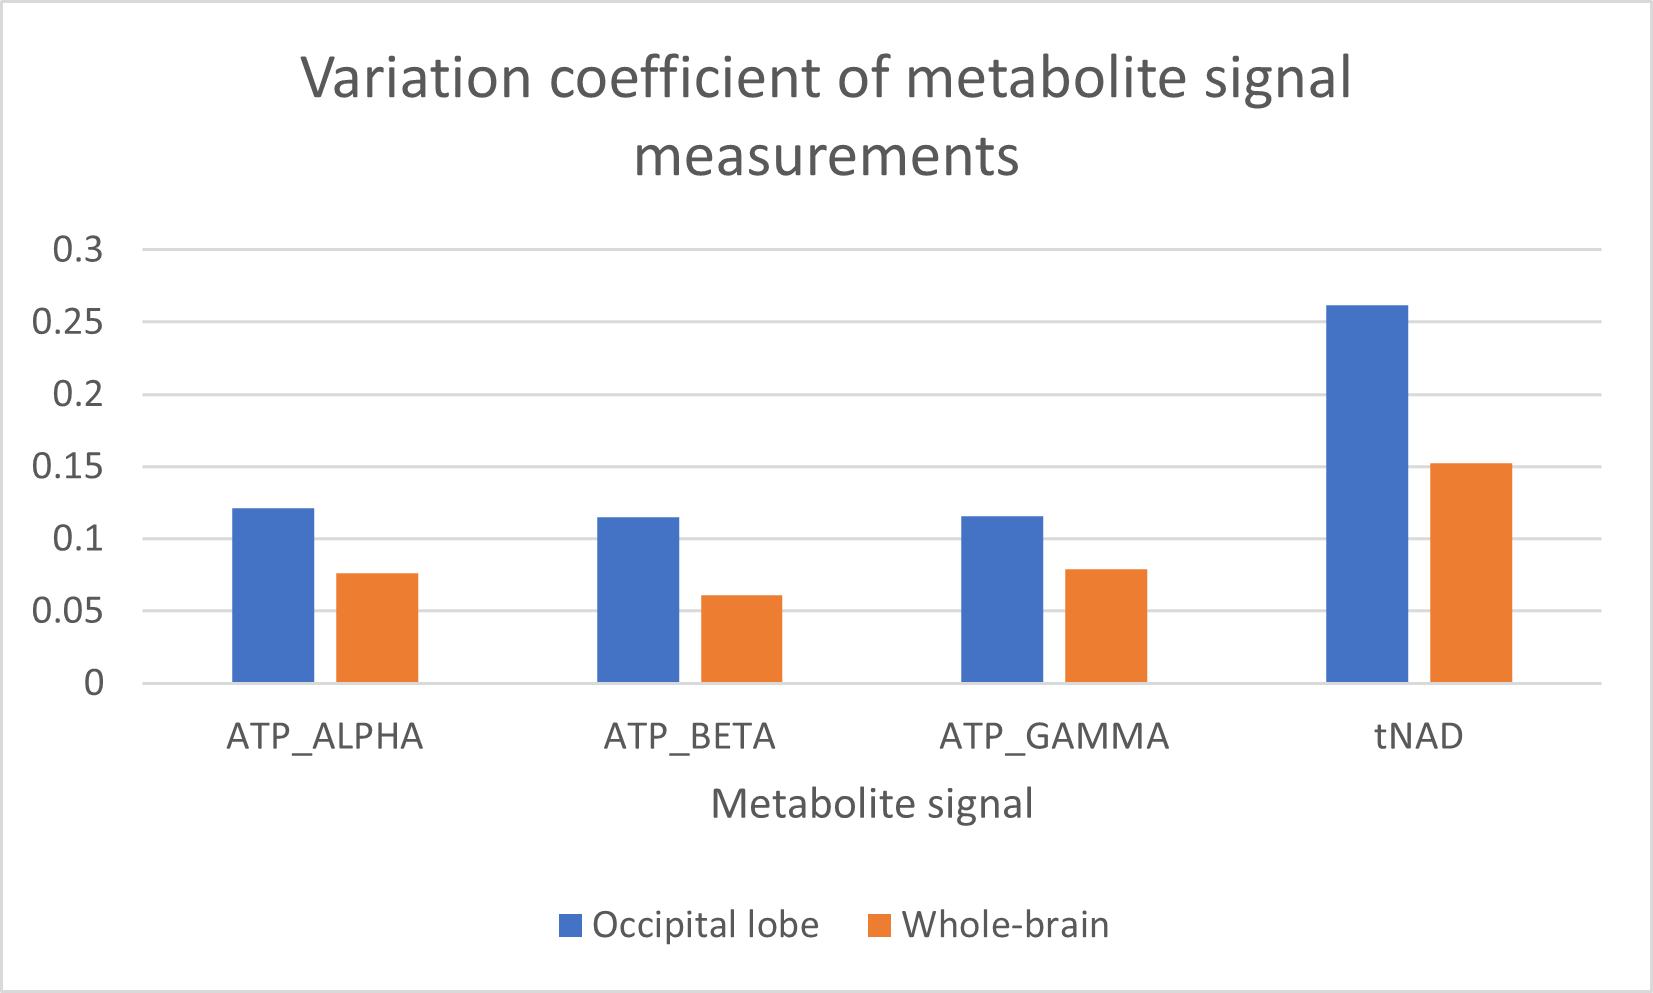
The measured α- and β-ATP signals varied the most based on voxels from the occipital lobe, while γ-ATP had similar variation coefficients for both voxel selection types, with a slightly higher variance for whole brain voxel selection (Figure 4).
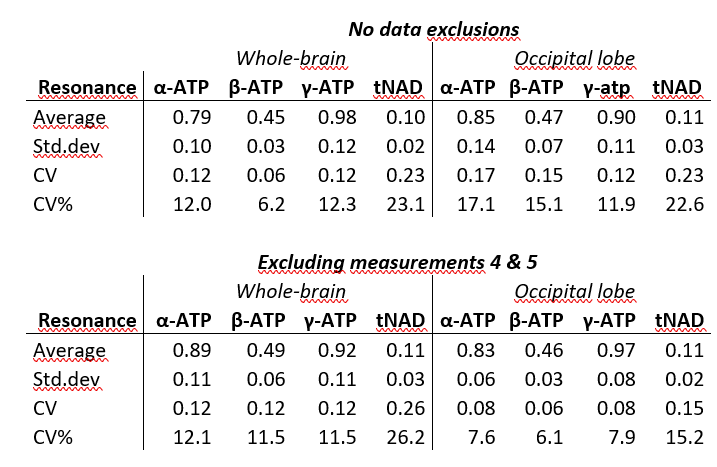
Excluding measurements 4 & 5 reduced the variation coefficients of the ATP and tNAD signal measurements. The whole-brain voxel selection result in the lowest variation in measurements. Data exclusion caused a small increase in tNAD measurement variation in the occipital lobe (Figure 5). A full description of the obtained measured resonance averages, standard deviations and variation coefficients is given in Figure 6.
Discussion
The variation in the tNAD signal is quite high. One possible explanation for this is the signal overlap between tNAD and α-ATP. It is expected that the lower α-ATP signal variation from the whole-brain voxel selection is responsible for a lowered tNAD variation coefficient in the analysis featuring data exclusion.The two different voxel selection methods were expected to yield different repeatability. While the whole-brain voxel selection method allows for a larger sample volume, it also introduces local magnetic field inhomogeneities from the nasal cavity, cerebrospinal fluid etc. that potentially negatively impacts the signal. Interestingly, the whole-brain voxel selection method featured the study's lowest variation when excluding measurements 4 & 5 from the analysis.
Conclusion
This study reported the reproducibility of 31P-MRS expressed by variation coefficients for NAD and ATP, respectively. The lowest variation was obtained by selecting voxels from the whole brain as well as excluding two suspected outliers.Any longitudinal in vivo MRS study will feature some degree of variance caused by differences in positioning, shimming and transmit gain calibrations between each measurement. Subject movement during the acquisition, as well as low spectral resolution at 3 T, also influence the reproducibility of in vivo 31P-MRS. Given that there are only 9 measurements, outliers had a big impact on the dataset. It is expected that the reproducibility of the measurements will improve by increasing the sample size, as well as achieving a better NAD signal discrimination.
Acknowledgements
MMIV is funded by the Trond Mohn Foundation. Neuro-SysMed is funded by the Research Council of Norway (project number 288164), the Haukeland University Hospital, the University of Bergen, the Haraldsplass Deaconess Hospital and Lawson Health Research Institute.References
(1) Zhu, X.-H.; Lu, M.; Lee, B.-Y.; Ugurbil, K.; Chen, W. In Vivo NAD Assay Reveals the Intracellular NAD Contents and Redox State in Healthy Human Brain and Their Age Dependences. Proc. Natl. Acad. Sci. U. S. A. 2015, 112 (9), 2876–2881. https://doi.org/10.1073/pnas.1417921112.
(2) Lu, M.; Zhu, X.-H.; Zhang, Y.; Chen, W. Intracellular Redox State Revealed by in Vivo (31) P MRS Measurement of NAD(+) and NADH Contents in Brains. Magn. Reson. Med. 2014, 71 (6), 1959–1972. https://doi.org/10.1002/mrm.24859.
(3) Peeters, T. H.; van Uden, M. J.; Rijpma, A.; Scheenen, T. W. J.; Heerschap, A. 3D 31P MR Spectroscopic Imaging of the Human Brain at 3 T with a 31P Receive Array: An Assessment of 1H Decoupling, T1 Relaxation Times, 1H‐31P Nuclear Overhauser Effects and NAD+. Nmr Biomed. 2021, 34 (5), e4169. https://doi.org/10.1002/nbm.4169.
(4) Shaka, A. J.; Keeler, J.; Freeman, R. Evaluation of a New Broadband Decoupling Sequence: WALTZ-16. J. Magn. Reson. 1969 1983, 53 (2), 313–340. https://doi.org/10.1016/0022-2364(83)90035-5.
(5) FID-A – Advanced MR Spectroscopy Processing and Simulation – Open Source Imaging.
(6) Purvis, L. A. B.; Clarke, W. T.; Biasiolli, L.; Valkovič, L.; Robson, M. D.; Rodgers, C. T. OXSA: An Open-Source Magnetic Resonance Spectroscopy Analysis Toolbox in MATLAB. PLOS ONE 2017, 12 (9), e0185356. https://doi.org/10.1371/journal.pone.0185356Figures