3480
4D CSF flowmetry to map brain-wide slow CSF flow dynamics and patterns in subarachnoid space1Athinoula A. Martinos Center for Biomedical Imaging, MGH, Charlestown, MA, United States, 2Department of Radiology, Harvard Medical School, Charlestown, MA, United States, 3Harvard-MIT Health Sciences and Technology, MIT, Cambridge, MA, United States, 4High Field MR Centre, Medical University of Vienna, Vienna, Austria, 5Department of Biomedical Engineering, Boston University, Cambridge, MA, United States
Synopsis
Keywords: Neurofluids, Brain
Cerebrospinal fluid (CSF) flow is a key component of the brain’s waste clearance system. However, little is known about the brain-wide CSF flow in subarachnoid space (SAS), due to the low sensitivity of MRI-based flow imaging methods for measuring slow flow. Here, we proposed a phase-contrast 4D CSF flowmetry method using a pulsed-gradient-spin-echo EPI sequence, providing high sensitivity and efficiency to measure brain-wide slow CSF flow dynamics in SAS. Whole-brain CSF flow dynamics including velocity and direction changes were measured and our preliminary data suggest that both cardiac pulsation and respiration can drive CSF flow in both ventricles and SAS.Introduction
Cerebrospinal fluid (CSF) flow is a key component of the brain’s waste clearance system. However, our understanding of human CSF flow dynamics is limited to the ventricles1-4, and little is known about the brain-wide subarachnoid space (SAS) surrounding the cerebrum, which provides routes for CSF to move through the whole brain. This is mainly attributed to the low sensitivity of the MRI-based flow imaging method for measuring the slow flow present in the SAS and perivascular space (PVS).To investigate flow dynamics across the whole brain and provide further insight into regions with slow flow, we propose a CSF flowmetry method based on phase-contrast (PC)5 MRI that can measure 4D CSF flow with high sensitivity and spatiotemporal resolution. A optimized pulsed-gradient-spin-echo (PGSE)6 EPI sequence was employed to provide flexible velocity encoding (VENC)7,8 and increase the sensitivity to map slow flow, with high acquisition efficiency and robustness to physiological artifacts. Background phase removal and retrospective gating are applied to generate robust 4D flow maps. In this study, the cardiac pulsation and respiration coupled CSF flow dynamics in ventricles and SAS were evaluated at 7T across multiple subjects, revealing consistent brain-wide CSF flow dynamics and patterns.
Methods
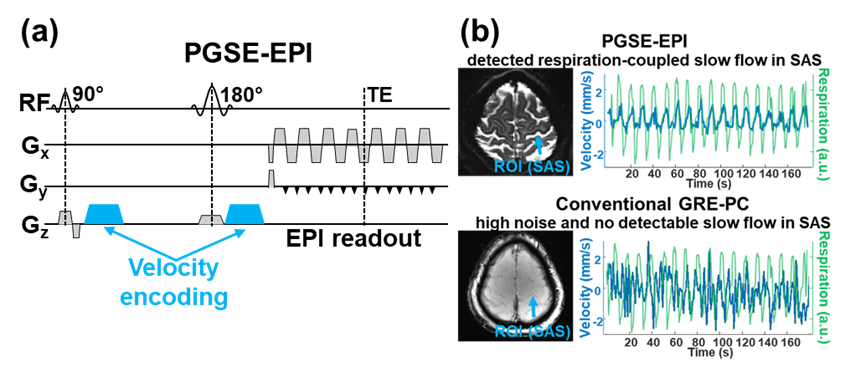
All data were acquired on a 7T Siemens Terra scanner with an inhouse-built 64-channel head array coil on healthy subjects (N=5) after providing informed consent.A PGSE-EPI sequence was chosen to provide: i) flexibility to achieve the low VENC (10mm/s or lower)7,8 needed to measure slow flow, while reducing undesirable high diffusion contrast and associated signal loss by using a long velocity encoding time8; ii) fast sampling by single-shot EPI readouts for snapshot velocity encoding and reduced shot-to-shot variations; iii) higher robustness to physiological noise in the phase (e.g., breathing-related B0 field variation) by using spin-echo over gradient-echo; and iv) strong T2 weighting from long TE values to reduce the signal from blood and parenchyma for improved specificity to CSF. The ASPIRE coil combination9 was used to improve the quality of the phase-valued images. To minimize the effect of phase variations caused by systemic physiology, background phase removal was performed by removing the spatially low-polynomial-order phase of each dynamic independently without temporal filtering. For whole-brain 4D CSF flow imaging, retrospective gating was employed by grouping each EPI slice based its acquisition timing and cardiac/respiratory recordings.
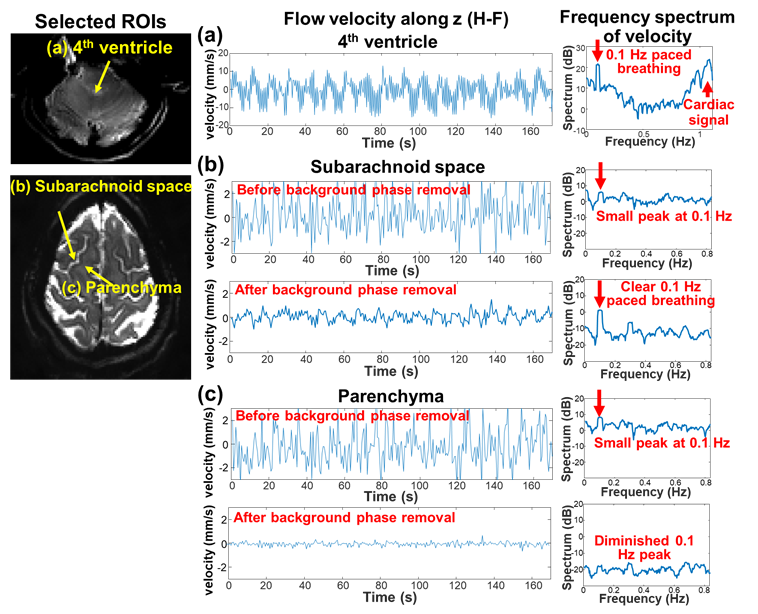
High temporal resolution scans in 4th ventricle and SAS were acquired with a paced breathing task (0.1 Hz, 5 s breathe in, and 5 s breathe out). To investigate real-time velocity and its frequency spectrum, short TR values (450ms for 4th ventricle scan, 600ms for SAS scan) were used with small coverage (4 slices). Other acquisition parameters: resolution = 1.5×1.5×5mm3, VENC = 30mm/s for the 4th ventricle scan, and 10mm/s for the SAS scan.
Whole-brain 4D CSF flow imaging data were acquired in 3 healthy subjects with paced breathing tasks. Cardiac and respiratory cycles were recorded using external sensors for retrospective gating. Three velocity encoding directions (x,y,z) were acquired using the following parameters: resolution = 1.5×1.5×3 mm3, 36 slices, VENC = 10mm/s, TR/TE = 2100/83ms, Multiband factor = 2, in total 12 minutes.
Results
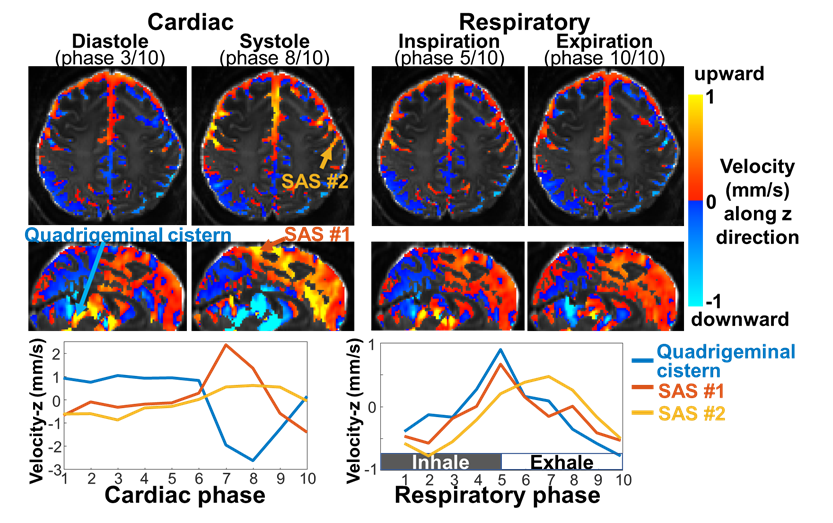
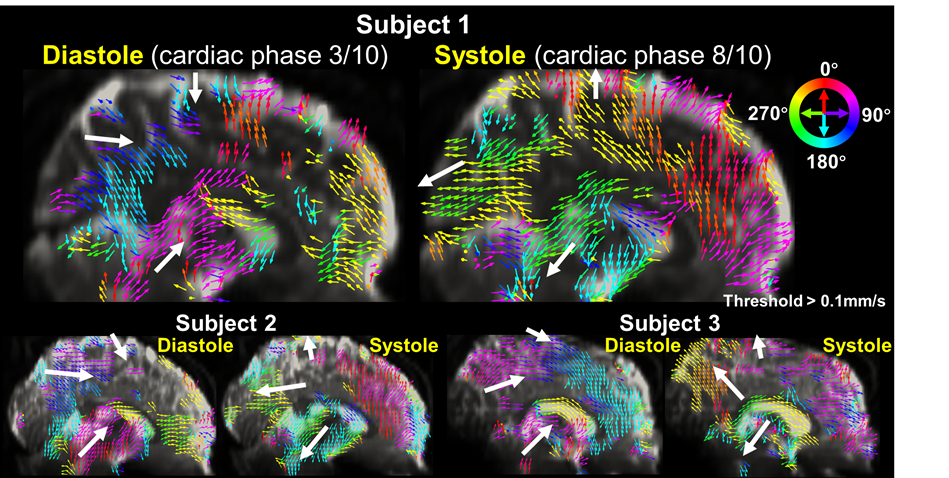
Fig.1 shows the sequence diagram of PGSE-EPI, and its measured respiration-coupled slow CSF flow signals in SAS. In contrast, conventional GRE-PC method was not able to measure such slow CSF flow dynamics due to its low sensitivity and vulnerability to physiological noise. Fig.2 shows that in the high temporal resolution scan, clear respiration-associated velocity changes are observed using the proposed approach in both 4th ventricle (Fig.1a, velocity ~10mm/s) and in SAS (Fig.1b, velocity ~1mm/s). Fig.2 b&c also suggests that background phase removal effectively increased the SNR of the flow measurement and removed confounding physiological noise, such as breathing-related background phase variations.Fig.3 shows example maps and time-series plots of z-directed (H-F) flow velocity across cardiac and respiratory cycles. Both ventricles and SAS show strong and rapid CSF flow changes across cardiac phases (e.g., upward/downward flow during diastole/systole in the cistern and ventricles), while relatively weaker (smaller amplitude) and slower changes are observed with the respiratory cycle. Moreover, different time-delays of the velocity change are also observed in different SAS regions (Fig.3 bottom). The directions of CSF flow across the whole brain were obtained using 3-directional velocity encoding. Fig.4 shows a movie of the color-coded vector field map (normalized vector length) and the velocity map highlighting the change of flow direction and velocity across a cardiac cycle. The flow directions in the ventricles are consistent with previous literature3 (e.g., inflow into the brain during diastole and outflow during systole). The observed flow patterns and direction changes in SAS are consistent across subjects as shown in Fig.5.
Discussion & Conclusion
The proposed 4D CSF flowmetry using PC-PGSE provides high sensitivity and efficiency to measure brain-wide CSF flow dynamics in SAS, and help gain new insights of the CSF physiology in health and disease. Our preliminary data indicate that both cardiac pulsation and respiration drive CSF flow in ventricles and SAS, and cardiac pulsation introduces stronger and more rapid CSF flow changes than respiration in most areas.Acknowledgements
This work was supported by the NIH (R01AT011429, R01EB019437, P41EB030006) and the instrumentation Grants (S10-OD023637).References
1 Markenroth Bloch, K., Toger, J. & Stahlberg, F. Investigation of cerebrospinal fluid flow in the cerebral aqueduct using high-resolution phase contrast measurements at 7T MRI. Acta Radiol 59, 988-996, doi:10.1177/0284185117740762 (2018).
2 Enzmann, D. R. & Pelc. Cerebrospinal fluid flow measured by phase-contrast cine MR. AJNR Am J Neuroradiol 14, 1301-1307 (1993).
3 Nitz, W. et al. Flow dynamics of cerebrospinal fluid: assessment with phase-contrast velocity MR imaging performed with retrospective cardiac gating. Radiology 183, 395-405 (1992).
4 Chen, L., Beckett, A., Verma, A. & Feinberg, D. A. Dynamics of respiratory and cardiac CSF motion revealed with real-time simultaneous multi-slice EPI velocity phase contrast imaging. NeuroImage 122, 281-287, doi:10.1016/j.neuroimage.2015.07.073 (2015).
5 Moran, P. R. A flow velocity zeugmatographic interlace for NMR imaging in humans. Magn Reson Imaging 1, 197-203, doi:10.1016/0730-725x(82)90170-9 (1982).6 Tanner, J. E. & Stejskal, E. O. Restricted self‐diffusion of protons in colloidal systems by the pulsed‐gradient, spin‐echo method. The Journal of Chemical Physics 49, 1768-1777 (1968).
7 Jansen, I. H. et al. Simultaneous Imaging of Diffusion and Coherent Motion in Slow-Flow Compartments in the Brain. ISMRM 2020
8 Williamson, N. H., Komlosh, M. E., Benjamini, D. & Basser, P. J. Limits to flow detection in phase contrast MRI. J Magn Reson Open 2-3, doi:10.1016/j.jmro.2020.100004 (2020).
9 Eckstein, K. et al. Computationally Efficient Combination of Multi-channel Phase Data From Multi-echo Acquisitions (ASPIRE). Magnetic resonance in medicine 79, 2996-3006, doi:10.1002/mrm.26963 (2018).
Figures