3477
Towards accurate and repeatable 1mm isotropic whole-brain MRF quantification using a 1-minute scan with optimized processing pipeline1Department of Radiology, Stanford University, Stanford, CA, United States, 2standford university, palo alto, CA, United States, 3Department of Electrical Engineering and Computer Science, Massachusetts Institute of Technology, Stanford, CA, United States
Synopsis
Keywords: Quantitative Imaging, Brain
A rotation-fitting based PV reduction pipeline with B0, B1+ and frequency-based flip angle (FA) scaling corrections are proposed to improve the accuracy and repeatability of magnetic resonance fingerprinting (MRF) in the existence of motion. 5 repeated scans from both stable baseline and big motion positions were acquired and analyzed to compare the repeatability of MRF under different rotation-fitting schemes and B0, B1+ corrections. Rotation before the fitting can substantially reduce the PV effects. The B0/ B1+ and frequency-based FA scaling corrections improve the estimation accuracy. The 2min and 1min 1mm3 whole brain MRF quantitative results also indicate a high repeatability.Introduction
A rotation-fitting based PV reduction pipeline with B0, B1+ and frequency-based flip angle (FA) scaling corrections are proposed to improve the accuracy and repeatability of magnetic resonance fingerprinting (MRF) acquired at different head positions, which is typically confronted from datasets across scan sessions. 5 repeated scans from both stable baseline and varied head positions were acquired and analyzed to compare the repeatability of MRF under different rotation-fitting schemes and B0, B1+ corrections. Rotation before the fitting can substantially reduce the PV effects. The B0/ B1+ and frequency-based FA scaling corrections improve the estimation accuracy. The 2min and 1min 1mm3 whole brain MRF quantitative results also indicate a high repeatability.Methods
Acquisitions: 5 repeated scans in a referenced position were acquired as baseline and 5 repeated scans at other positions were collected after big movements using the 3D multi-axis spiral-projection MRF sequence7. The MRF acquisition parameters were: FOV = 220×220×220mm3, 1.0mm-iso resolution, 500 TRs, TR/TE = 12.5/1.75ms, the total scan time is 6min. After each MRF acquisition, a 1mm3 MPRAGE data with matched FOV were acquired. At each head position, the B0 and B1 maps were acquired. All acquisitions were collected on the GE 3T Premier scanner (GE Healthcare, Madison, WI) with the approval of the institutional review board (IRB).Data analysis: The density compensated subspace reconstruction8 with locally low-rank constraints was used to reconstruct the MRF tme series. First 5 principal components of the MRF dictionary were used as the temporal bases. The MFI was incorporated into the reconstruction by demodulating conjugate phases with 5 specific frequency [-200 :100: 200 Hz] to cover the B0 inhomogeneity. After estimating weighting of each frequency from B0 map, the corrected images were obtained by a linear interpolation of the reconstructed coefficients of the demodulated datasets. The 6 min datasets were retrospectively undersampled into 2min and 1min datasets.The B1+ inhomogeneity was corrected by simulating the MRF signal evolution across a range of B1+ values [0.7:0.02:1.3] in the dictionary. Due to frequency responses of the water-only exciting rectangular pulse, a frequency-based FA scaling was corrected. Two rotation-fitting schemes were evaluated to reduce the PV effects. The fit(rot) scheme rotates the reconstructed coefficients first and then fitting. The rot(fit) scheme rotate the parameter maps after the fitting. All scans were registered to the first volume at the referenced position using FSL FLIRT9. The motion matrix kept same in two pipelines. The averaged baseline dataset was used as reference. The averaged MPRAGE was segmented by Freesurfer10 with 165 regions of interest selected after removing CSF and vessels. The linear regression and Bland-Altman plot were applied for assessment.
Results
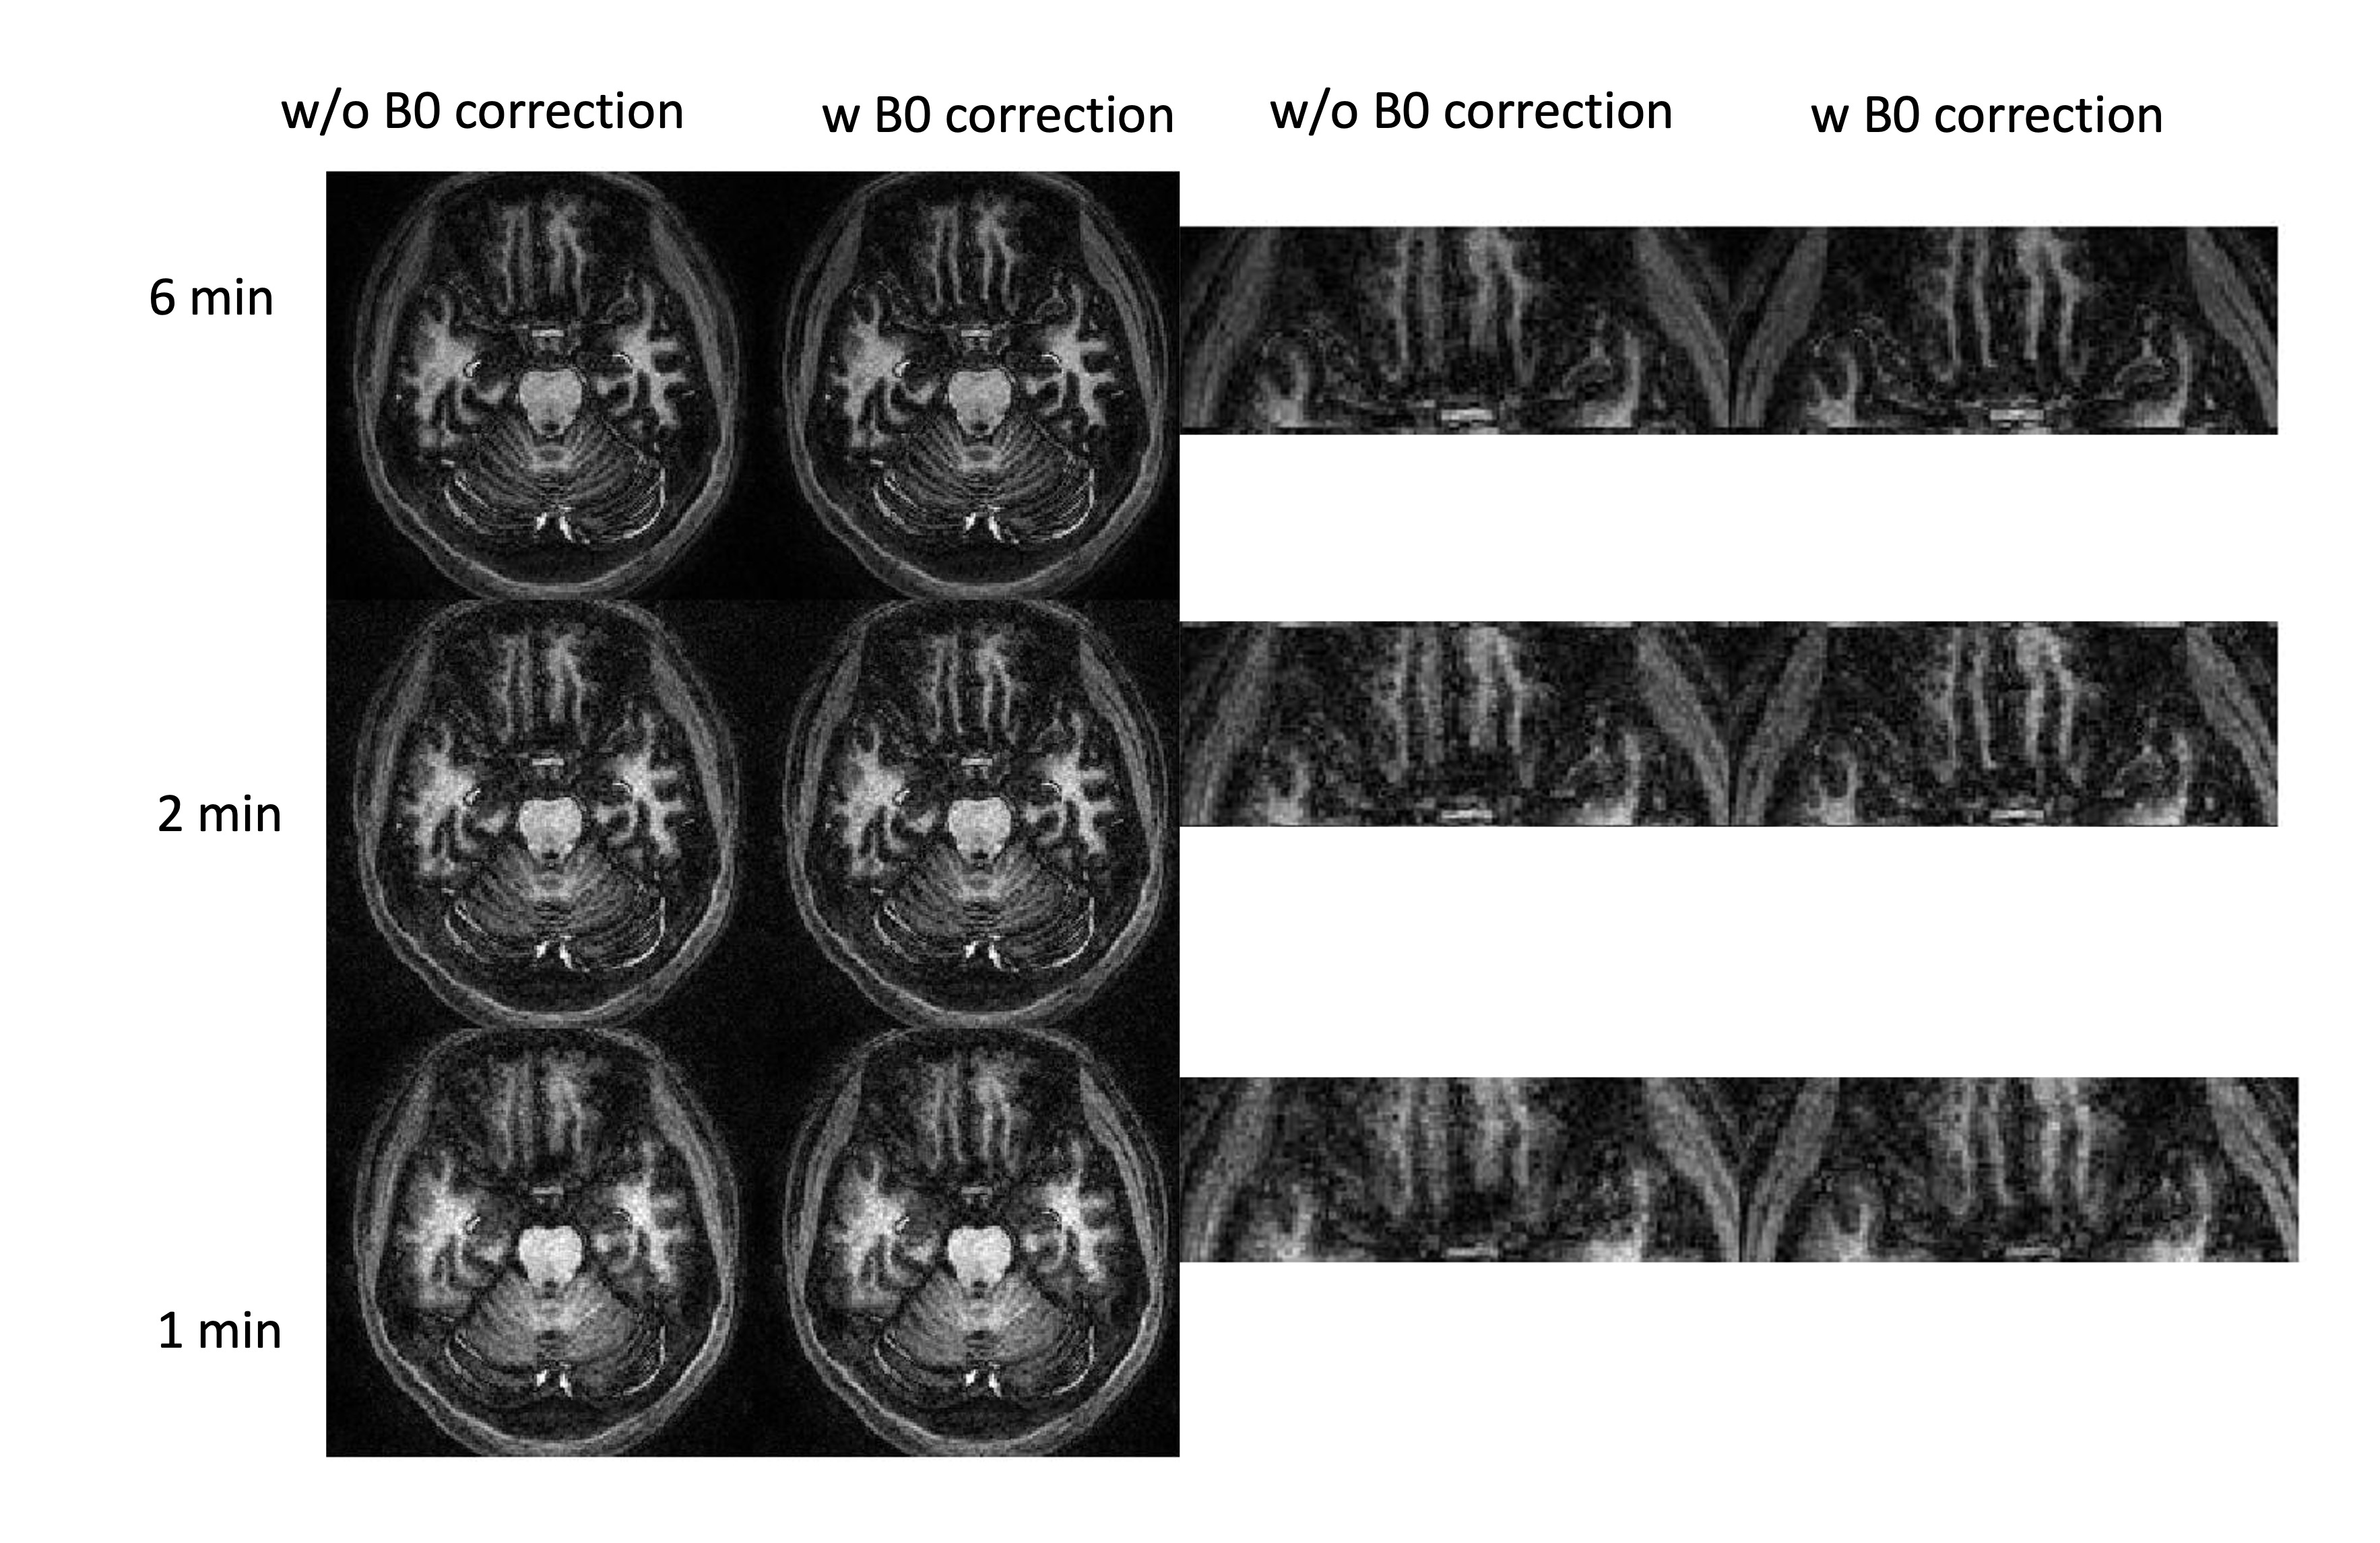
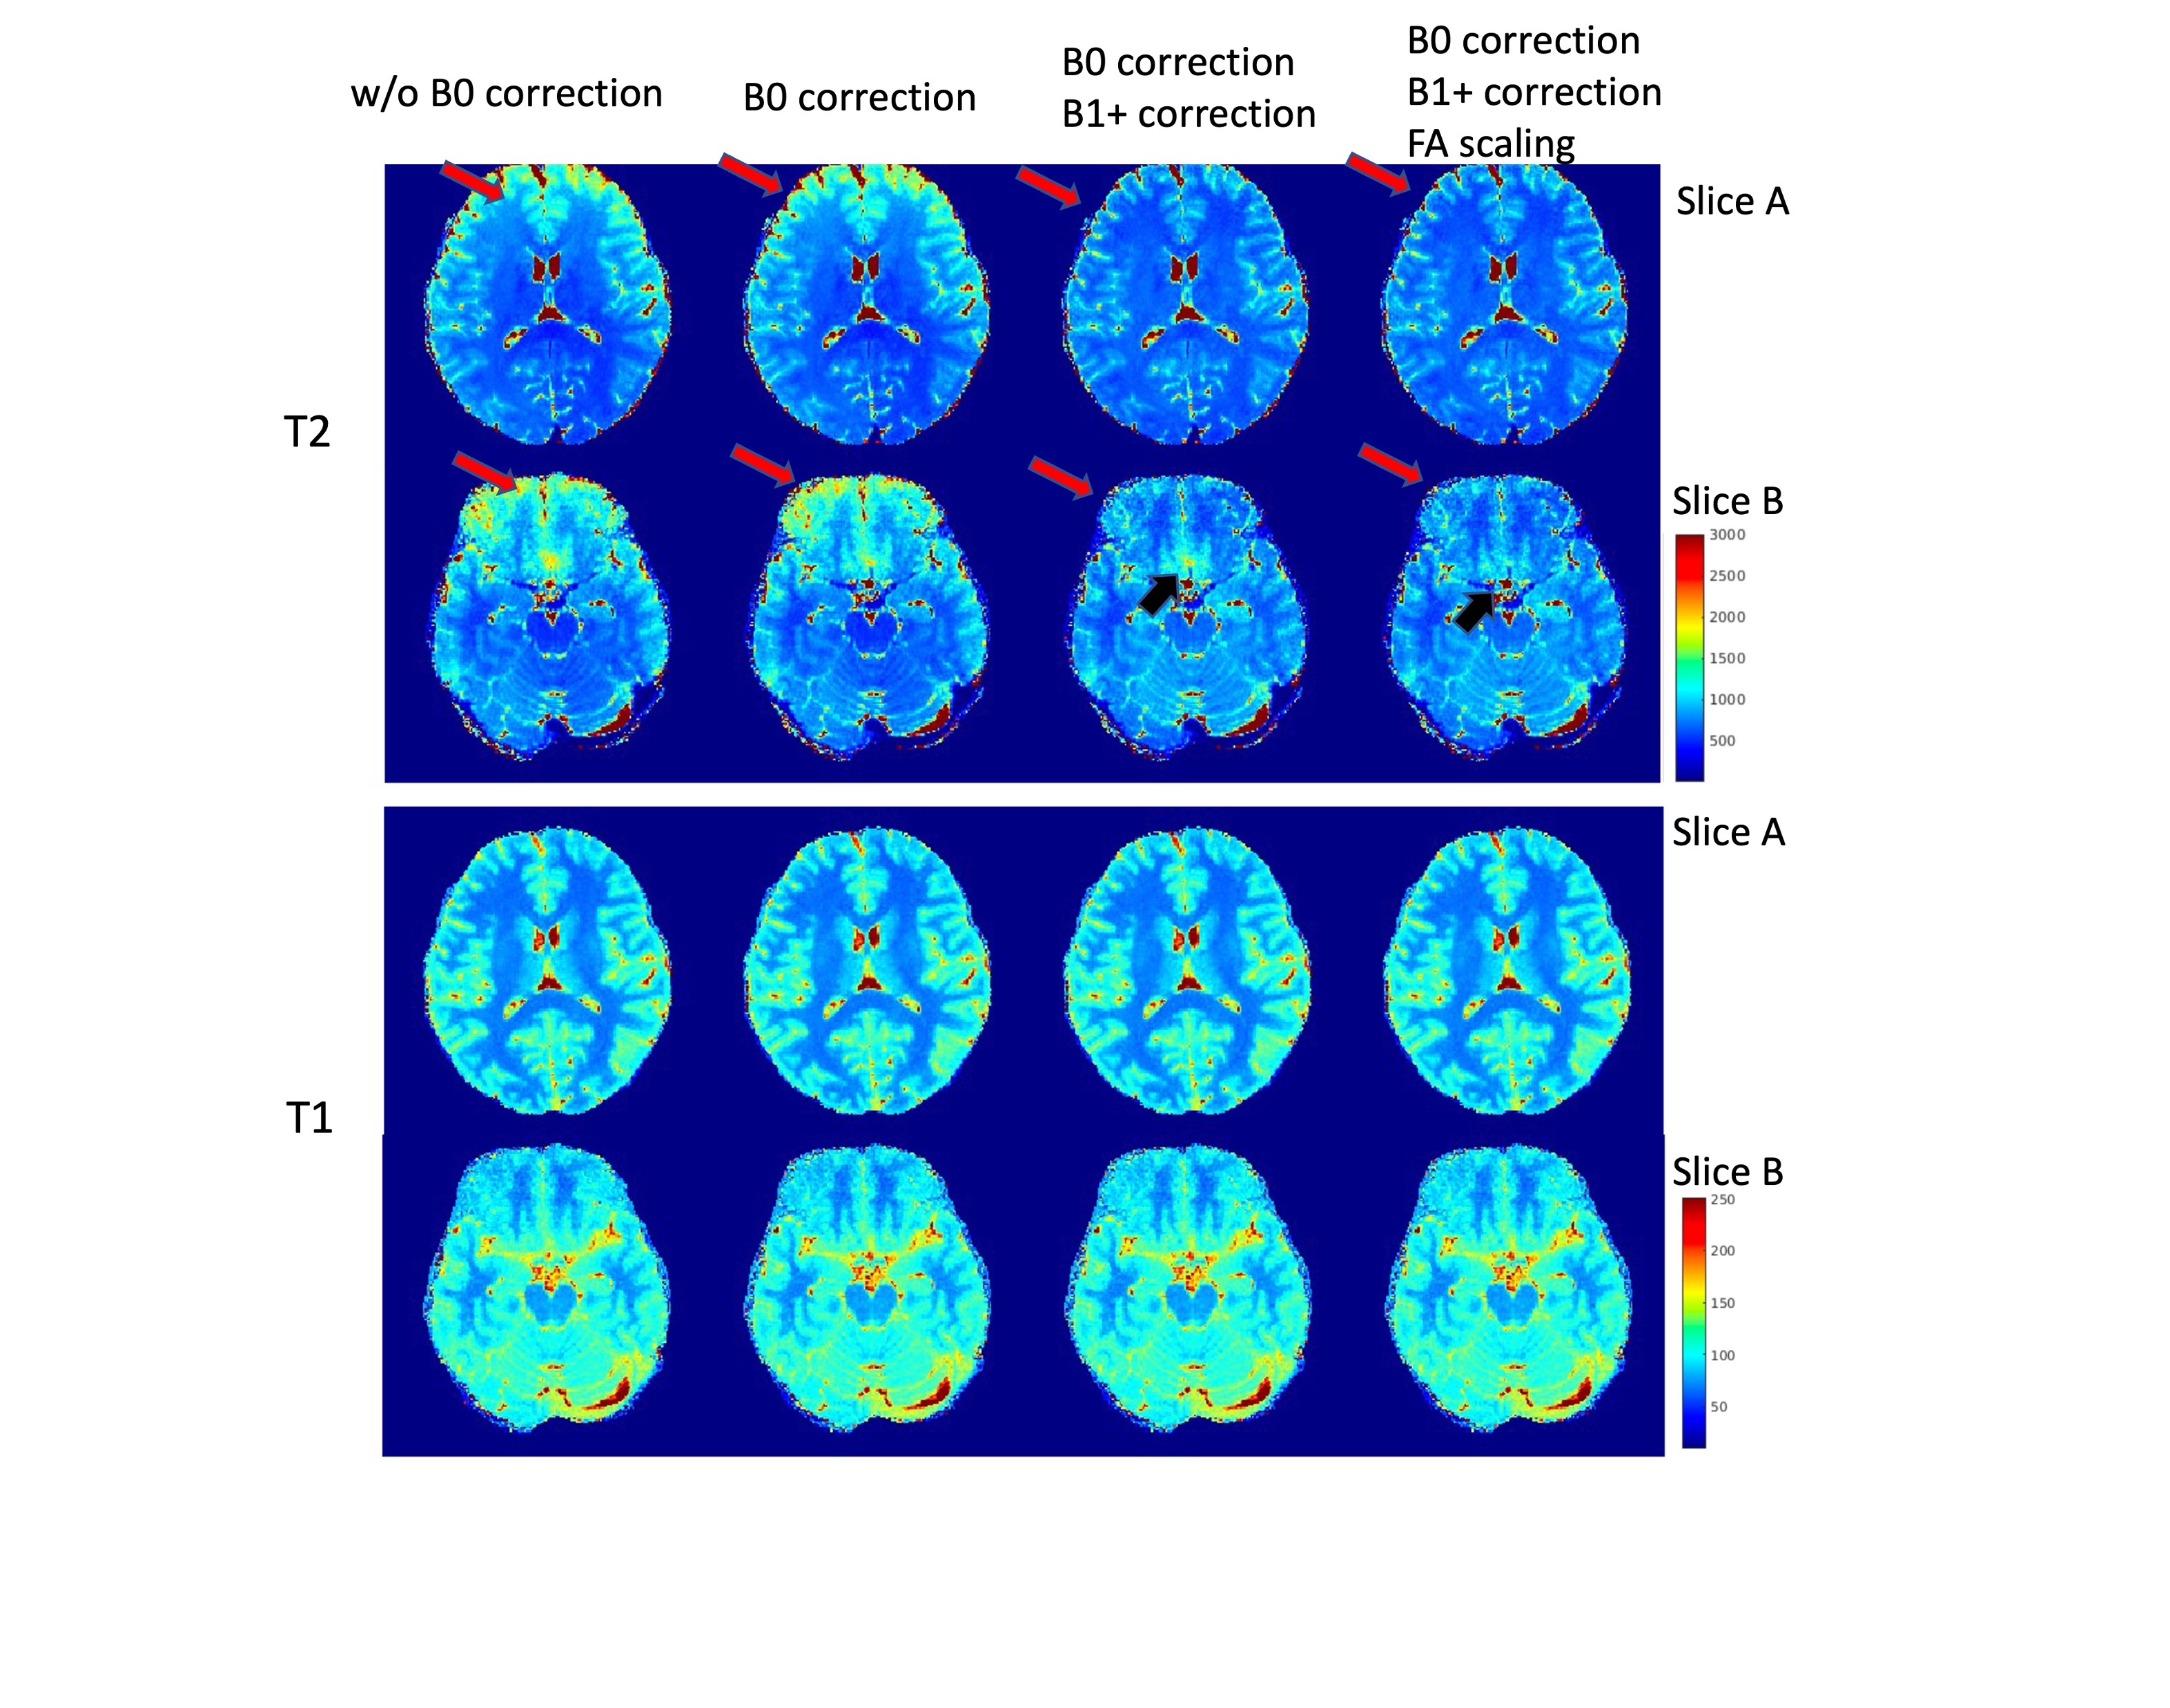
Figure 1 shows the 3rd coefficients of the 6min, 2min and 1min data with and without B0 corrections. The signals in the B0 inhomogeneity regions are recovered and the tissue structure are clearer. Also, the 1min datasets can achieve a similar image quality with that the 6min datasets.Figure 2 compares the T1/T2 maps of the datasets without any correction, the B0 corrected datasets without B1+ correction, the B0 corrected datasets with B1+ correction and the B0 corrected datasets with scaled B1+ correction. The T2 maps are more uniform after B1+ correction and more homogeneous in B0 inhomogeneous region after FA scaling. The T1 is less affected than T2 due to the adiabatic pulse.
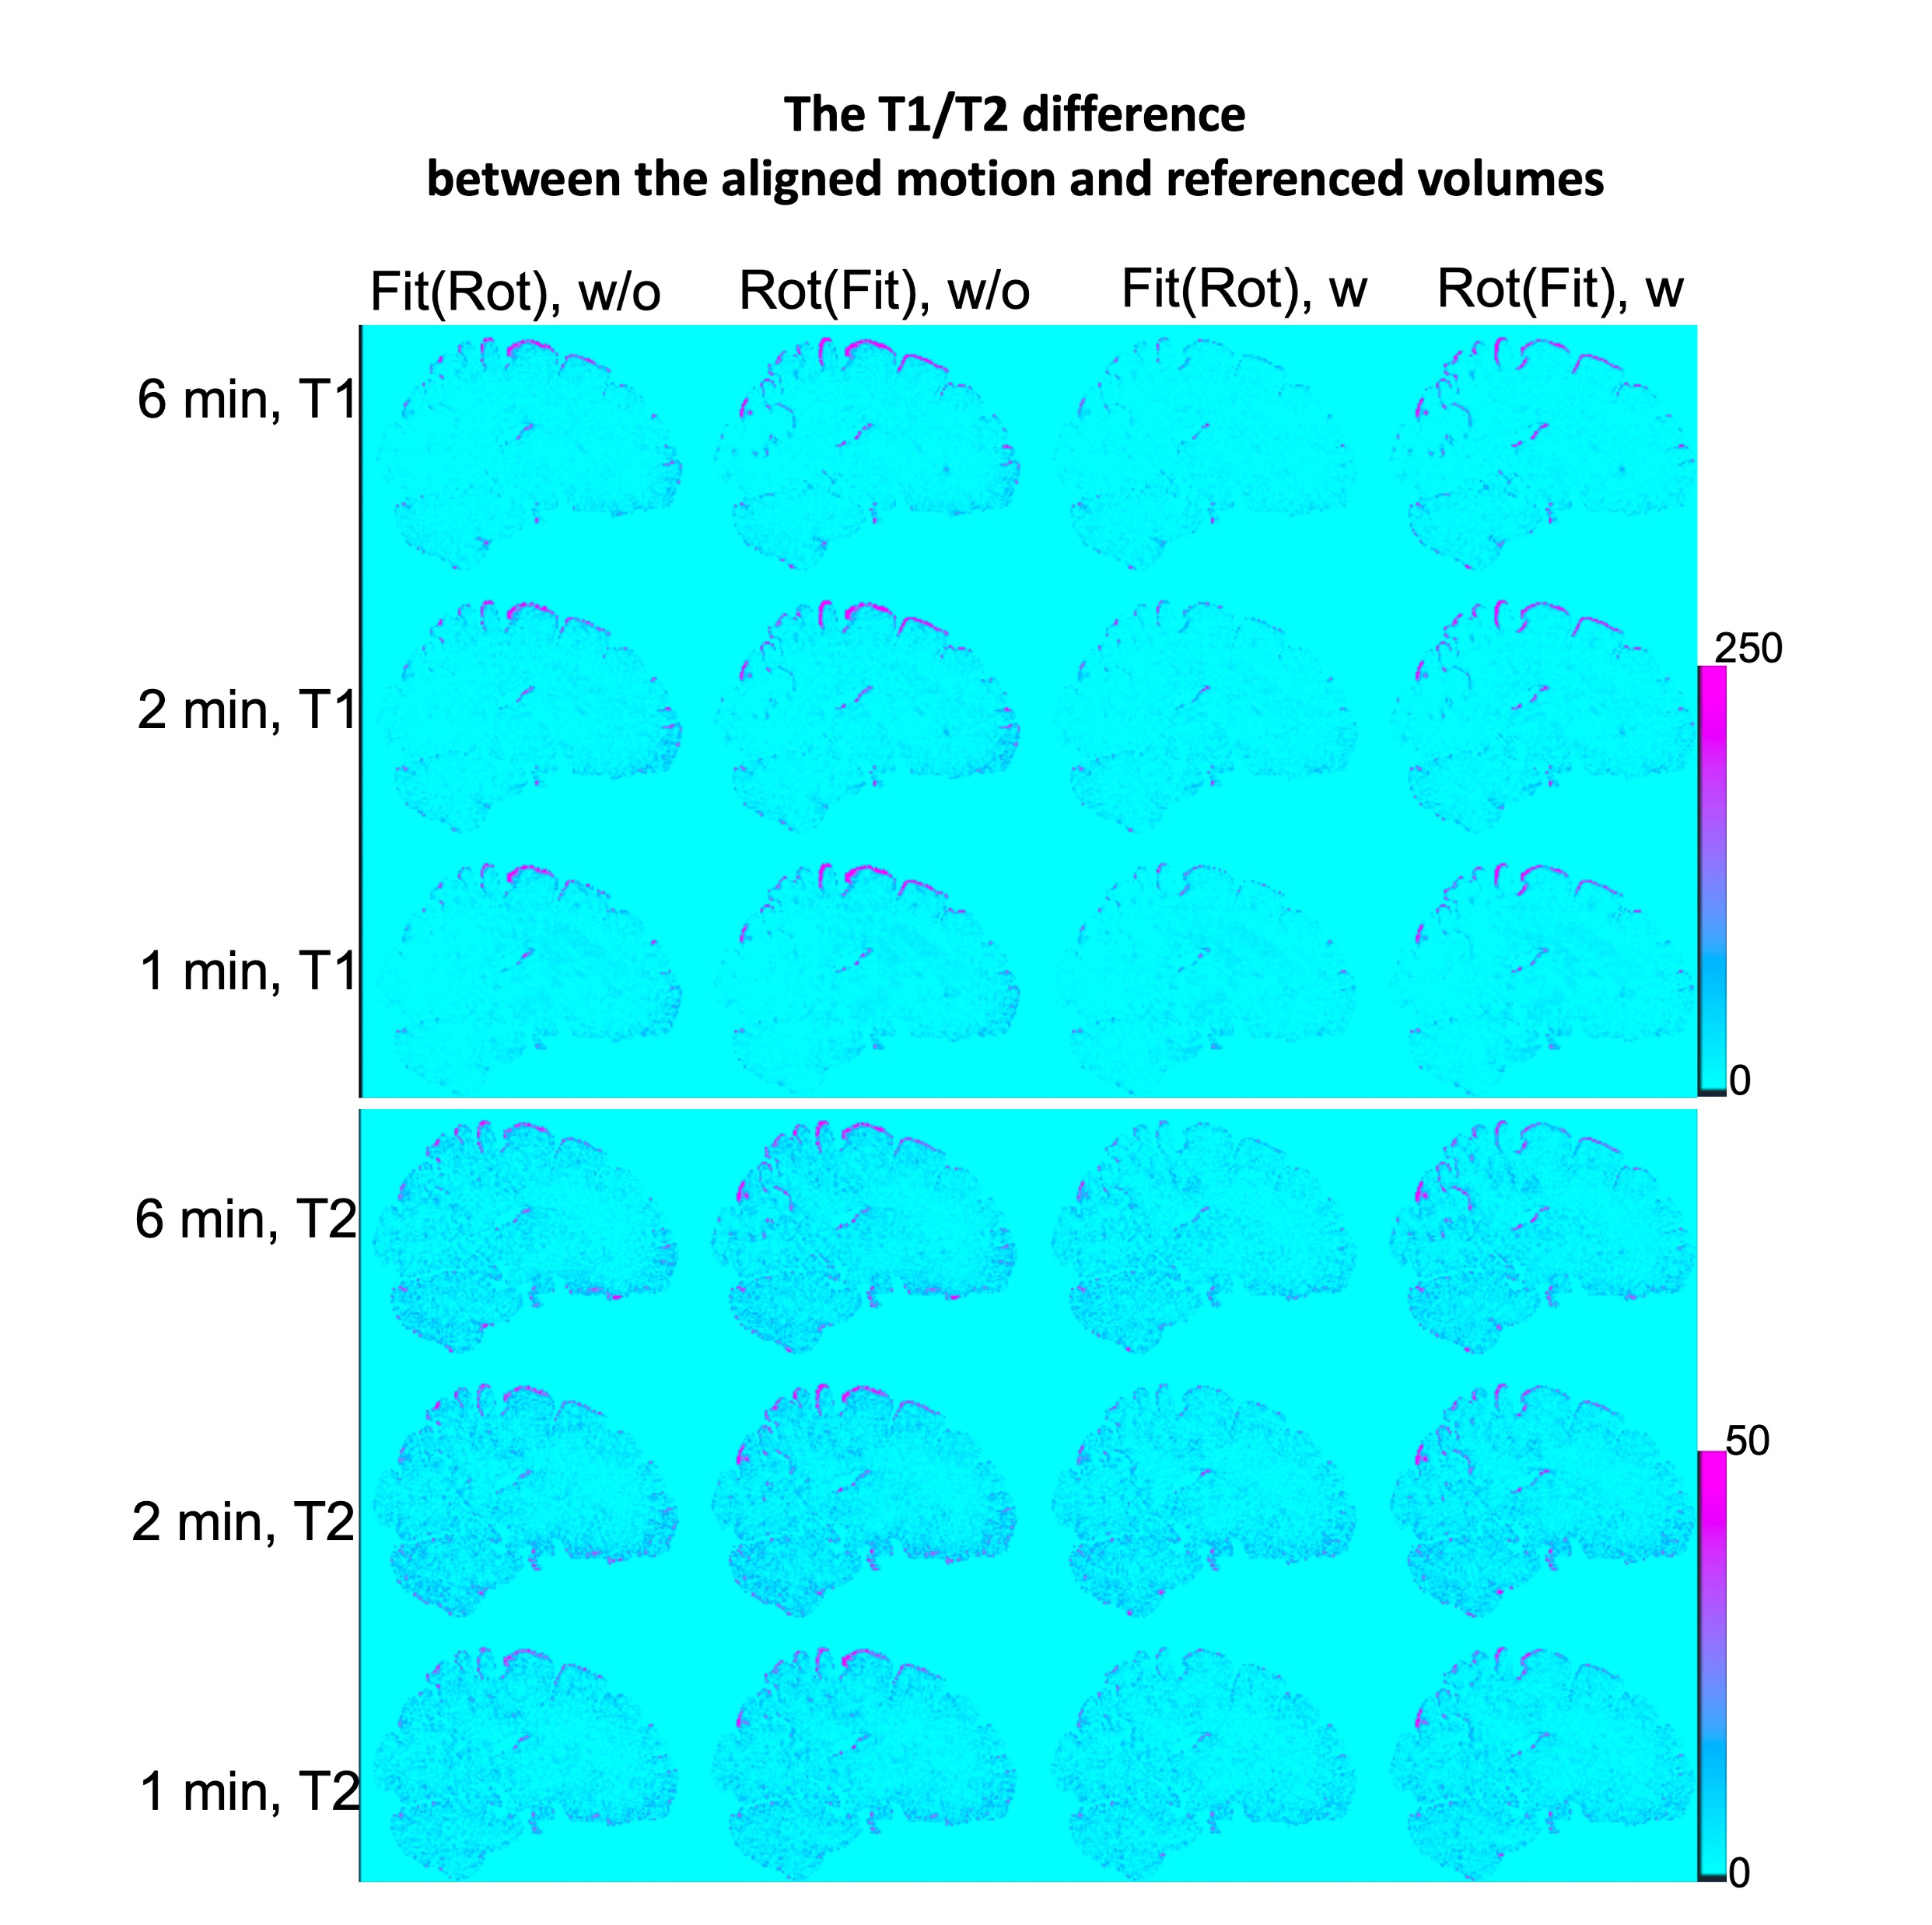
Figure 3 shows the difference between the aligned motion volumes and the referenced volume under two rotation-fitting schemes in the fully corrected datasets and the datasets without any corrections. Large variation exists in the PV regions. The difference in the results of the uncorrected datasets is slightly higher than that of the corrected datasets. The T1/T2 differences are higher under the rot(fit) scheme than the fit(rot) scheme.
Figure 4 shows the repeatability of the datasets without any correction and the fully corrected datasets under two rotation-fitting schemes. The fitted T1/T2 of the fit(rot) scheme obtain a higher agreement than the rot(fit) scheme in both the uncorrected and fully corrected datasets. Comparing the results of uncorrected and corrected datasets, the results of corrected datasets can achieve higher repeatability.
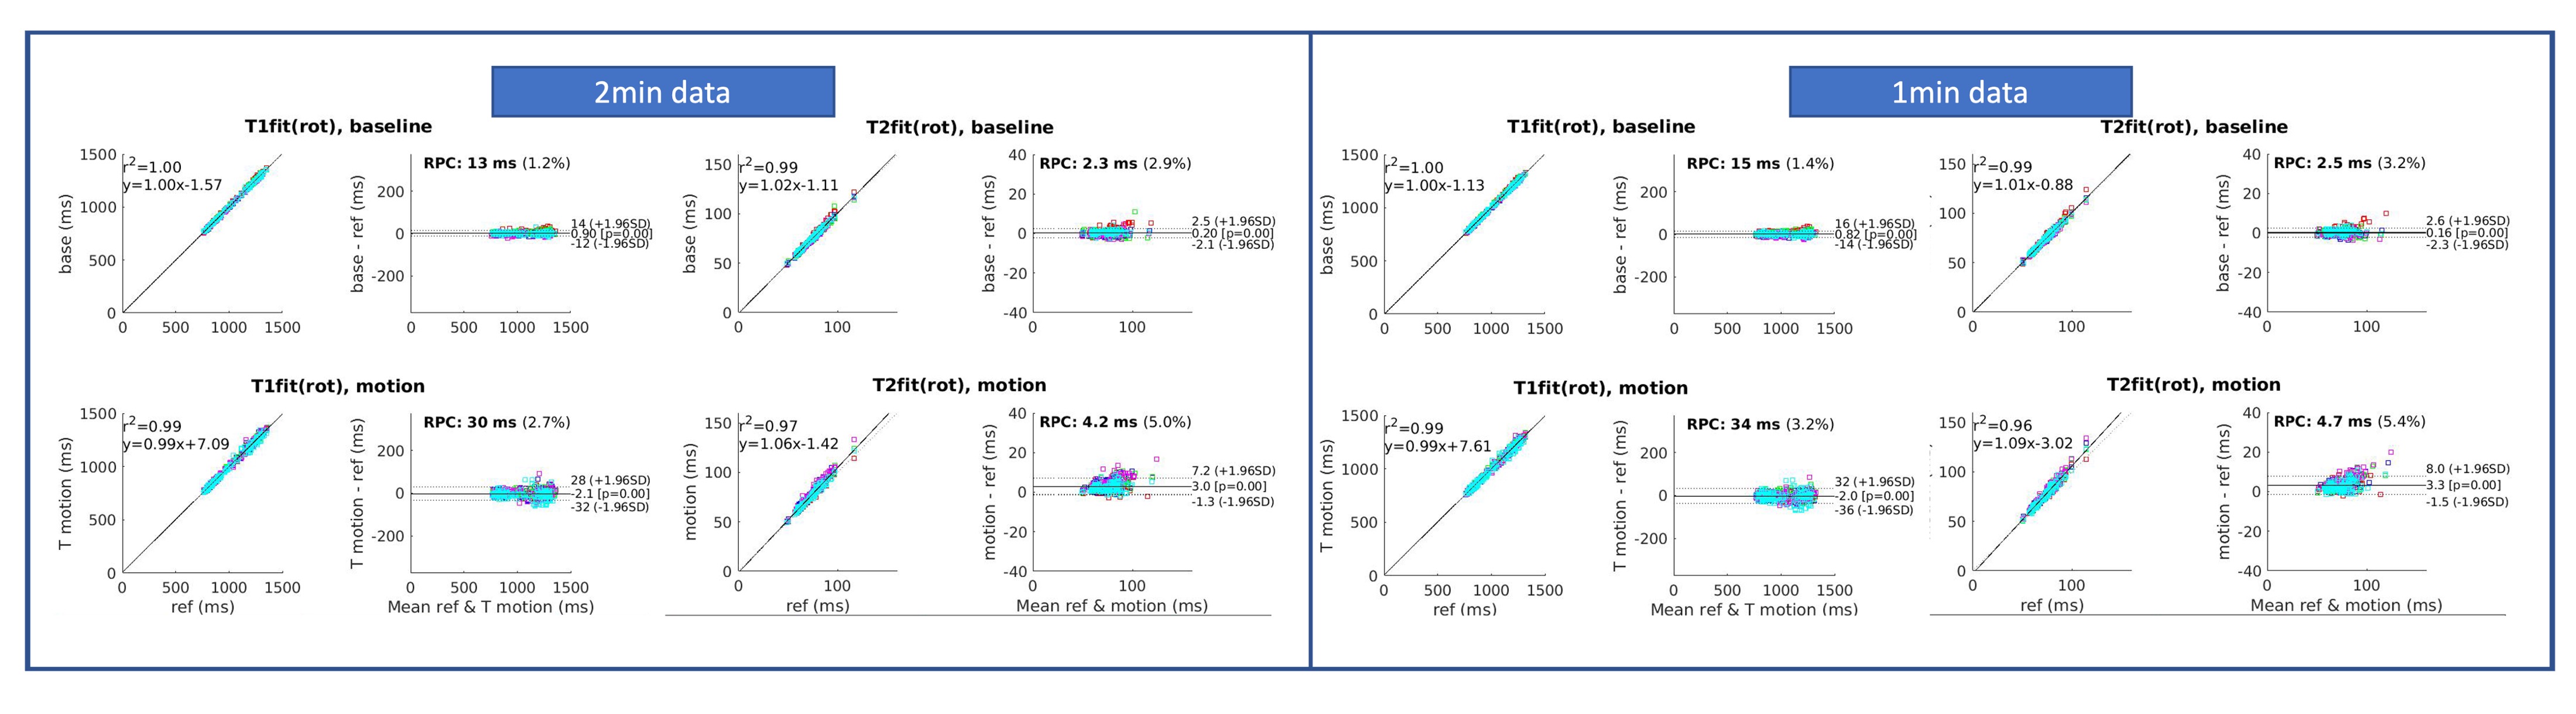
Figure 5 shows the T1/T2 agreement of the 2min and 1min datasets after all correction using the fit(rot) scheme. Both datasets show a slightly lower agreement but relatively high repeatability with the referenced datasets when comparing to the results of 6min data shown in Figure 4.
Conclusions
The MRF parametric imaging can achieve a high accuracy and repeatability after the PV effects reduction and B0 and scaled B1+ corrections. Rotating the basis before fitting will reduce the PV effects because the nonlinear mono-component fitting of voxel with mixed tissues would cause bias. The B0/B1+ corrections and FA scaling would improve the accuracy of fitting. The fully-corrected 1-min MRF acquisition could also obtain a comparable repeatability to that of 6min uncorrected MRF datasets, which make the 1mm isotropic whole-brain multi-parametric imaging achievable in 1 minute.Acknowledgements
GE Healthcare research funds and NIH R01EB020613, R01MH116173, R01EB019437, U01EB025162, P41EB030006References
1. Ma, D. et al. Magnetic resonance fingerprinting. Nature 495, 187–192 (2013).
2. Cao, X. et al. Fast 3D brain MR fingerprinting based on multi-axis spiral projection trajectory. Magn. Reson. Med. 82, 289–301 (2019).
3. Deshmane, A. et al. Partial volume mapping using magnetic resonance fingerprinting. NMR in Biomedicine 32, e4082 (2019).
4. Norbeck, O. et al. Optimizing 3D EPI for rapid T1‐weighted imaging. Magn. Reson. Med. 84,1441-1455 (2020).
5. Ostenson, J. et al. Multi-frequency interpolation in spiral magnetic resonance fingerprinting for correction of off-resonance blurring. Magnetic resonance imaging 41, 63-72 (2017).
6. Uecker, Martin, et al. "ESPIRiT—an eigenvalue approach to autocalibrating parallel MRI: where SENSE meets GRAPPA." Magn. Reson. Med. 71, 990-1001(2014).
7. Iyer, S. et al. Polynomial Preconditioners for Regularized Linear Inverse Problems. (2022) doi: 10.48550/arxiv.2204.10252.
8. Cao, X. et al. Optimized multi‐axis spiral projection MR fingerprinting with subspace reconstruction for rapid whole‐brain high‐isotropic‐resolution quantitative imaging. Magn. Reson. Med. 88, 133–150 (2022).
9. Jenkinson, M. et al. Fsl. Neuroimage 62, 782-790 (2012).10. Desikan, R., et al. An automated labeling system for subdividing the human cerebral cortex on MRI scans into gyral based regions of interest. Neuroimage 31, 968-980 (2006).
Figures