3475
Improved Assessment of Brain Tissue Viability in Acute Stroke Using Fast High-Resolution 3D-MRSI and Quantitative T2 Imaging1School of Biomedical Engineering, Shanghai Jiao Tong University, Shanghai, China, 2Radiology Department, The Fifth People's Hospital of Shanghai, Fudan University, Shanghai, China, 3Beckman Institute for Advanced Science and Technology, University of Illinois at Urbana-Champaign, Urbana, IL, United States, 4Department of Electrical and Computer Engineering, University of Illinois at Urbana-Champaign, Urbana, IL, United States, 5National Center for Supercomputing Applications, University of Illinois at Urbana-Champaign, Urbana, IL, United States, 6Siemens Medical Solutions USA, Inc, Urbana, IL, United States, 7Department of Biomedical Engineering, Case Western Reserve University, Cleveland, OH, United States
Synopsis
Keywords: Stroke, Stroke
Accurate assessment of tissue viability is of great importance for the design of therapeutic interventions in acute stroke. 1H-MRSI and quantitative T2 imaging can provide neurochemical biomarkers sensitive to the pathological changes in stroke but their applications have been limited by long scan times. This study introduces a novel approach that combines fast high-resolution 3D-MRSI with quantitative T2 imaging to assess the viability of ischemic tissues in acute stroke. This approach achieved improved discrimination between ischemic brain tissues that ultimately infarcted and those recovered using joint neurometabolite concentrations and quantitative T2 values, in comparison with classical DWI and PWI methods.Introduction
Accurate assessment of tissue viability is of great importance for the design of therapeutic interventions in acute stroke. Diffusion- and perfusion-weighted MRI (DWI and PWI) have been used in clinical practice to map ischemic brain tissue damage, with DWI lesion as the infarct core and mismatch between PWI and DWI lesions as the salvageable penumbra1. However, the DWI lesion can reverse with timely reperfusion, and the mismatch area contains oligemic tissue2. The multifactorial nature of stroke pathology suggests that a multimodal imaging approach is in need to characterize the complex underlying neurochemical changes. MRSI is a potentially powerful tool for non-invasive measurement of neurometabolites while quantitative T2 mapping is sensitive to the development of vasogenic edema3,4. But both techniques suffer from long acquisition times, which have limited their clinical applications5. Here we introduce a novel approach that combines fast high-resolution 3D-MRSI (2×3×3 mm3; 8-min scan) with quantitative T2 imaging (1.9×1.9×3 mm3; 80-sec scan) to assess the viability of ischemic tissues in acute stroke. We hypothesize that such an approach, which simultaneously measures neuronal/glial cell loss, lactic acidosis, and vasogenic edema, could improve the accuracy of brain tissue viability assessment. Our results show that the proposed approach significantly improved the discrimination between ischemic brain tissues that ultimately infarcted from those recovered, in comparison with the biomarkers provided by DWI and PWI.Methods
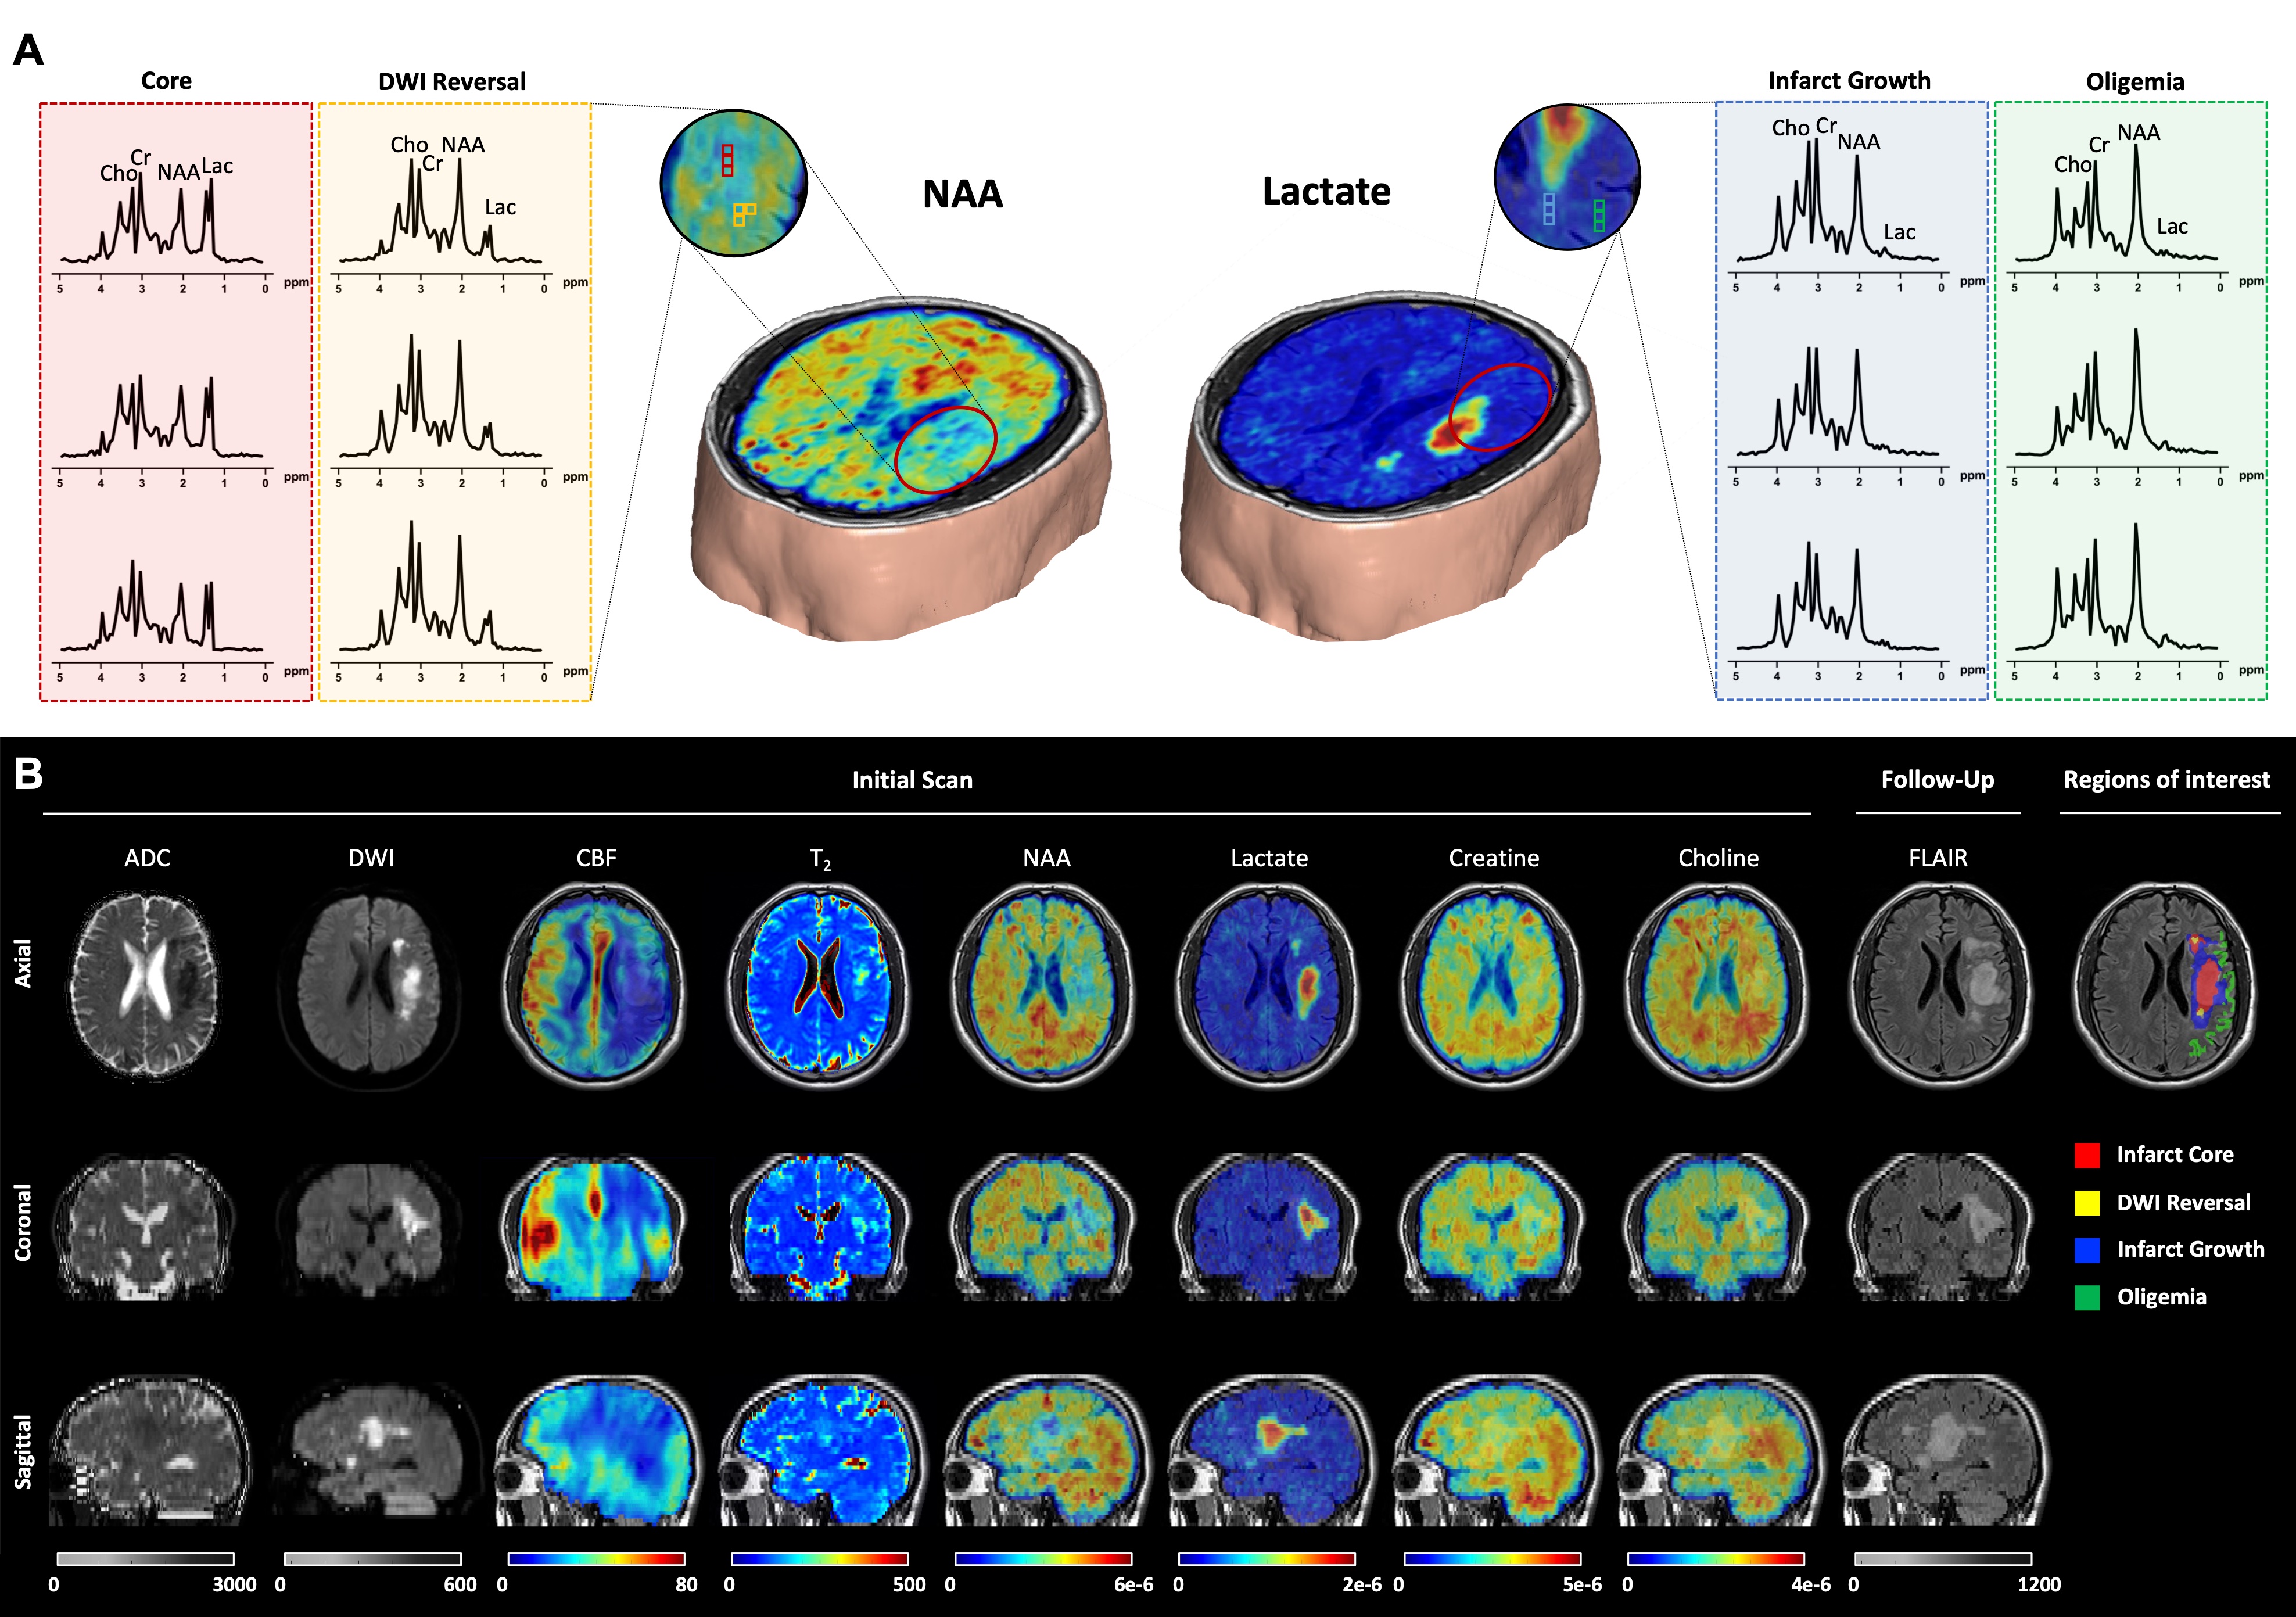
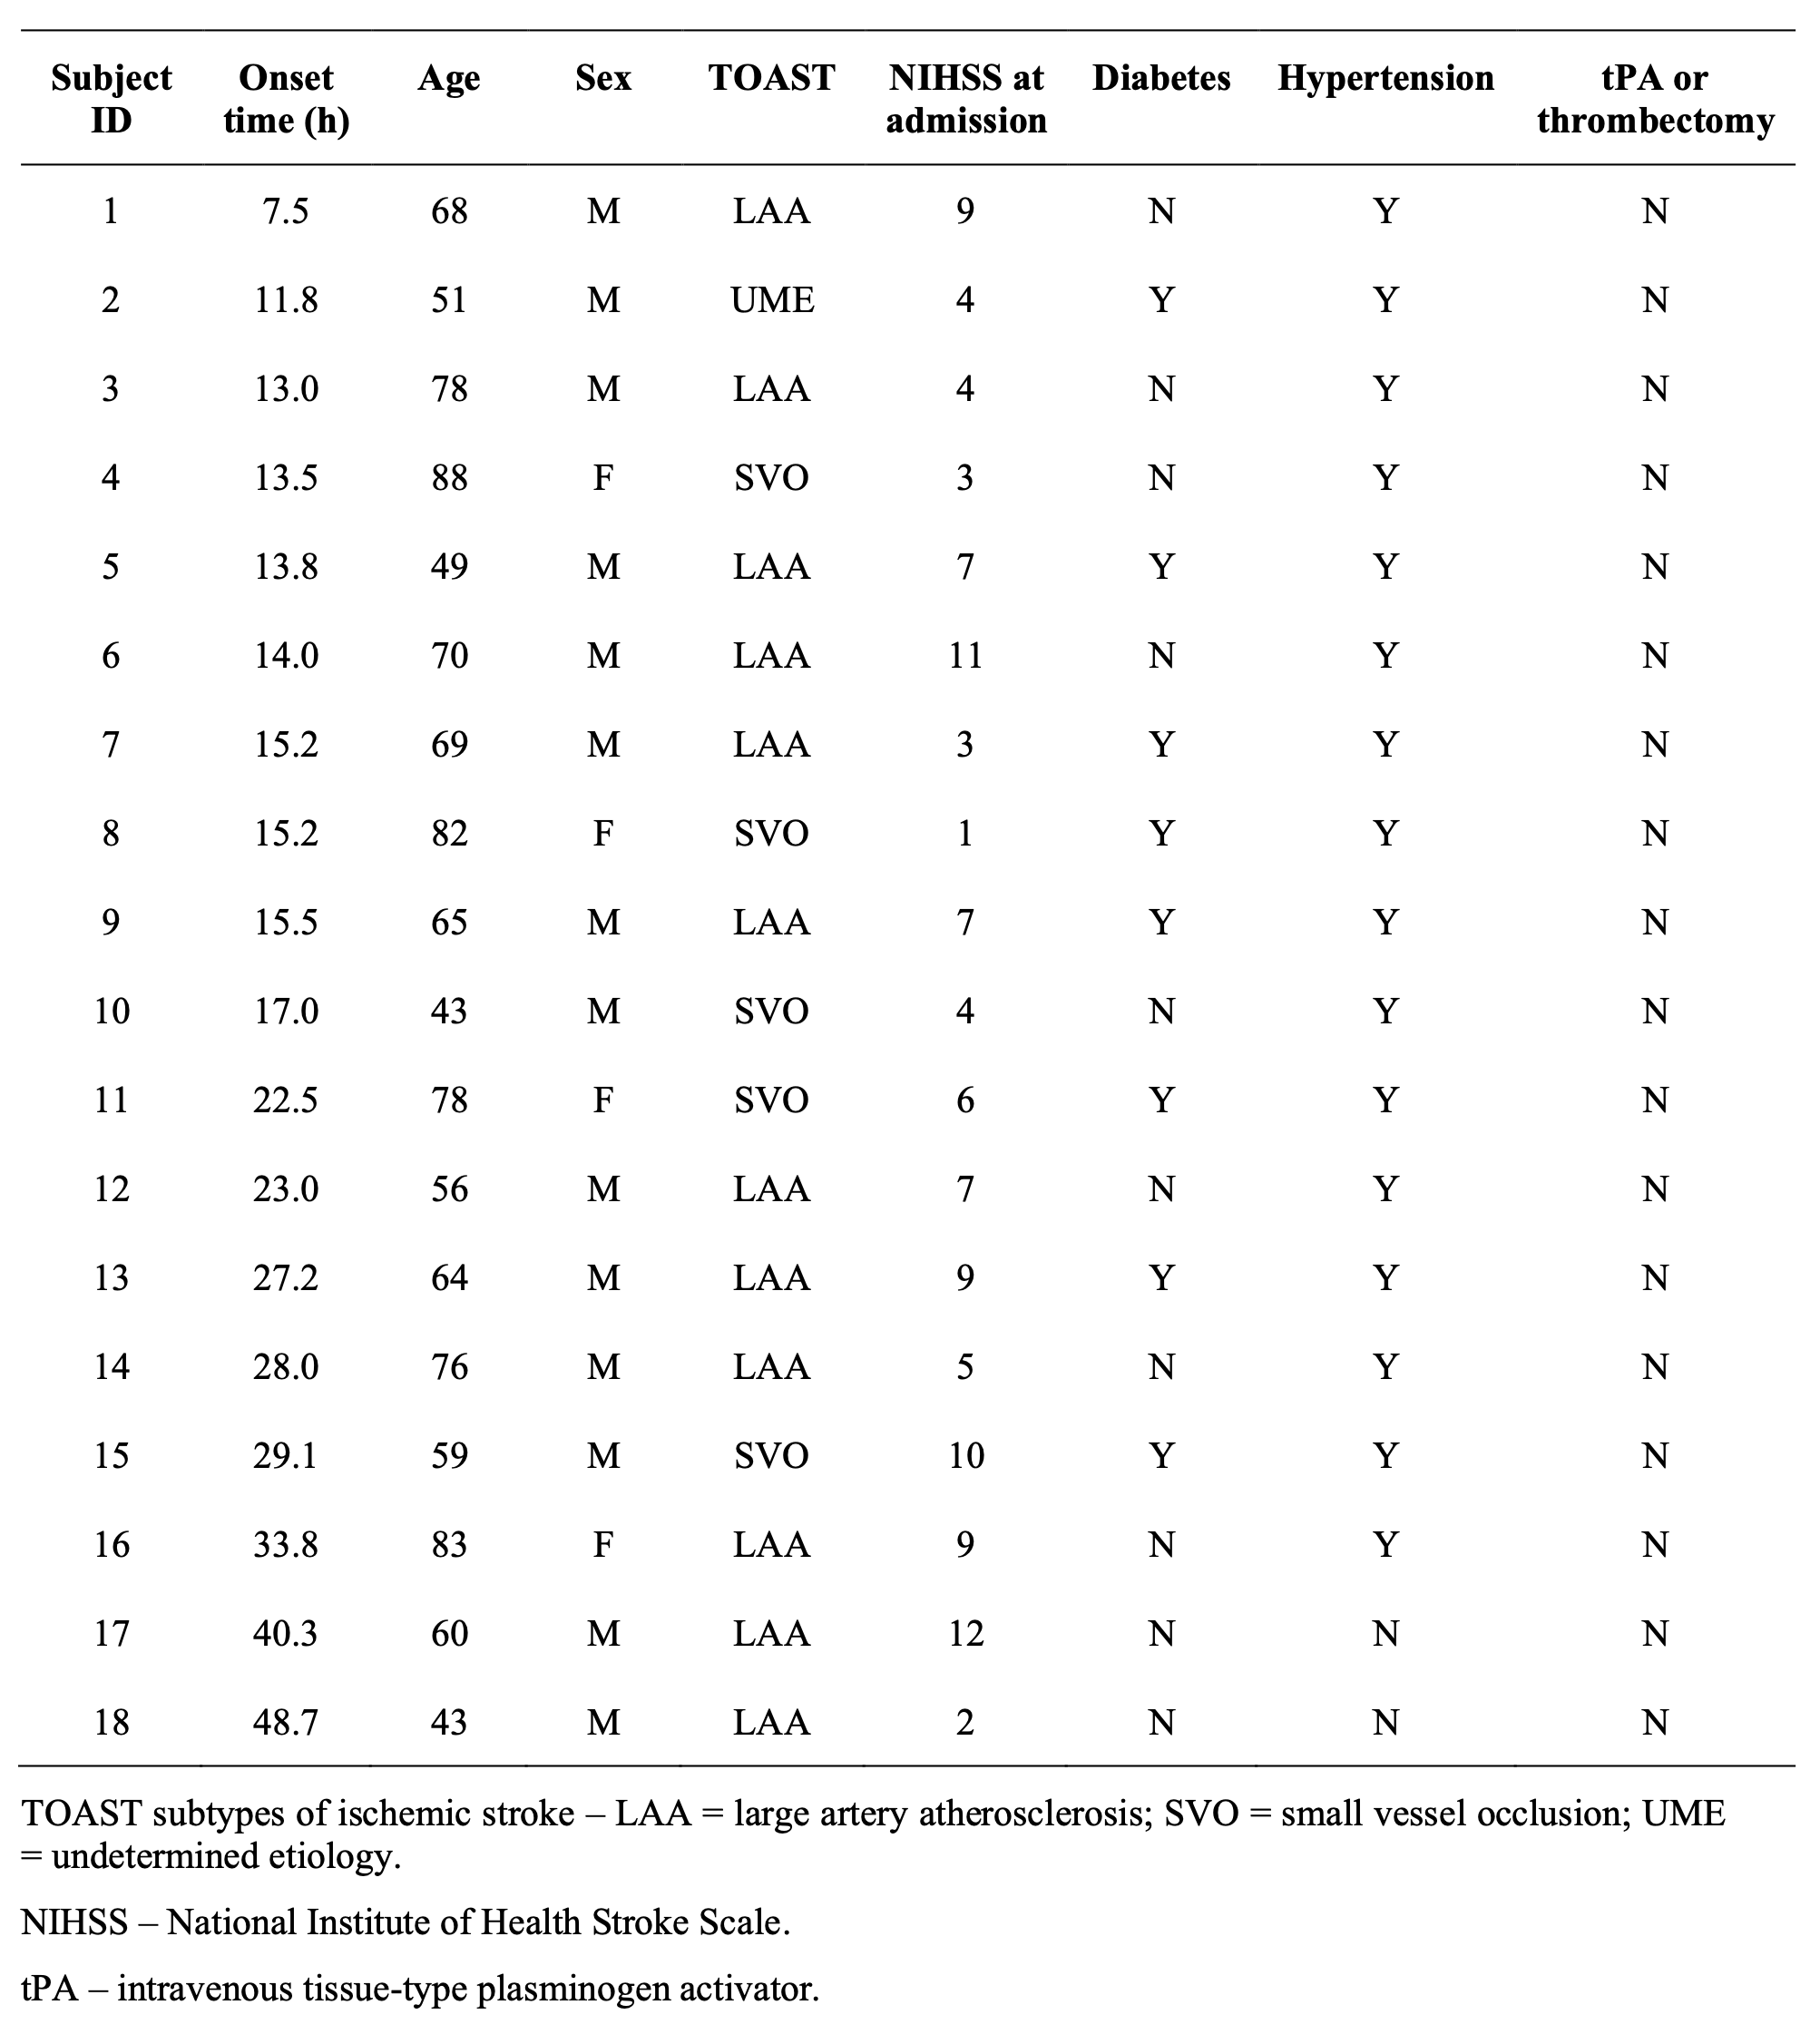
Demographics of the included eighteen ischemic stroke patients are summarized in Table 1. The study was approved by the IRB of the Fifth People’s Hospital of Shanghai, China. The initial MRI scans were performed upon patients’ admission, with the time from symptom onset to scan ranging from 7.5 to 48.7 hours. The follow-up MRI scanning was repeated at 4 to 13 days to determine the size of the infarct. The data acquisition protocol for initial MRI scans included 3D MRSI using the SPICE sequence6–9 (TR/TE = 160/1.6 ms, 2×3×3 mm3, FOV = 240×240×72 mm3, 8 min), quantitative T2 mapping using the TSE sequence (TR/TE = 5030/[18,36,62] ms, 1.9×1.9×3.0 mm3, FOV = 240 mm, 80 sec), DWI (TR/TE = 4300/[74,125] ms, 1.3×1.3×4.0 mm3, FOV = 240 mm, b = [0,1000] s/mm2), and pseudo-continuous arterial spin labeling (pCASL) PWI with multiple post-labeling delays (TR/TE/TI = [3200,3400,3900,4600,5400]/10.3/150 ms, 3.75×3.75×3.75 mm3, FOV = 240 mm, labeling duration = 1.5 s, post-labeling delays = [0.8,1.0,1.5,2.2,3.0] s). The follow-up scans included FLAIR imaging (TR/TE/TI = 9000/89/2500 ms, 0.5×0.5×2.0 mm3, FOV = 240 mm). All the scans were performed on a 3T scanner (MAGNETOM Skyra, Siemens Healthcare, Erlangen, Germany).Neurometabolites maps were obtained using the standard processing pipeline of SPICE6,7,9. Quantitative T2 maps were obtained using the existing method10. The cerebral blood flow (CBF) images were obtained using the ASLtbx11. All the images were coregistered to the MRSI data. The DWI lesions, contralateral regions, and FLAIR lesions were manually delineated by an experienced neuroradiologist. Five regions of interest (ROIs) were defined: (1) infarct core: tissue in both DWI and FLAIR lesions; (2) infarct growth: tissue in FLAIR but not in DWI lesion; (3) oligemia: tissue in hypoperfusion (CBF < 20ml/100g/min) but not in DWI lesion; (4) DWI reversal: tissue in DWI but not in FLAIR lesion; and (5) contralateral region.
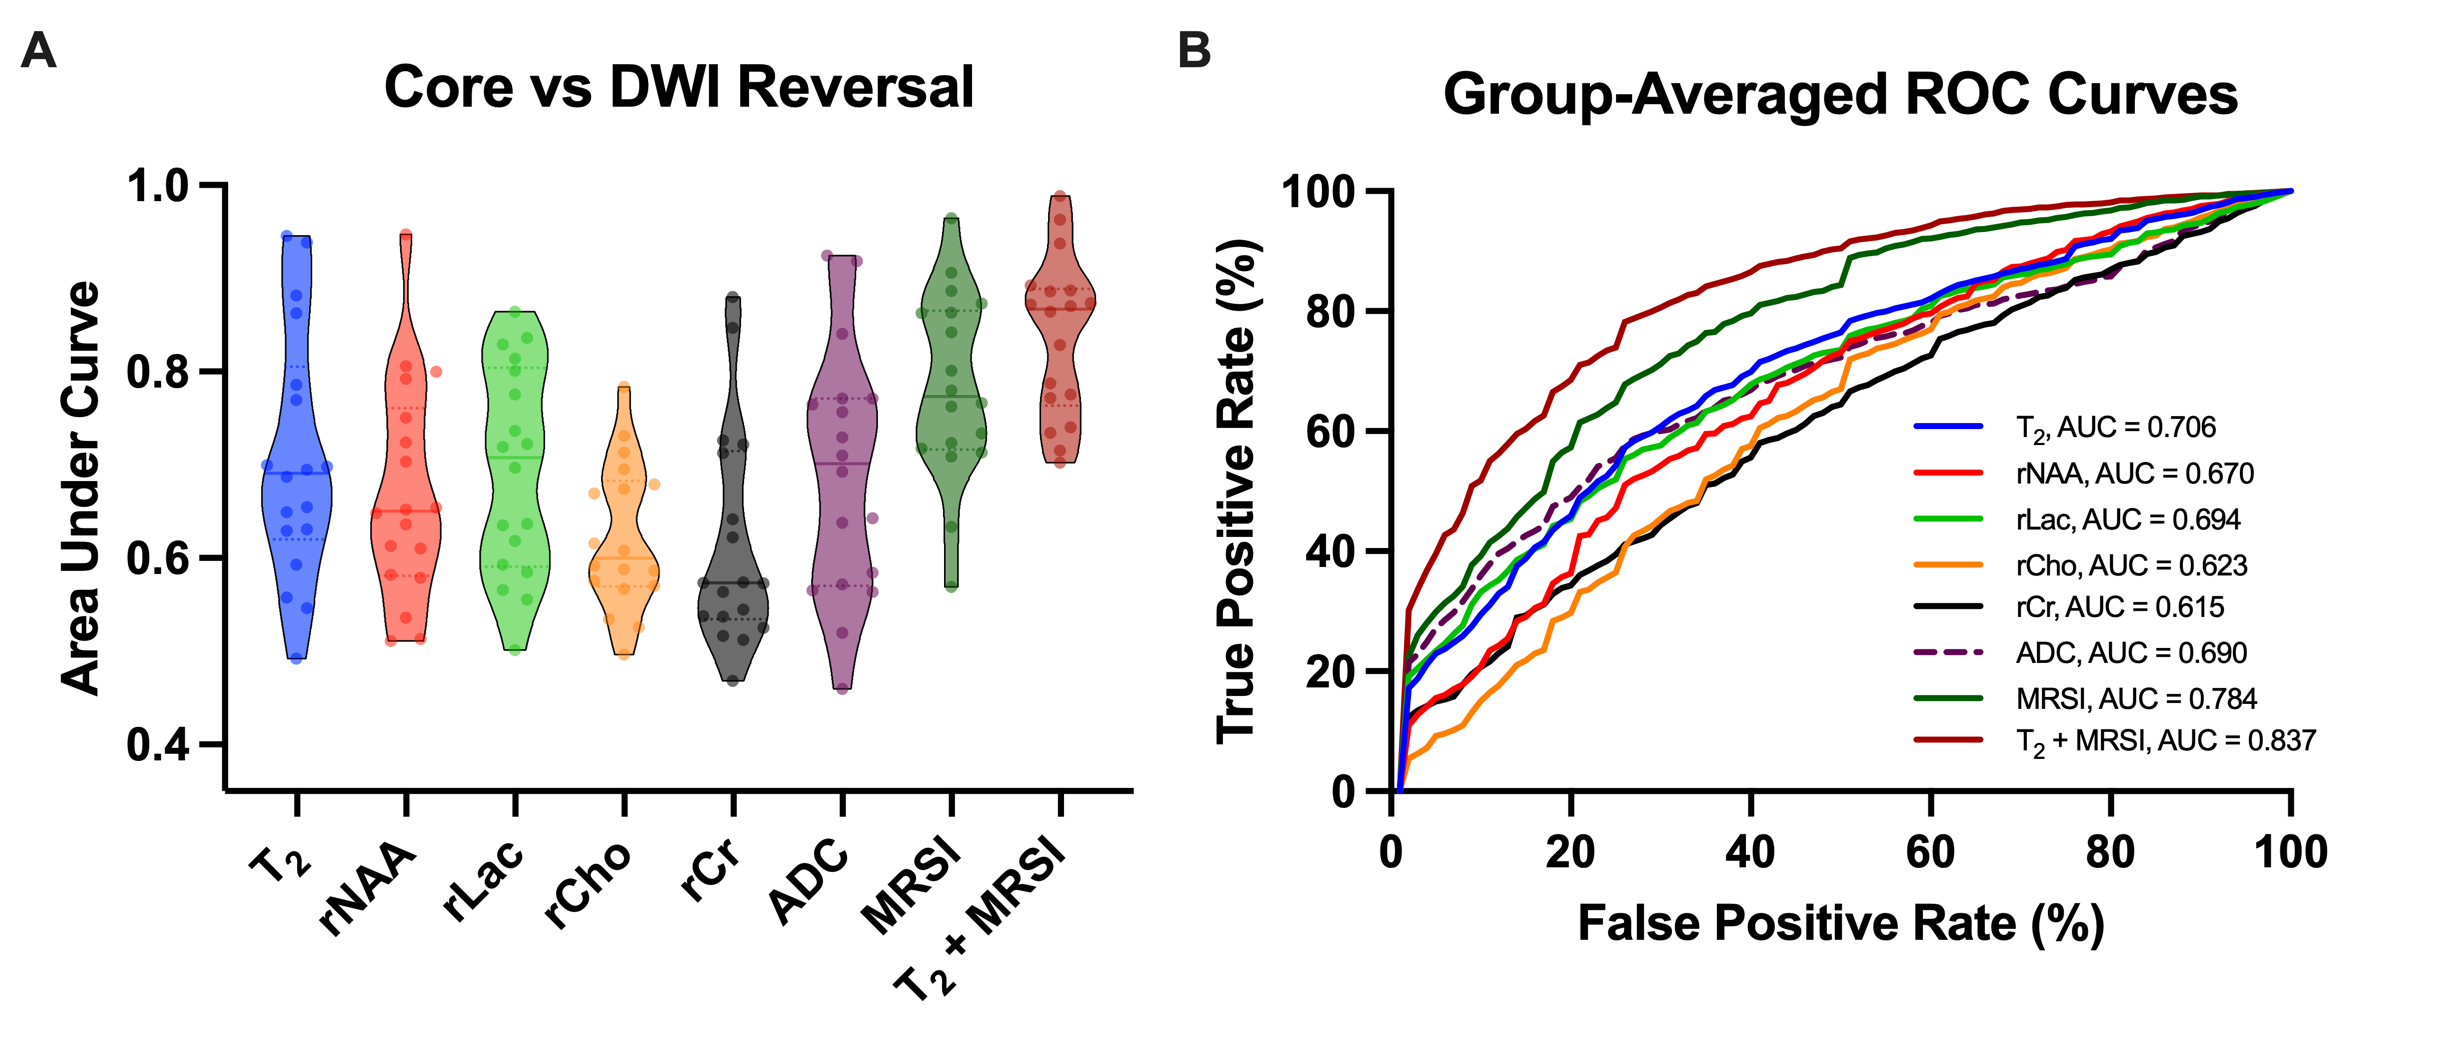
Relative neurometabolite concentrations and CBF values were used for analysis, which were normalized by those in the contralateral regions. Wilcoxon signed-rank tests were performed for group comparisons. Receiver operating characteristic (ROC) curve analyses were used to compare the discrimination performance among different ROIs using the voxel-wise data of all the image biomarkers.
Results
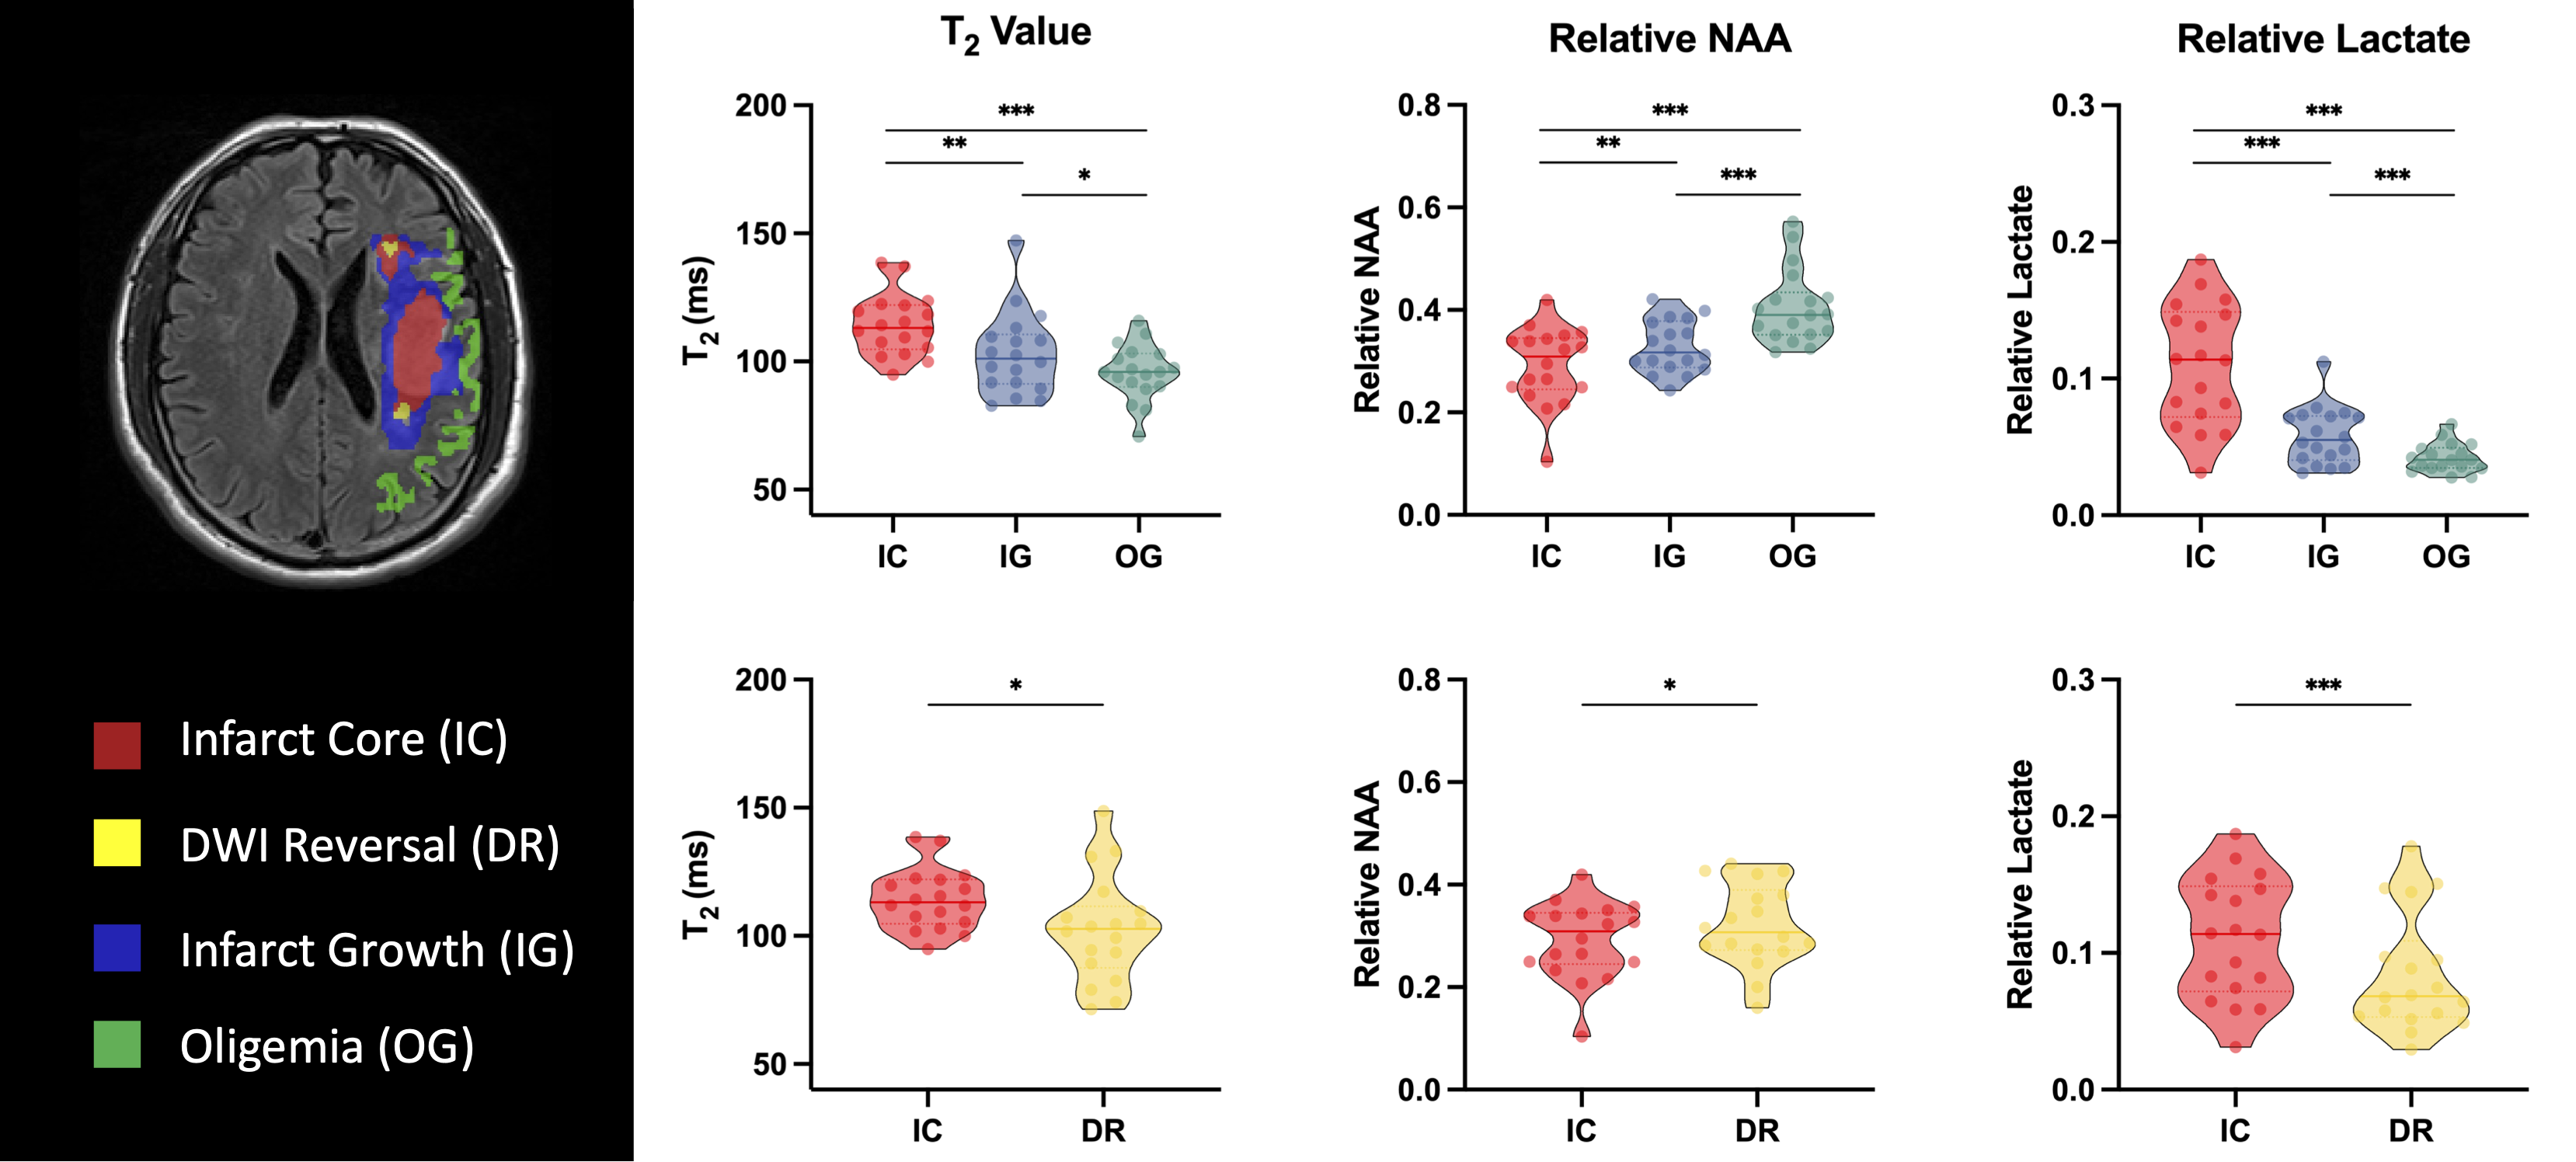
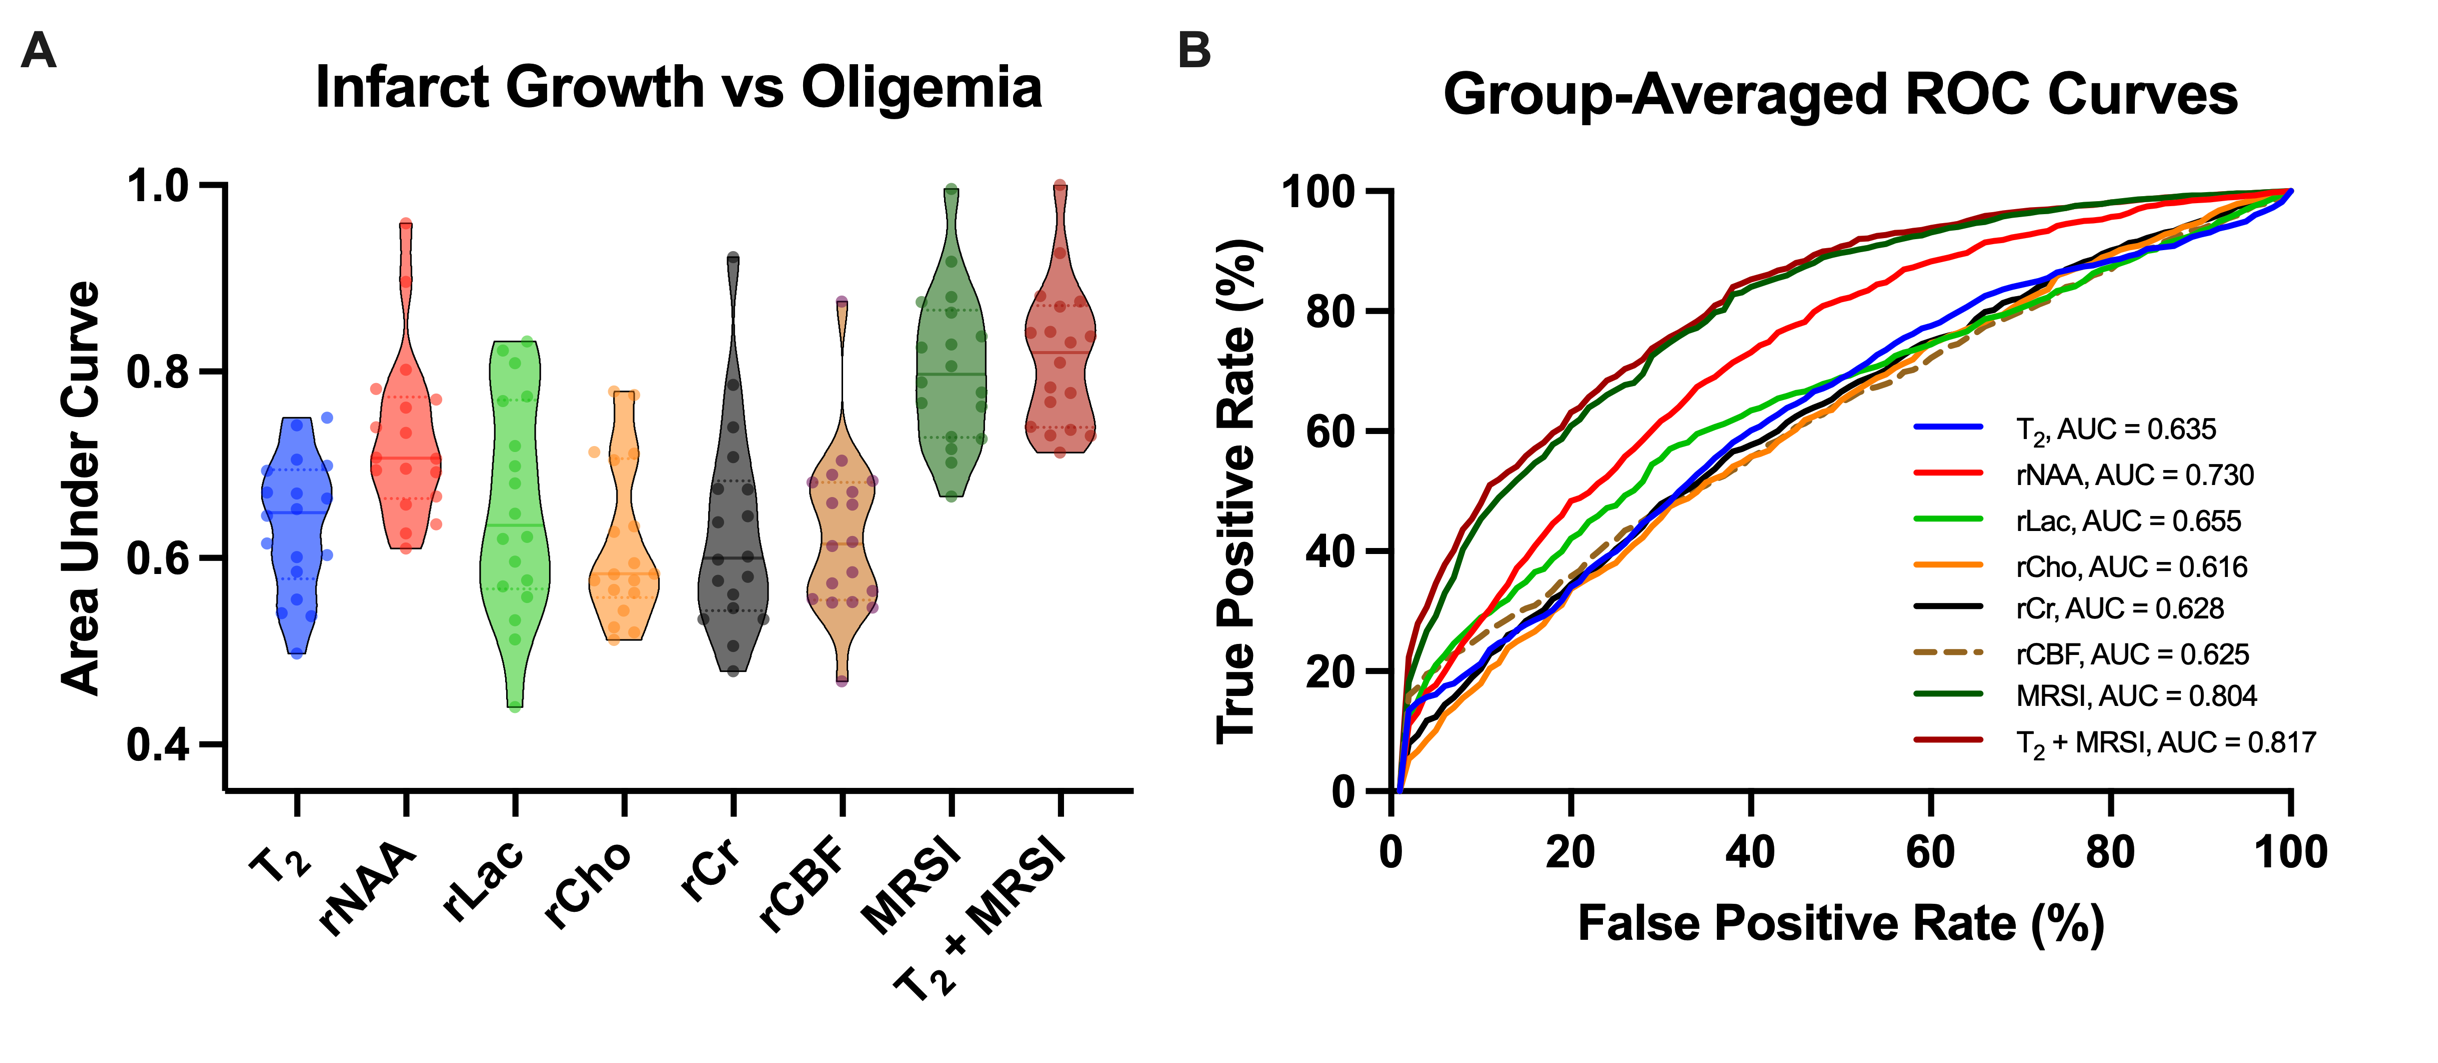
Multimodal images including 3D-MRSI maps of NAA, lactate, creatine, and choline, quantitative T2, ASL-PWI, ADC, DWI, and FLAIR maps from one representative acute ischemic stroke patient are shown in Fig.1. Reduction in NAA and elevation in lactate and T2 values were observed in the vicinity of the lesion. Figure 2 shows the group comparison results of the multimodal imaging biomarkers among infarct core, DWI reversal, infarct growth, and oligemia regions. Lactate and T2 values within the infarct core were higher than those within the infarct growth (Lac: P<0.001; T2: P<0.01), which in turn were higher than those in the oligemia region (Lac: P<0.001; T2: P<0.05). NAA values within the infarct core were lower than those within the infarct growth (P<0.01), which in turn were lower than those in the oligemia region (P<0.001). The DWI reversal area showed lower lactate (P<0.001) and T2 values (P<0.05) than those in the infarct core. Figure 3 compares the performance of different biomarkers in differentiating voxels between infarct core and DWI reversal regions. The combination of MRSI and T2 showed significantly higher AUC than ADC (MRSI+ T2: 0.837; MRSI: 0.784; ADC: 0.690). Our proposed multimodal imaging approach also achieved the best discrimination performance in differentiating voxels between infarct growth and oligemia regions, as shown in Fig 4. The combination of MRSI and T2 yielded the highest AUC among all (MRSI+ T2: 0.817; MRSI: 0.804; CBF: 0.625).Conclusion
Using a combined high-resolution 3D-MRSI and quantitative T2 imaging approach, we showed improved assessment of brain tissue viability in patients with acute ischemic stroke.Acknowledgements
This work was supported by Shanghai Pilot Program for Basic Research—Shanghai Jiao Tong University (21TQ1400203), the National Natural Science Foundation of China (81871083), and Key Program of Multidisciplinary Cross Research Foundation of Shanghai Jiao Tong University (YG2021ZD28; YG2022QN035; YG2021QN40).References
1. Schlaug G, Benfield A, Baird A, et al. The ischemic penumbra: Operationally defined by diffusion and perfusion MRI. Neurology. 1999;53(7):1528-1528.
2. Gwak DS, Choi W, Shim DH, et al. Role of apparent diffusion coefficient gradient within diffusion lesions in outcomes of large stroke after thrombectomy. Stroke. 2022;29(2):921-929.
3. Li Y, Wang T, Zhang T, et al. Fast high-resolution metabolic imaging of acute stroke with 3D magnetic resonance spectroscopy. Brain. 2021;143(11):3225-3233.
4. Scheldeman L, Wouters A, Dupont P, et al. Reversible edema in the penumbra correlates with severity of hypoperfusion. Stroke. 2021;52(7):2338-2346.
5. Barker PB, Gillard JH, Van Zijl PCM, et al. Acute stroke: Evaluation with serial proton MR spectroscopic imaging. Radiology. 1994;192(3):723-732.
6. Liang ZP. Spatiotemporal imaging with partially separable functions. In: Proceedings of the 4th IEEE International Symposium on Biomedical Imaging: From Nano to Macro. 2007:988-991.
7. Lam F, Ma C, Clifford B, Johnson CL, Liang ZP. High-resolution 1H-MRSI of the brain using SPICE: Data acquisition and image reconstruction. Magn Reson Med. 2016;76(4):1059-1070.
8. Ma C, Lam F, Johnson CL, Liang ZP. Removal of nuisance signals from limited and sparse 1H MRSI data using a union-of-subspaces model. Magn Reson Med. 2016;75(2):488-497.
9. Li Y, Lam F, Clifford B, Liang Z. A subspace approach to spectral quantification for MR spectroscopic imaging. IEEE Trans Biomed Eng. 2017;64(10):2486-2489.
10. Zhang T, Guo R, Li Y, Zhao Y, Li Y, Liang Z-P. T2′ mapping of the brain from water-unsuppressed 1H-MRSI and turbo spin-echo data. Magn Reson Med. 2022;88(5):2198-2207.
11. Wang Z, Aguirre G K, Rao H, et al. Empirical optimization of ASL data analysis using an ASL data processing toolbox: ASLtbx. Magn Reson Imaging. 2008;26(2): 261-269.
Figures