3473
Inter-scanner consistency of T1 map and proton spin density map derived from strategically acquired gradient echo (STAGE) imaging1Department of Diagnostic Imaging and Nuclear Medicine, Kyoto University Graduate School of Medicine, Kyoto, Japan
Synopsis
Keywords: Quantitative Imaging, Brain
Recently, strategically acquired gradient echo (STAGE) imaging has been developed as a potential standardized brain imaging protocol. STAGE is designed to use two 3D fully flow compensated multi-echo SWI sequences with 2 different flip angles (FAs). We evaluated the inter-scanner consistency of T1 values and proton spin density (PSD) values derived from STAGE imaging for elderly healthy volunteers. We conducted VOI analysis both in Native space and “Mutual space” using AAL3 VOIs. Parcellation was automatically performed with few manipulations, and good ICC and minimal biases were demonstrated between the two scanners.Introduction
Multi-contrast imaging provides both qualitative and quantitative images at the same time, which is suitable for serving as a standardized protocol for various brain diseases (1, 2). Recently, strategically acquired gradient echo (STAGE) imaging has been developed as a potential standardized brain imaging protocol. STAGE is designed to use two fully flow compensated multi-echo SWI sequences with 2 different flip angles (FAs) (3). The 2 FAs are used to compensate the transmit and receiver field effects associated with both RF penetration artifacts and slice profile effects, thus various uniform quantitative and qualitative images are created including T1, proton spin density (PSD), R2*, and magnetic susceptibility values (4, 5).Although previous papers have studied the reproducibility of T1 and PSD maps (6), inter-scanner consistency has not been studied well, especially for elderly subjects. We focused on inter-scanner consistency of T1 and PSD maps derived from STAGE imaging. The purpose of this study was to evaluate the inter-scanner consistency of T1 and PSD values for elderly healthy volunteers.
Methods
SubjectsFourteen subjects (average: 64 years [range: 40-84 years old]; 9 males; 5 females) were enrolled. This prospective study was approved by the institutional review board. Written informed consent was obtained from each subject.
Image Acquisition
Image acquisition was conducted using two 3T MR scanners (MAGNETOM Prisma and Vida, Siemens Healthineers, Erlangen, Germany) with a 64-channel head/neck coil and a 32-channel head coil, respectively. Subjects underwent STAGE acquisition (T1-weighted SWI and PD-weighted SWI) on both scanners. Imaging parameters were as follows: T1-weighted SWI (T1-SWI): TR, 29 ms; TEs, 7.5/15/22.5 ms; FA, 27°; FOV, 256 × 192 mm2; voxel size, 0.67 × 1 × 1.34 mm3; number of slices, 112; bandwidth, 210/160/160 Hz/pixel; acceleration factor, GRAPPA 2; acquisition time, 4 min 48 sec. PD-weighted SWI (PD-DWI): same as T1-SWI except FA of 6°. 3D T1-weighted MRI (MPRAGE) was also obtained: TR, 2300 ms, TE, 3.52 ms; TI, 961 ms; FA, 9°; FOV, 230 × 230; voxel size 0.9 × 0.9 × 0.9 mm3; number of slices, 240; bandwidth 197 Hz/pixel; acceleration factor, Wave-Caipi 3 × 2, acquisition time, 1 min 46 sec.
Image Analysis
STAGE analysis
T1-SWI and PD-SWI data acquired from the scanner were transferred to the STAGE module for post-processing (SpinTech, Inc., Bingham Farms, MI, USA). Various quantitative and qualitative STAGE output data including T1 and PSD maps were automatically sent back to the MR scanners.
Native space
3D T1WI was registered to the T1 and PSD maps using SPM12 Software (https://www.fil.ion.ucl.ac.uk) followed by brainstorm (https://neuroimage.usc.edu/brainstorm/) with CAT12 (https://neuro-jena.github.io/cat/) to segment each registered 3D T1WI (7). Brain masks were created using tissue segmentation results to avoid including CSF segments, and AAL3 VOIs were applied to measure each value.
Mutual space
Mean images of the T1 and PSD maps were created for each subject by the realign function of SPM12. Next, each of the T1 and PSD maps was registered to the corresponding mean image. Then, AAL3 VOIs were applied (Figure 1).
Statistical Analysis
Intraclass coefficients (ICC) for T1 and PSD maps were evaluated between the two scanners. Statistical analysis was performed using MedCalc version 16.200 (MedCalc Software Ltd, Ostend, Belgium). Asymmetry index was also calculated between the two scanners.
Results
T1 and PSD maps created from the STAGE protocol showed similar quantitative values between the two MR scanners (Figure 2, Table 1). ICCs of for the T1 and PSD maps are shown in Table 2. ICCs of native space and mutual space were comparable. The asymmetry index of the T1 map in Native space was 3.89 [1.84-7.37] and in Mutual space was 2.67 [1.33-5.09] while that of the PSD map in Native space was 1.05 [0.47-1.94] and in Mutual space was 0.97 [0.44-1.83], respectively (Table 2). Bland-Altman plots are shown in Figure 3, and most of the VOIs of Native space and Mutual space fall within the 1.96 standard deviation lines.Discussion
We conducted VOI analysis both in Native space and “Mutual space” using AAL3 VOIs. Parcellation was automatically performed with few manipulations, and good ICC and minimal biases were demonstrated between two scanners. Elderly subjects are prone to a relatively large CSF space in the brain scan. The CSF component shows high T1 values (e.g. > 2000ms) and high PSD values (nearly 100%), and the partial volume effect of CSF affected the results even though we used a brain mask to avoid CSF contamination.Limitations: Only a limited number of subjects were enrolled in this study. We have not conducted intrascanner reproducibility of T1 and PSD maps in this study nor were R2* maps or QSM data from STAGE analyzed in this paper.
Conclusion
This study showed inter-scanner consistency of 1 to 4% asymmetry in the T1 and proton spin density maps derived from strategically acquired gradient echo (STAGE) imaging in our elderly subjects.Acknowledgements
No acknowledgement found.References
1. Ma D, Gulani V, Seiberlich N, Liu K, Sunshine JL, Duerk JL, Griswold MA. Magnetic resonance fingerprinting. Nature 2013;495(7440):187-192. doi: 10.1038/nature11971
2. Hagiwara A, Warntjes M, Hori M, Andica C, Nakazawa M, Kumamaru KK, Abe O, Aoki S. SyMRI of the Brain: Rapid Quantification of Relaxation Rates and Proton Density, With Synthetic MRI, Automatic Brain Segmentation, and Myelin Measurement. Invest Radiol 2017;52(10):647-657. doi: 10.1097/RLI.0000000000000365
3. Haacke EM, Chen Y, Utriainen D, Wu B, Wang Y, Xia S, He N, Zhang C, Wang X, Lagana MM, Luo Y, Fatemi A, Liu S, Gharabaghi S, Wu D, Sethi SK, Huang F, Sun T, Qu F, Yadav BK, Ma X, Bai Y, Wang M, Cheng J, Yan F. STrategically Acquired Gradient Echo (STAGE) imaging, part III: Technical advances and clinical applications of a rapid multi-contrast multi-parametric brain imaging method. Magn Reson Imaging 2020;65:15-26. doi: 10.1016/j.mri.2019.09.006
4. Wang Y, Chen Y, Wu D, Wang Y, Sethi SK, Yang G, Xie H, Xia S, Haacke EM. STrategically Acquired Gradient Echo (STAGE) imaging, part II: Correcting for RF inhomogeneities in estimating T1 and proton density. Magn Reson Imaging 2018;46:140-150. doi: 10.1016/j.mri.2017.10.006
5. Chen Y, Liu S, Wang Y, Kang Y, Haacke EM. STrategically Acquired Gradient Echo (STAGE) imaging, part I: Creating enhanced T1 contrast and standardized susceptibility weighted imaging and quantitative susceptibility mapping. Magn Reson Imaging 2018;46:130-139. doi: 10.1016/j.mri.2017.10.005
6. He N, Wu B, Liu Y, Zhang C, Cheng J, Gao B, Miao Y, Wu W, Wang L, Sun R, Sun W, Xu H, Bai Y, Wang M, Chai C, Xia S, Zheng Q, Li Y, Qin Y, Liao W, Chen Y, Jokar M, Wang Y, Yan F, Haacke EM. STAGE as a multicenter, multivendor protocol for imaging Parkinson’s disease: a validation study on healthy controls. Chinese Journal of Academic Radiology 2022;5(1):47-60. doi: 10.1007/s42058-022-00089-3
7. Tadel F, Baillet S, Mosher JC, Pantazis D, Leahy RM. Brainstorm: a user-friendly application for MEG/EEG analysis. Comput Intell Neurosci 2011;2011:879716. doi: 10.1155/2011/879716
Figures
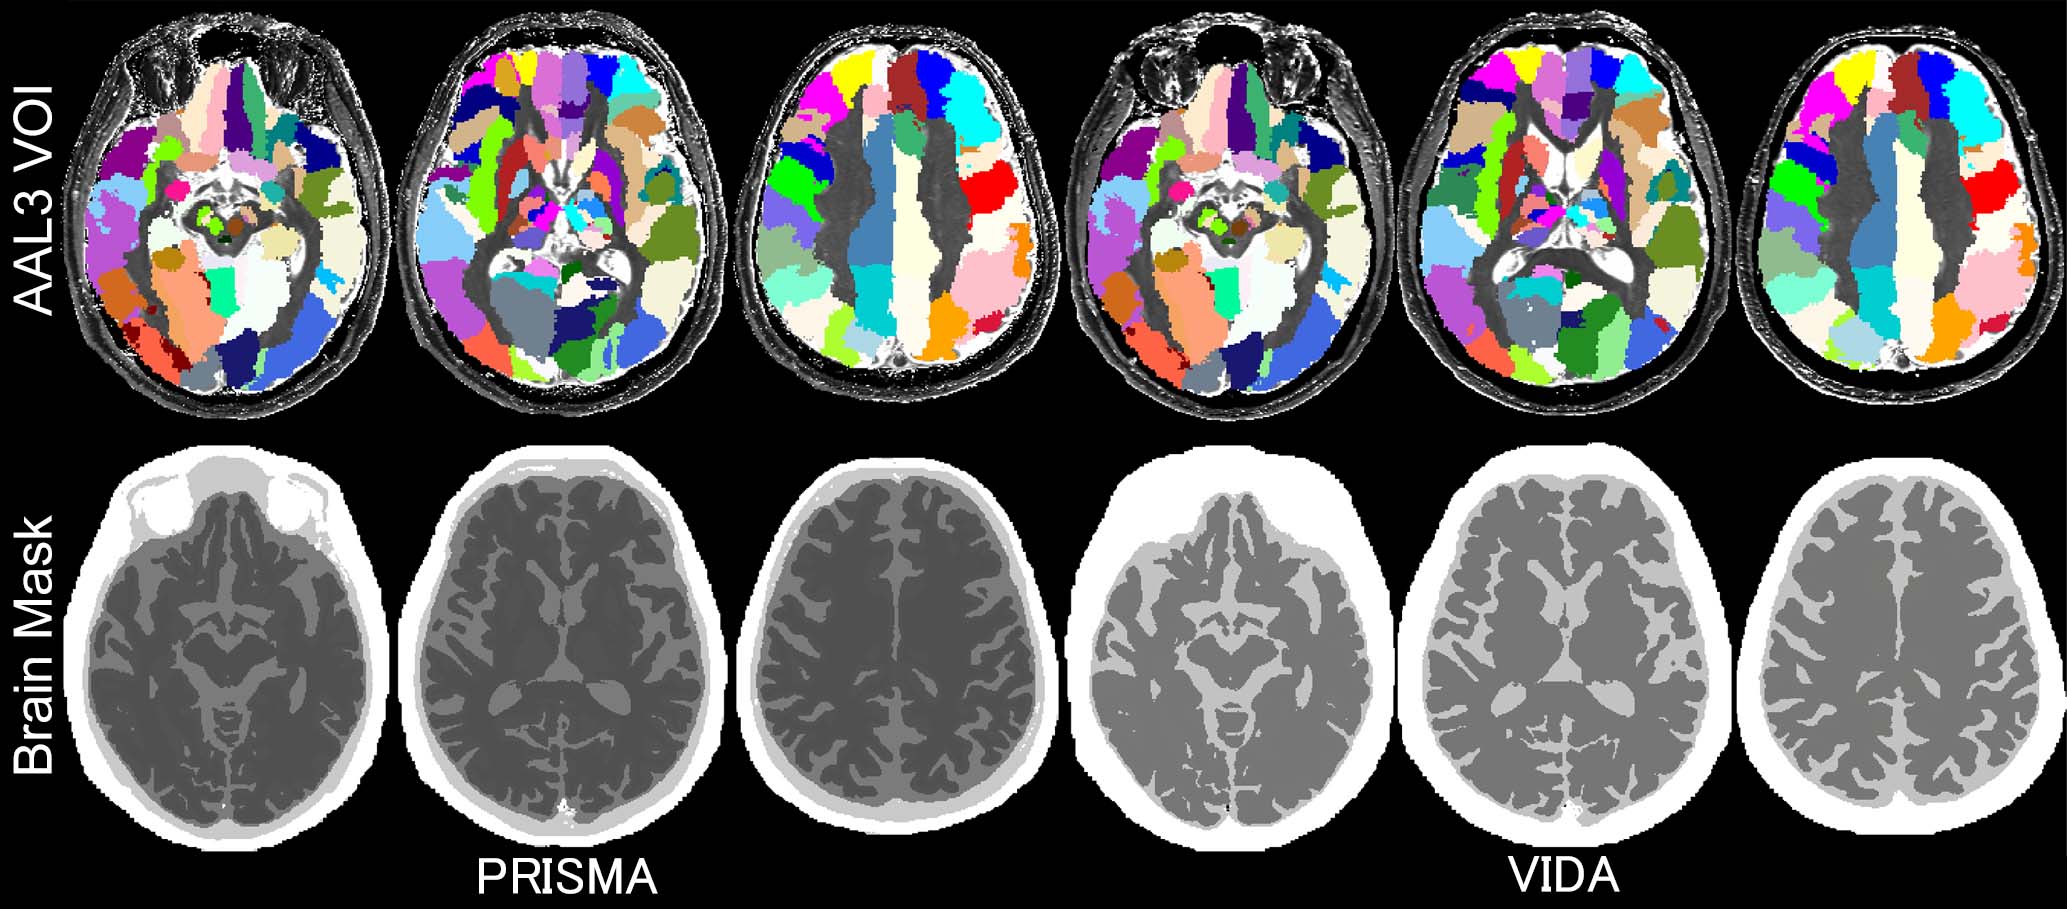
Figure 1. Parcellation with AAL3 VOIs is shown (Native space). A brain mask was applied to avoid including signal from CSF. Note that parcellation with AAL3 VOIs in Mutual space is not shown.
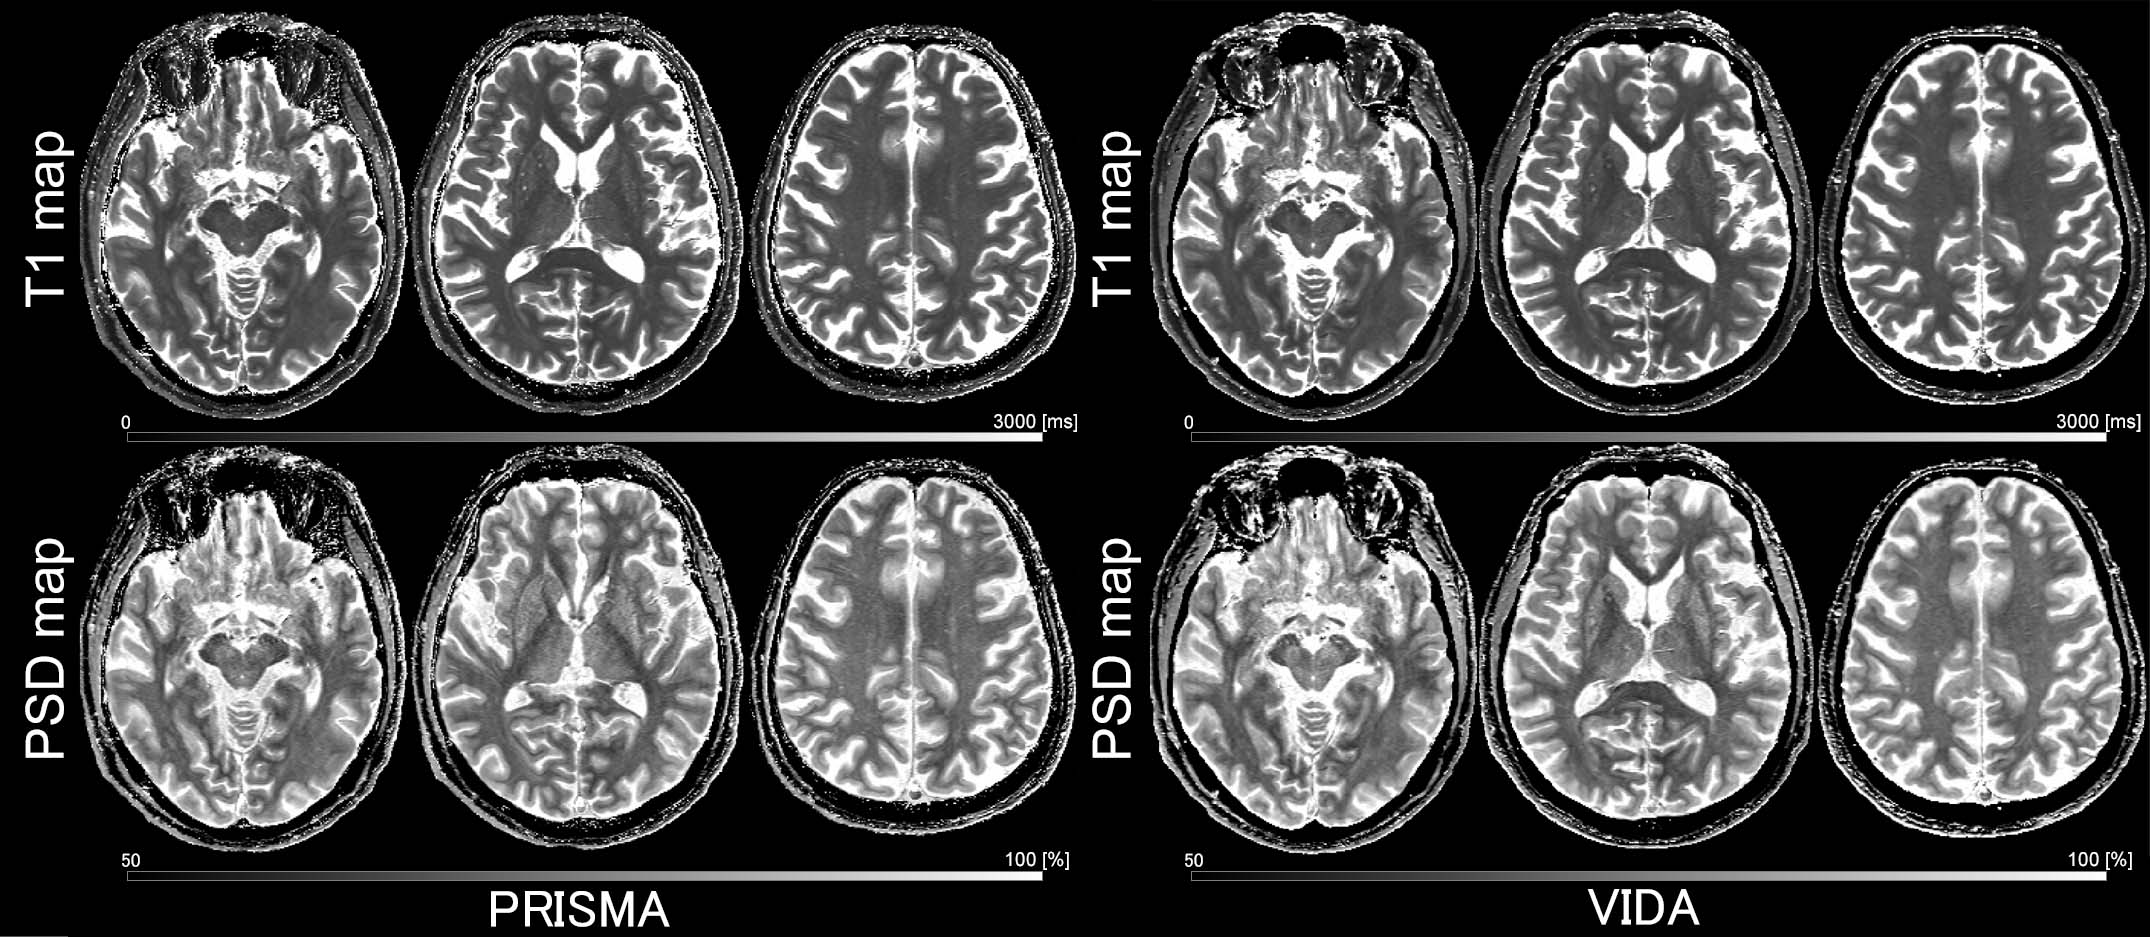
Figure 2. A 78-year-old male, a healthy subject. Representative native space images of T1 and PSD maps obtained from two magnets (PRISMA and VIDA) are shown. Both images appear relatively similar.
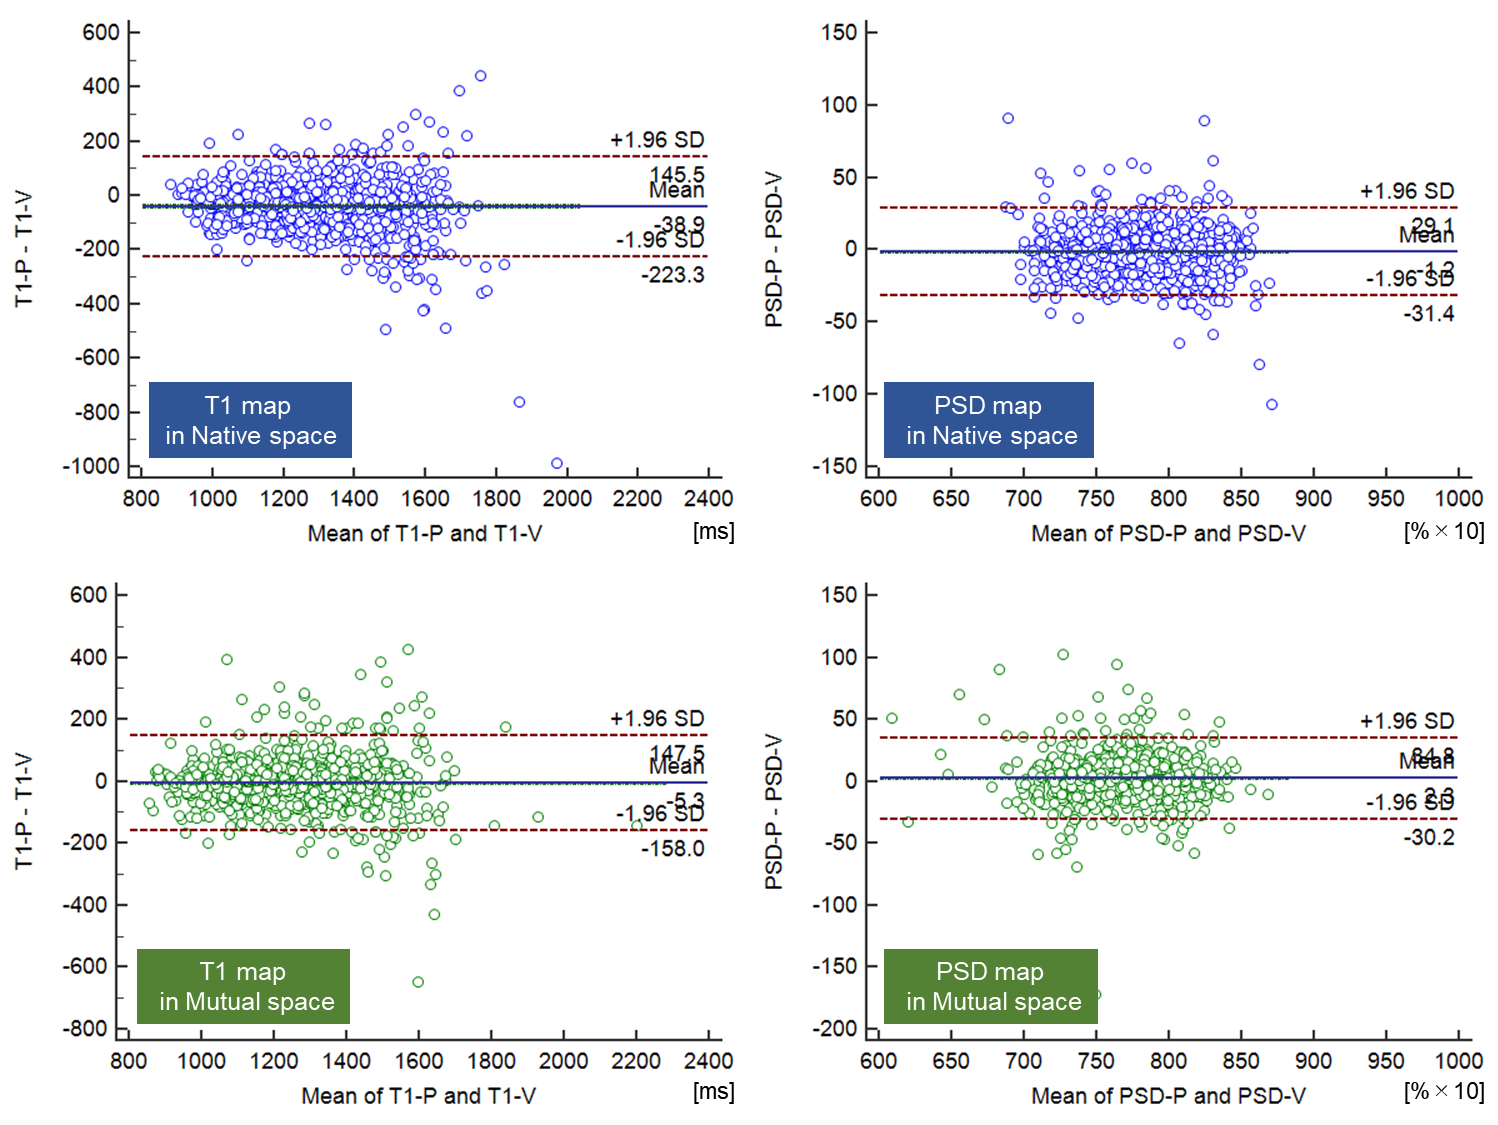
Figure 3. Bland-Altman plots of T1 and PSD maps in Native space (blue) and Mutual space (green) are shown.
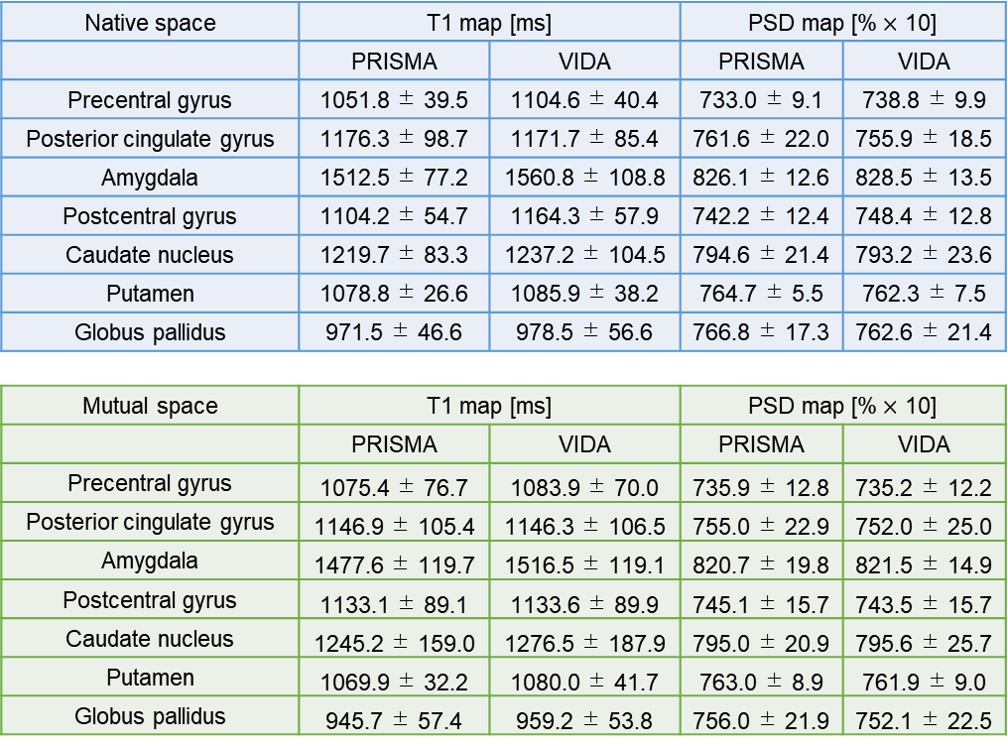
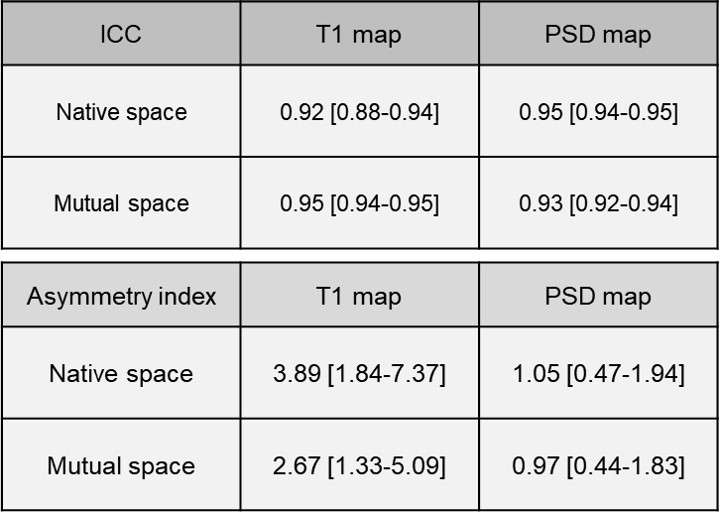
Table 2. ICC and Asymmetry index of the T1 and PSD maps between two scanners are shown.