3471
Improving the robustness of independent component analysis for denoising multi-echo fMRI data1The Florey Institute of Neuroscience and Mental Health, Heidelberg, Australia, 2Florey Department of Neuroscience and Mental Health, University of Melbourne, Melbourne, Australia
Synopsis
Keywords: Data Analysis, fMRI (task based)
Multi-Echo fMRI data acquisition has multiple advantages over single-echo acquisition. Principal amongst them is that multiple echoes can distinguish neural activity from artefacts. TE Dependent ANAlysis (TEDANA) is an existing software tool designed to denoise multi-echo fMRI datasets. We evaluated the performance of TEDANA to denoise fMRI data of 120 subjects. Our results demonstrated that TEDANA improved the activation detection at a group level. However, for a subset of subjects TEDANA degraded their individual result substantially. We identified potential causes and proposed a modified framework for multi-echo data analysis that provides reasonable results at an individual subject level.Introduction
In single-echo fMRI image acquisition one volume with a given TE is acquired per TR. Conversely, in Multi-Echo (ME) acquisitions several sets of images are acquired per TR such that T2* is sampled during the transverse magnetization decay multiple times. Therefore, the T2* effect can be quantified at a voxel level1,2. Other advantages of ME acquisition include higher temporal Signal to Noise Ratio (tSNR) and higher Contrast to Noise Ratio (CNR)1,2.Multi Echo Independent Component Analysis (ME-ICA) was introduced to distinguish Blood Oxygenation-Level dependent (BOLD) signal from non-BOLD signal through estimating initial intensity (S0) and T2* from multiple echoes. One decomposes the time-series into spatially independent components and subsequently classifies components as either BOLD or non-BOLD depending upon the echo-time dependency of the activity within the component1,2.
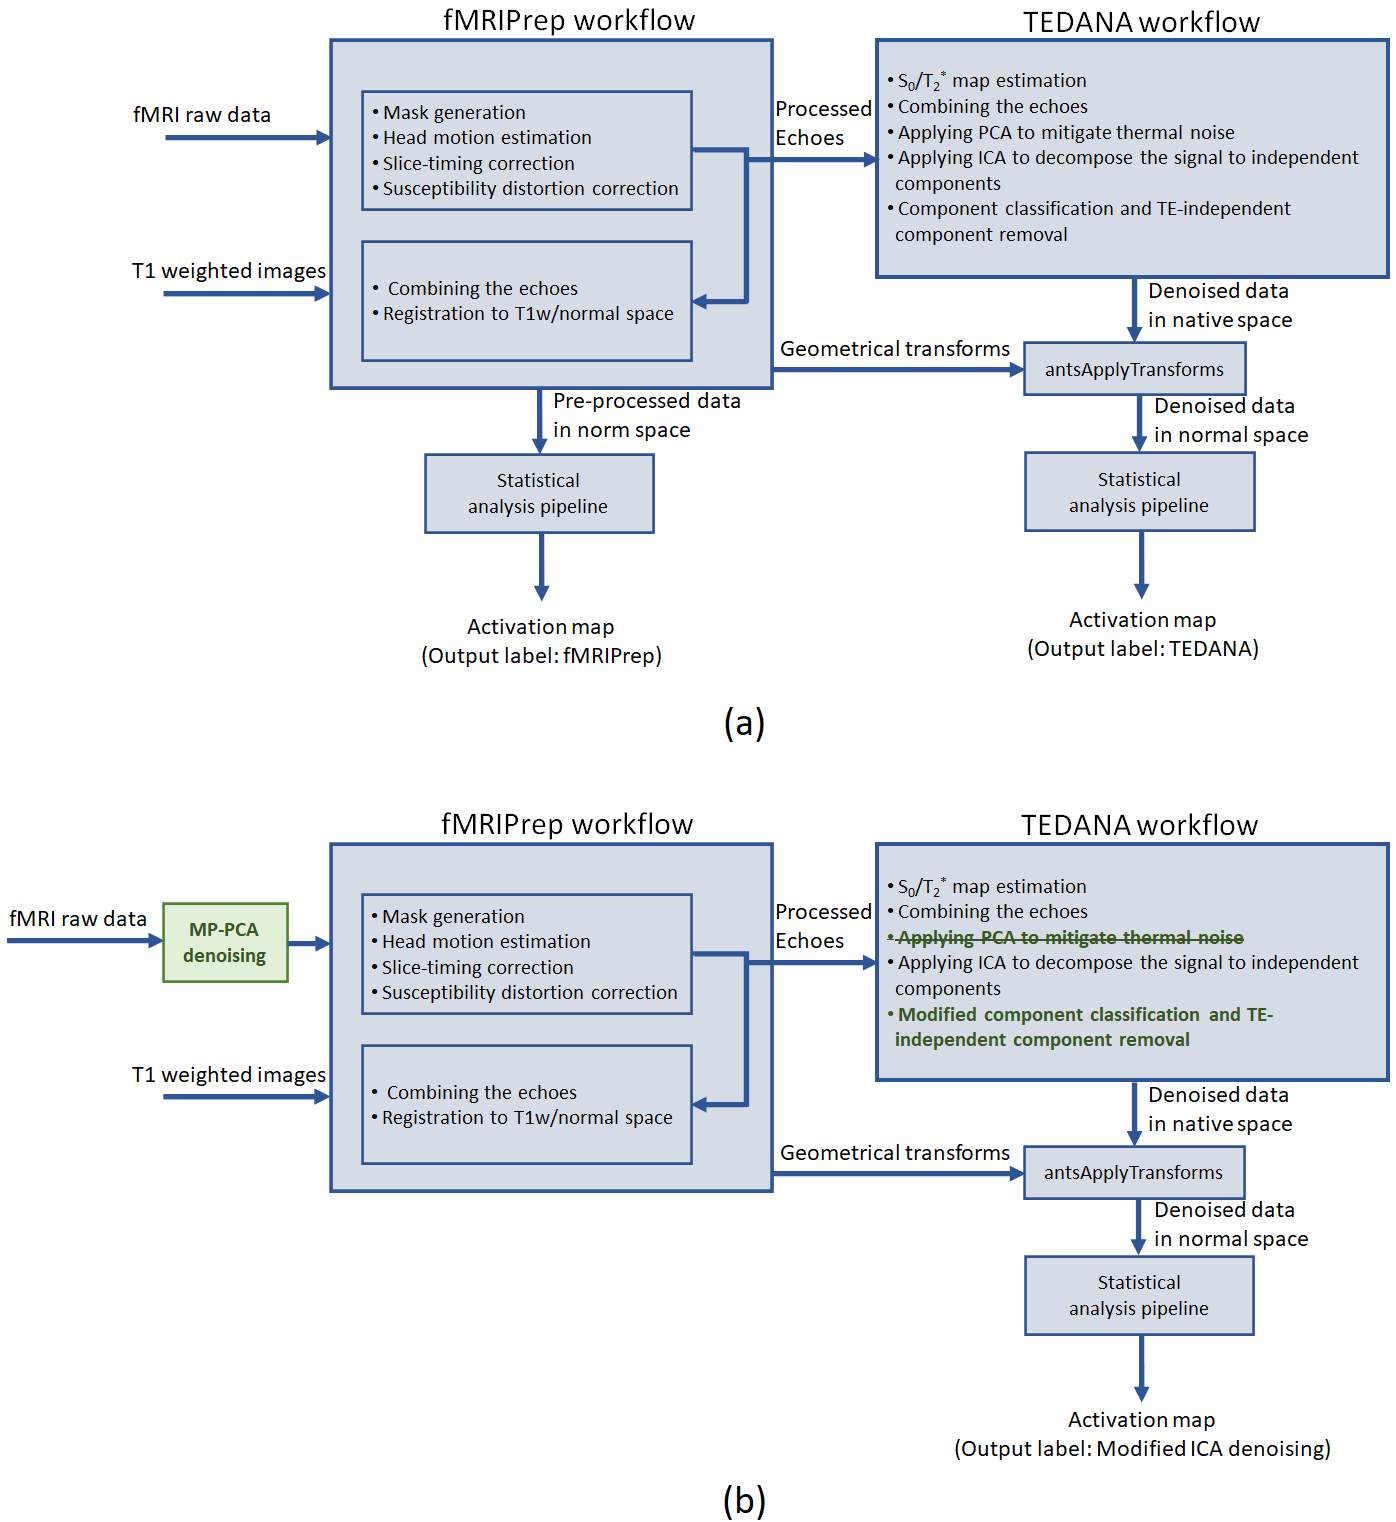
TE Dependent ANAlysis (TEDANA) emerged from ME-ICA as an open-source tool for denoising ME fMRI data that can support multiband acquisition as well3. Given that TEDANA is not a tool for typical pre-processing steps for raw fMRI data (image realignment to mitigate head motion, slice timing adjustment, etc), a pre-processing pipeline, e.g. fMRIPrep4 is typically also employed. TEDANA does not provide statistical analysis of denoised data, and thus another analysis package is usually employed to estimate the activation map. A typical workflow for ICA denoising of ME data using TEDANA is shown in Fig. 1(a).
In this study, we evaluated the performance of the ME denoising workflow using TEDANA. We demonstrated that through modification of this workflow robust results can be achieved at an individual-subject level.
Methods
We collected T1-weighted as well as multi-band multi-echo (MBME) fMRI data5 for 120 participants performing a language task in a 3T Siemens PrismaFit MRI scanner, with the following parameters: three echoes at TE = [15 33.25 51.5]ms, TR = 0.9s, MB factor = 4, FOV =216mm, voxel size = 3*3*3 mm3 and 202 volumes per subject with anterior-posterior phase encoding direction.The data were pre-processed using fMRIPrep (ver 21.0.2) and the resultant echoes were further processed using TEDANA (ver 12), see Fig. 1. We used the Akaike’s Information Criterion (AIC) for the PCA decomposition which is the least aggressive criterion. The results from fMRIPrep and TEDANA were analysed with the iBrain Analysis Toolbox for SPM6 with identical parameters to estimate activation maps for all subjects. We then calculated the volume of activation and mean t-score for each subject in the language area for both pipelines. Here, we labeled these outputs “fMRIPrep” and “TEDANA”.
A modified ICA ME denoising workflow is presented in Fig 1(b). In this workflow, we first applied Marchenko-Pastur PCA (MP-PCA) denoising to mitigate thermal noise7,8. As a result, the PCA step in TEDANA workflow was not required and so was removed. Furthermore, in the classification step, we kept mid-kappa components. Here, this output is labelled “Modified ICA denoising”.
Results
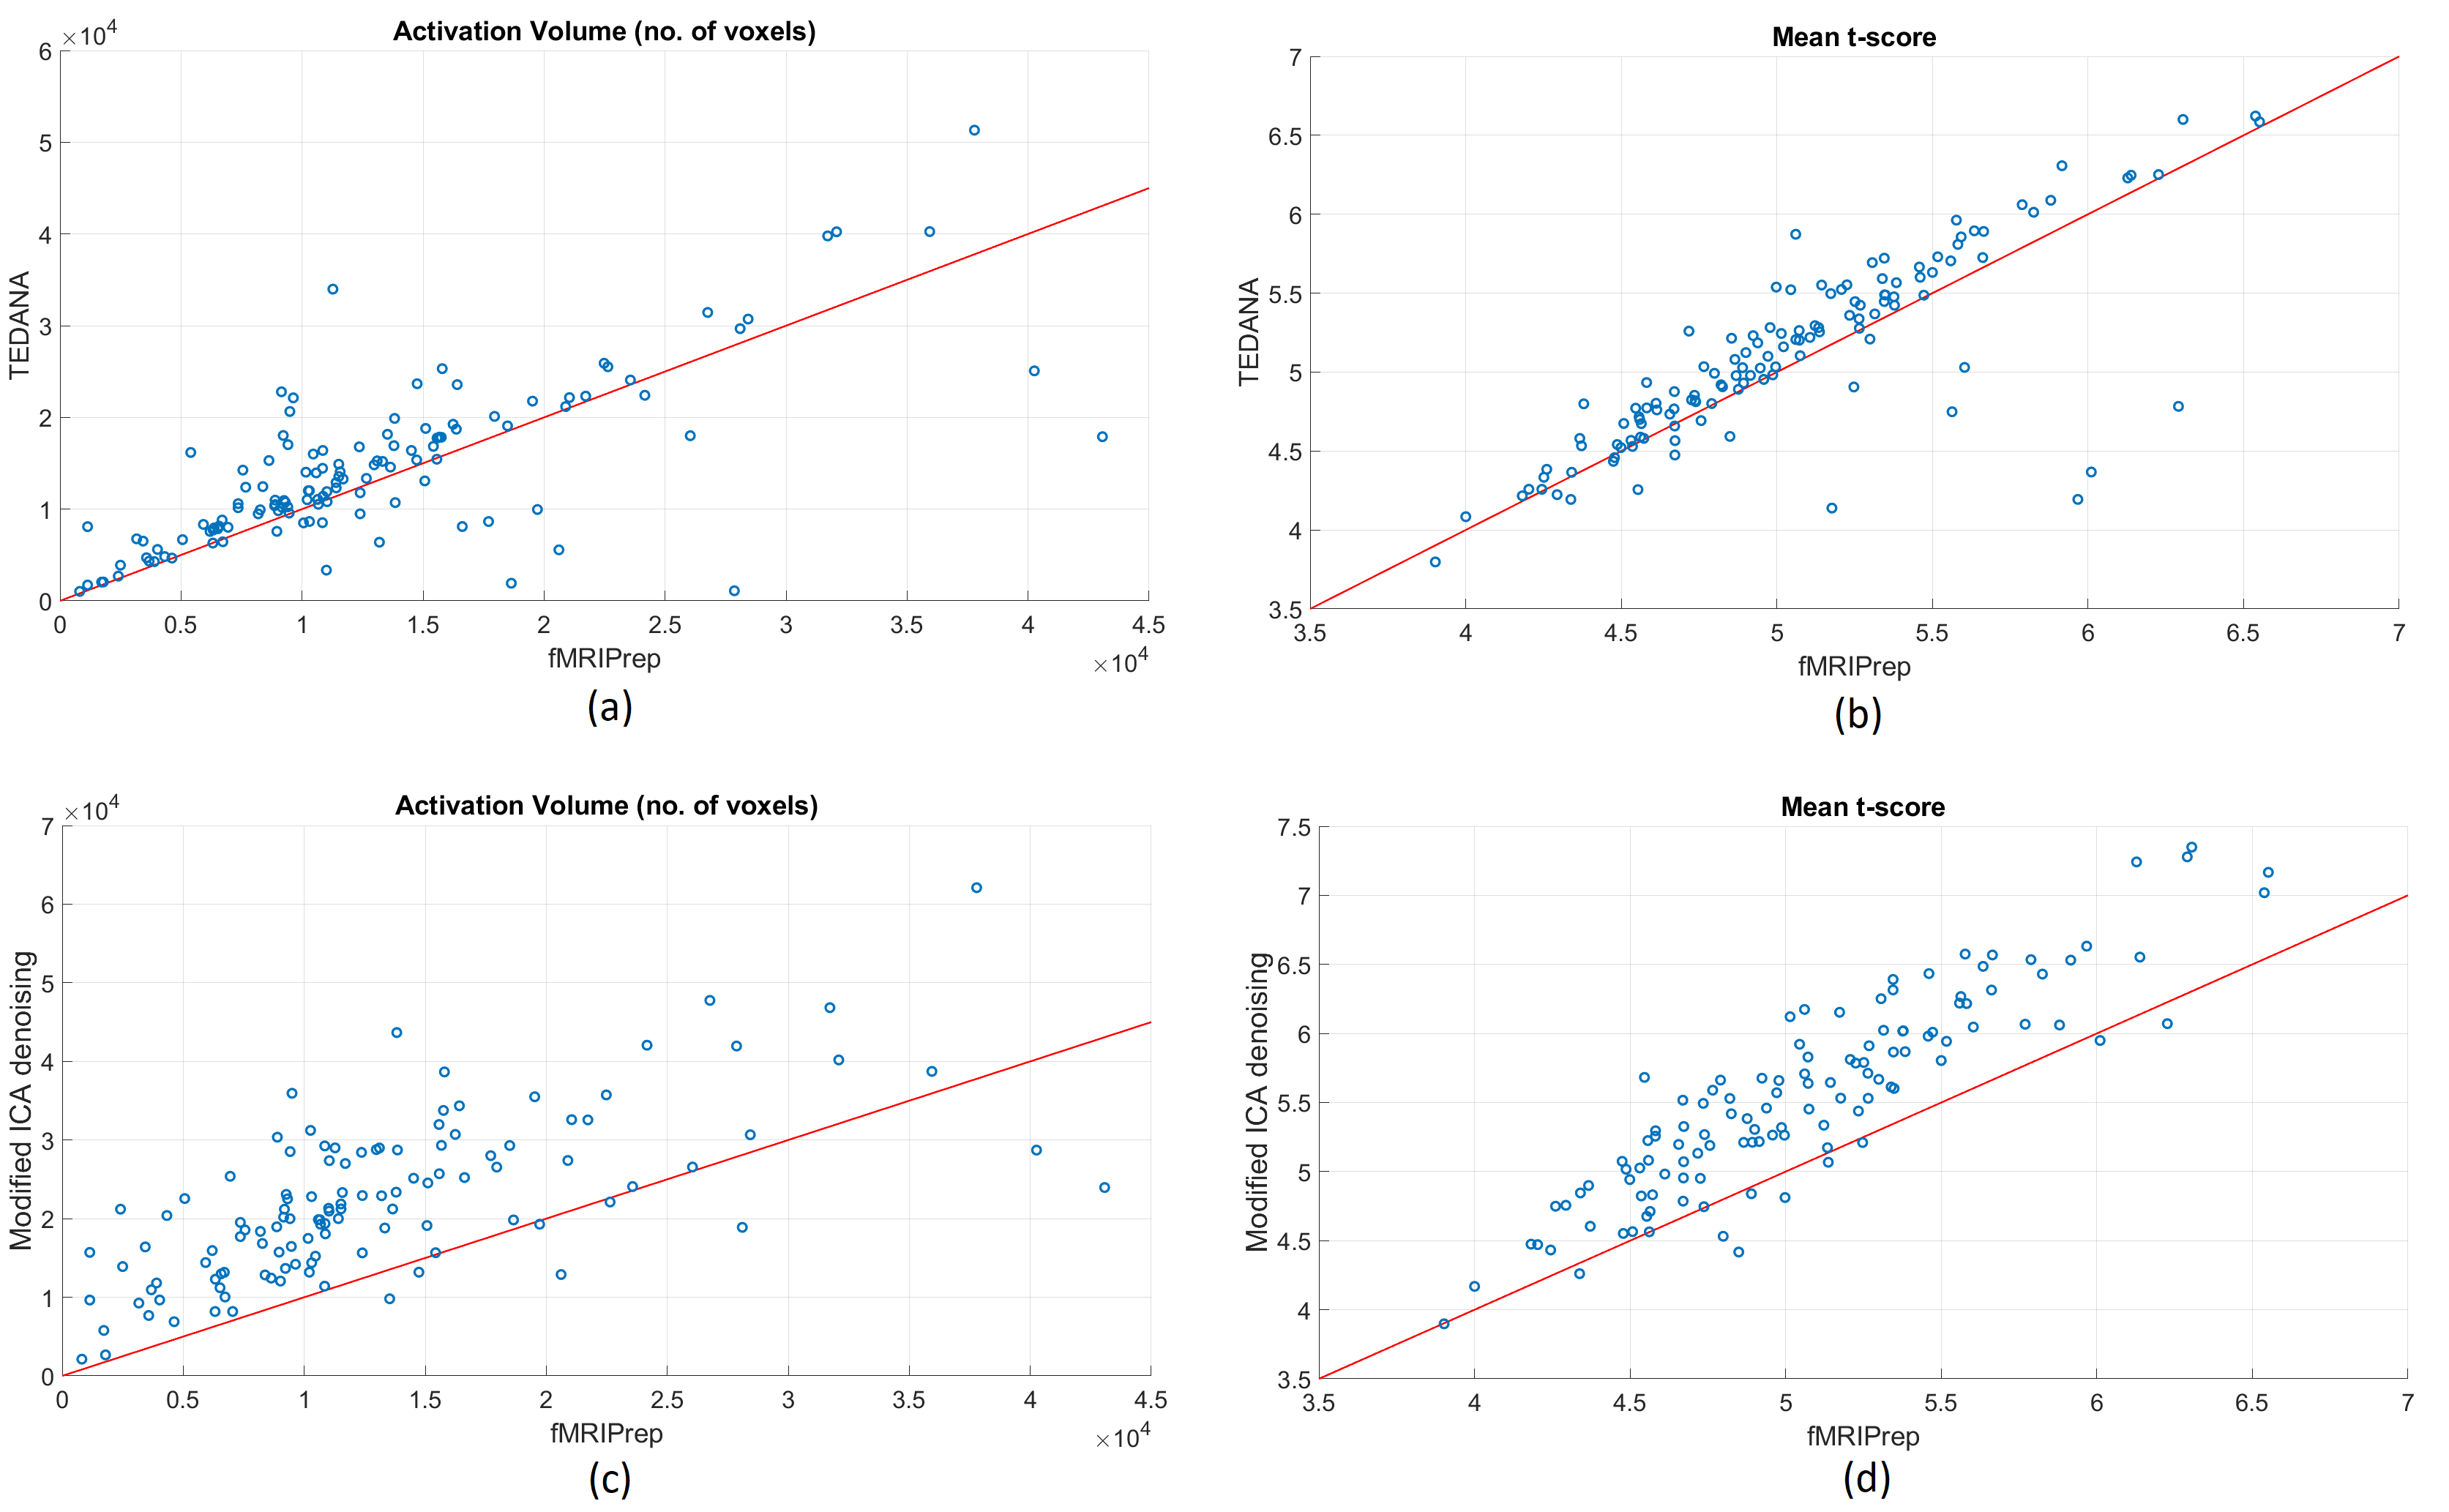
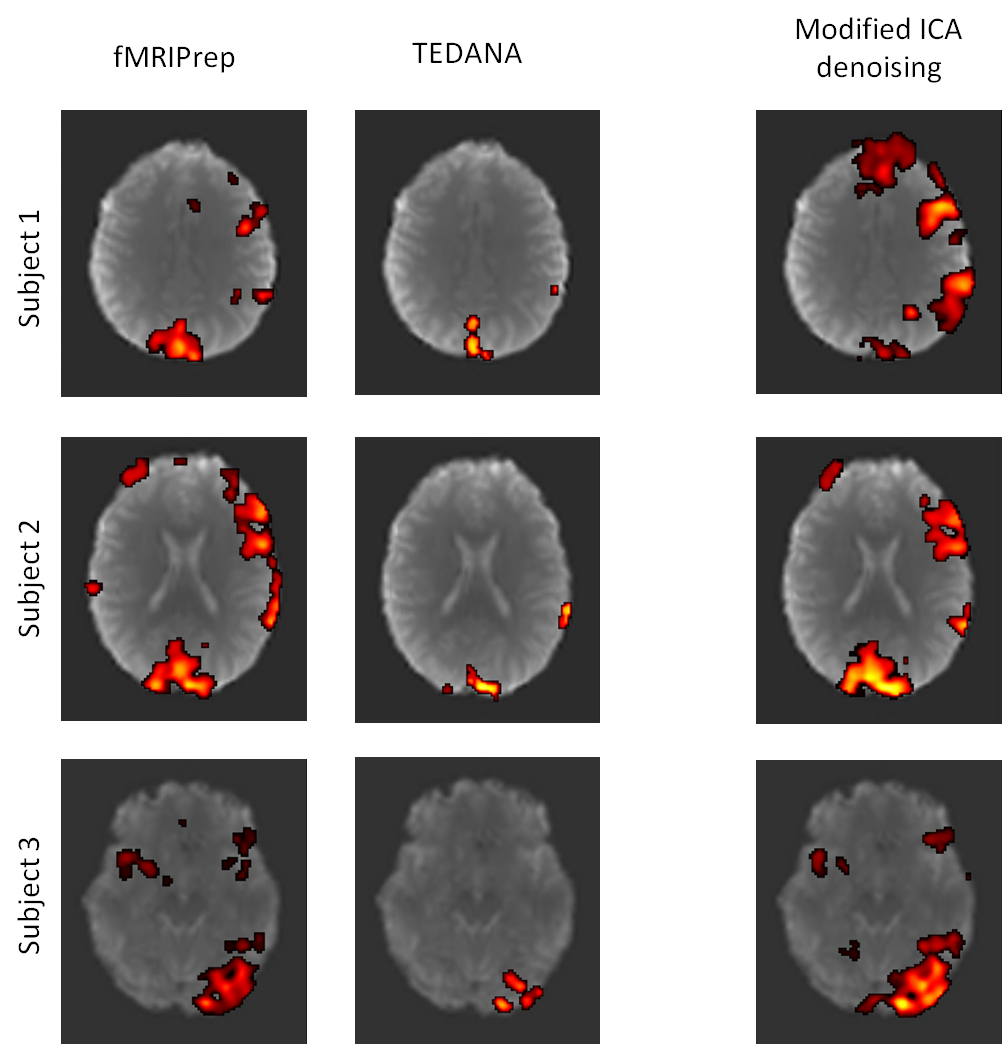
Fig. 2 demonstrates the Activation Volume (AV) as well as t-score for TEDANA and Modified ICA denoising in comparison to the fMRIPrep approach. A significant proportion of subjects, over 70%, have a higher AV when processed with TEDANA, see Fig 2(a). A similar statement is valid for the mean t-score, see Fig 2(b). However, a handful of subjects denoised by TEDANA have a considerably lower AV and t-score. Figs. 2(c) and 2(d) show the result for the Modified ICA denoising pipeline. In this pipeline, we did not identify any outlier and the result is reasonable for all subjects.Fig. 3 shows the analysis result for three outliers observed in TEDANA pipeline. This figure illustrates that TEDANA pipeline removed a significant amount of neural activity in the language area for these subjects while the modified denoising approach preserved the detection of these neural activities.
Discussion
Although as a group aggregate, TEDANA showed higher performance at a group level compared to non-denoised data, at a subject level there were cases where the denoising approach seemingly discards signals of neuronal origin.We hypothesized this could be due to several factors and proposed modifications to address these:
1) Inadequate thermal noise suppression (the PCA step). Recent studies suggest that applying different methods of thermal noise reduction prior to typical pre-processing steps can lead to improved results7,8,9.
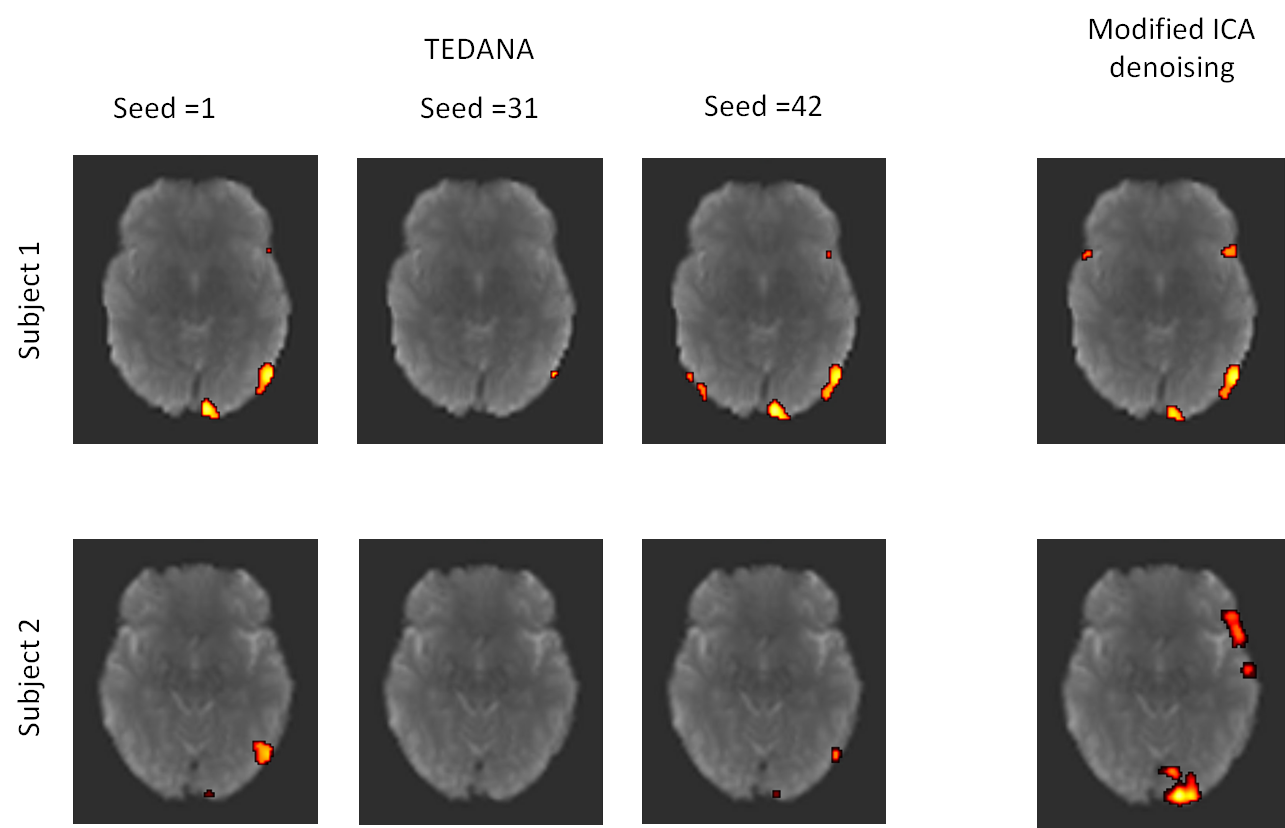
2) ICA decomposition is typically a statistically noisy process with results varying somewhat depending upon the arbitrary initial values given to the decomposition matrix. In TEDANA, a default scalar seed value is set to 42. For many subjects, we observed substantially different activation results when this seed was changed. Examples are given in Fig. 4 for three different seed values. A robust ICA approach can be adopted to minimize the seed dependency10.
3) Misclassification of neural activity components as noise in some subjects. This has been reported in previous studies11,12 and we observed similar cases in our results. These components can be re-classified manually but not in an automated pipeline.
To address these issues, we applied MP-PCA denoising, replaced FastICA algorithm with RobustICA13 and updated the classification step in the proposed modified denoising approach. We found that the greatest improvement in pipeline performance was achieved only when all modifications were in place (data not shown).
Acknowledgements
We acknowledge the facilities and scientific and technical assistance of the National Imaging Facility, a National Collaborative Research Infrastructure Strategy (NCRIS) capability, at The Florey Institute of Neuroscience and Mental Health. We also acknowledge the strong support from the Victorian Government and in particular the funding from the Operational Infrastructure Support Grant, and support from the Victorian Biomedical Imaging Capability (VBIC). The Australian Epilepsy Project received funding from the Australian Government under the Medical Research Future Fund.
We acknowledge receipt of the Software for the multi-echo multiband fMRI sequence from the University of Minnesota Center for Magnetic Resonance Research.
This work was supported by the MASSIVE HPC facility (www.massive.org.au).
This research was supported by The University of Melbourne’s Research Computing Services and the Petascale Campus Initiative.
References
[1] P. Kundu, et al, “Differentiating BOLD and non-BOLD signals in fMRI time series using multi-echo EPI,” NeuroImage, vol. 60, pp. 1759-1770, 2012.
[2] P. Kundu, et al, “Multi-echo fMRI: A review of applications in fMRI denoising and analysis of BOLD signals,” NeuroImage, vol. 154, pp. 59-80, 2017.
[3] E.M. DuPre, et al, “TE-dependent analysis of multi-echo fMRI with tedana,” Journal of Open Source Software, vol. 6, 3669, 2021.
[4] O. Esteban, et al, “fMRIPrep: a robust preprocessing pipeline for functional MRI,” Nature Methods, vol. 16, pp. 111–116, 2019.
[5] J. Xu, et al, “Evaluation of slice accelerations using multiband echo planar imaging at 3 T,” NeuroImage, vol. 83, pp. 991-1001, 2013.
[6] D. Abbott, et al. “The iBrain Analysis Toolbox for SPM,” www.florey.edu.au/imaging-software.
[7] B. Ades-Aron, et al, “Improved task-based functional MRI language mapping in patients with brain tumors through Marchenko-Pastur principal component analysis Denoising,” Radiology, vol. 298, pp. 365-373.
[8] L. Vizioli, et al, “Lowering the thermal noise barrier in functional brain mapping with magnetic resonance imaging,” Nature Communications, vol. 12, 5181, 2021.
[9] A. Cohen, et al, “Detecting task functional MRI activation using the Multiband Multiecho (MBME) Echo-Planar Imaging (EPI) Sequence,” Journal of Magnetic Resonance Imaging, vol. 53, pp. 1366-1374, 2021.
[10] J. Himberg and A. Hyvarinen, "Icasso: software for investigating the reliability of ICA estimates by clustering and visualization," 2003 IEEE XIII Workshop on Neural Networks for Signal Processing (IEEE Cat. No.03TH8718), pp. 259-268, 2003.
[11] J. Gonzalez-Castillo, et al, “Evaluation of multi-echo ICA denoising for task based fMRI studies: Block designs, rapid event-related designs, and cardiac-gated fMRI,” NeuroImage, vol. 141, pp. 452-468, 2016.
[12] W. Zhu, et al, “Denoise functional magnetic resonance imaging with random matrix theory based principal component analysis,” IEEE Transactions on Biomedical Engineering, vol 69, pp. 3377-3388, 2022.
[13] https://github.com/CRG-CNAG/robustica/.
Figures