3469
Machine learning models using T1-mapping and arterial spin labeling images to identify Alzheimer’s disease and mild cognitive impairment1Shanghai Key Laboratory of Magnetic Resonance, East China Normal University, Shanghai, China, 2Department of Radiology, Beijing Hospital, National Center of Gerontology, Institute of Geriatric Medicine, Beijing, China, 3Graduate School of Peking Union Medical College, Chinese Academy of Medical Sciences, Beijing, China, 4MR Scientific Marketing, Siemens Healthcare, Shanghai, China
Synopsis
Keywords: Alzheimer's Disease, Arterial spin labelling
To investigate the added value of T1-mapping to arterial spin labeling (ASL) for computer-aided early diagnosis of Alzheimer’s disease (AD). A total of 97 (45 AD/24 mild cognitive impairment (MCI)/38 normal control (NC)) people were enrolled retrospectively. We extracted features from 24 automatically segmented brain regions based on T1-mapping and ASL MR images and constructed three radiomics models to differentiate AD-NC/MIC-NC/AD-MCI, for which the radiomics models achieved a favorable prediction performance with the AUCs of 0.921/0.764/0.727, respectively.Introduction
Alzheimer's disease (AD) is the most common cause of dementia with the rising incidences, putting a huge burden on the global public health care system1. The accuracy of the its diagnosis in the early stages, such as mild cognitive impairment (MCI), still needs to be improved. Arterial spin labeling (ASL) is a new technique of MRI that can quantitatively measure cerebral blood flow (CBF) in different brain regions using magnetically labeled water protons in arterial blood to replace injected exogenous contrast agent2,3. The diagnostic accuracy of ASL alone, especially in the early stage of the disease, needs to be further improved. Different biological tissues have distinctive T1 values due to differences in their cellular and interstitial components. With the magnetization-prepared two rapid acquisition gradient echo (MP2RAGE), T1-mapping can now be generated at high resolution within a clinically acceptable scan time. Radiomics has been widely used to establish diagnosis and prediction models for tumor grading and staging, treatment outcome evaluation, and prognosis prediction. Recently, T1WI texture analysis has also been used to produce imaging biomarkers for AD4. Therefore, we hypothesized that combining ASL and T1-mapping might yield better results. In this study, a radiomics model using ASL and T1-mapping features was built to diagnose AD and MCI.Methods
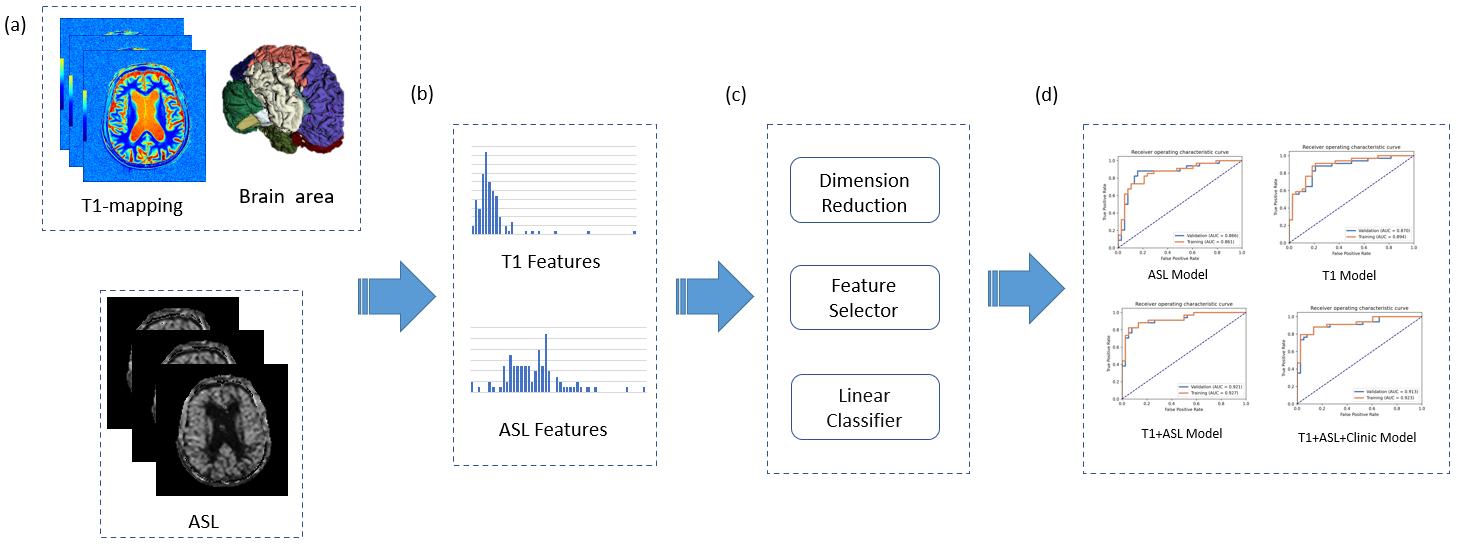
We enrolled 45 AD patients, 24 MCI patients, and 38 normal control (NC) subjects from Beijing Hospital between September 2020 to December 2021. All MR examinations were performed on a 3T MR system (MAGNETOM Prisma, Siemens Healthcare, Erlangen, Germany) with a 64-channel head coil. ASL was performed using a prototype 3D gradient and spin-echo (GRASE) sequence. Regional CBF maps were automatically generated inline after data acquisition. T1 mapping was obtained using MP2RAGE sequence.The workflow was shown in Figure 1. A brain morphometry analysis integrated with the prototype MP2RAGE sequence in the system, provided tissue classification and morphometric segmentation results6. MP2RAGE-UNI image was used to segment the brain into 48 areas, among them, 24 brain regions were used for analysis in this study. ASL images were co-registered to the corresponding MP2RAGE-UNI images.
We constructed a radiomics model to distinguish AD from NC firstly. Then, the features selected by AD-NC model were used to classify MCI-NC and AD-MCI. Mann-Whitney U-test was performed to compare the distribution of each feature in positive and negative samples, and features whose p-value < 0.017 (Bonferroni corrected5) were selected for further model building. All features were normalized to the range of [0,1]. For each pair of features, Pearson correlation coefficient (PCC) was calculated and if the PCC>0.99, one random feature in the pair was deleted to reduce feature redundancy. To get the best model, we tried different combinations of two feature selectors (Recursive Feature Elimination (RFE) and Relief) and two classifiers (SVM and LR) with good interpretability. To determine the optimal number of features to retain in the model, we used a leave-one-out cross-validation (CV) and the change of average CV AUC was plotted against number of features retained, and the model with the highest average CV AUC was selected. Finally, features in the radiomics model were combined with age to build radiomic-clinical model.
All the model building was implemented with an open-source software, FeAtureExplorer7 (ver. 0.5.2), which uses scikit-learn (ver. 0.23.2) for machine learning.
Results
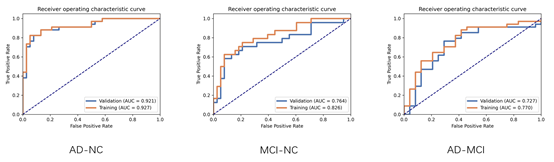
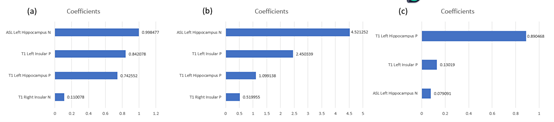
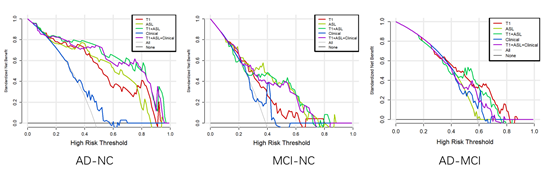
The result was listed in Table 1. For the AD-NC/MCI-NC/AD-MCI classification, the radiomics models using four features extracted from T1-mapping and ASL MR images achieved optimal performance with the AUC of 0.921 (95% CI: 0.858-0.984)/0.764(95% CI: 0.633-0.896)/0.727(95% CI: 0.586-0.868) (Figure 2), which is higher than the model using ASL features. Figure 3 listed the selected features and the coefficients of features in the T1+ASL model. DCA plots for each model are shown in Figure 4. When the threshold probability is between 0.55 and 0.60, the net benefit is the highest of all models.Discussion
This study automatically extracts features from brain region masks automatically generated by the prototype MP2RAGE protocol, without the labor required for manual outline. ASL+T1 signature showed diagnostic performance better than those of ASL or T1 model. Compared with a previous work8 that discriminated stable cognitive function (sCON) and MCI based on ASL images, and our study not only had a higher AUC (0.764 vs. 0.710) in MCI-NC classification, but also covered AD-MCI and AD-NC classification. In addition, our results were better than Feng Feng’s work4 which used only T1WI images (AUC: 0.764 vs. 0.690). It was demonstrated that combining T1-mapping and ASL can help improve AD related diagnosis. The proposed model used the T1-mapping values in insular and left hippocampus, the CBF value in left hippocampus. These brain regions are related to cognitive function, which may help us understand the mechanisms of AD.The major limitation of this study comes from its retrospective nature and its small number of patients enrolled.
Conclusion
Combining features from T1-mapping and ASL images can achieve good diagnostic performance in the differentiation of AD, MCI and, NC. T1 value of insular and hippocampus and CBF value of hippocampus were retained in the model, consistent with the knowledge of the functions of involved brain regions.Acknowledgements
This project is supported by National Natural Science Foundation of China (61731009, 81771816) and the Open Project of Shanghai Key Laboratory of Magnetic Resonance.References
1. World Alzheimer Report 2021: Journey through the diagnosis of dementia.
2. Verfaillie SC, Adriaanse SM, Binnewijzend MA, et al. Cerebral perfusion and glucose metabolism in Alzheimer’s disease and frontotemporal dementia: two sides of the same coin? Eur Radiol 2015.
3. Chen, Y., Wolk, D.A., Reddin, J.S., Korczykowski, M., Martinez, P.M., Musiek, E.S.,Newberg, A.B., Julin, P. Arnold, S.E., Greenberg, J.H., Detre, J.A.. 2011. Voxel-level comparison of arterial spin-labeled perfusion MRI and FDG-PET in Alzheimer disease. Neurology, 77, 1977–1985.
4. Feng F, Wang P, Zhao K, et al. Radiomic features of hippocampal subregions in Alzheimer’s disease and amnestic mild cognitive impairment[J]. Frontiers in aging neuroscience, 2018, 10: 290.
5. Bland J M, Altman D G. Multiple significance tests: the Bonferroni method[J]. Bmj, 1995, 310(6973): 170.
6. Schmitter, D., Roche, A., Maréchal, B., et al. (2014). An evaluation of volume-based morphometry for prediction of mild cognitive impairment and Alzheimer's disease. Neuroimage Clin. 7:7-17. doi:10.1016/j.nicl.2014.11.001
7. Song, Y. et al. FeAture Explorer (FAE): A tool for developing and comparing radiomics models. Plos One. 2020;15(8).
8. Xekardaki A, Rodriguez C, Montandon M L, et al. Arterial spin labeling may contribute to the prediction of cognitive deterioration in healthy elderly individuals[J]. Radiology, 2015, 274(2): 490-499.
Figures