3468
Rapid Neurological QSM measurement based on EPI sequence
XueHua Peng1, LiFei Ma2, Rui Zhang2, and XiaoMeng Wu2
1Radiology Department, WuHan Children’s Hosptial, WuHan, China, 2philips, shanghai, China
1Radiology Department, WuHan Children’s Hosptial, WuHan, China, 2philips, shanghai, China
Synopsis
Keywords: Parkinson's Disease, Quantitative Susceptibility mapping, Rapid QSM measurement, EPI acquisition, Neuro system
Quantitative susceptibility mapping(QSM) can be used for quantitatively measurement of neuro system magnetic susceptibility information caused by various diseases, such as Alzheimer's disease (AD), Parkinson's disease (PD) and neuro vascular diseases. In this study, a rapid QSM acquisition based on EPI sequence was proposed to improve clinical feasibility of QSM. The results demonstrated the rapid QSM were very close to those obtained by standard QSM.INTRODUCTION
QSM can be a sensitive method to visualize the Iron metabolism disorders which played a role in the neuronal apoptosis of neurodegenerative diseases, such as Alzheimer's disease (AD), Parkinson's disease (PD), etc. [1]. It also can monitor the patients with hemorrhagic or ischemic stroke, cerebrovascular malformation similar with SWI [2]. This study intends to propose a rapid QSM measurement based on EPI sequence to improve the clinical applicability of QSM quantitative examination.METOHDS
Study sample: Fifteen subjects (Nine males. Age range from 24 to 48 years old) took part into this study with approval by local institutional review board, a written consent form was obtained from each subject.MR imaging: MR imaging was acquired on a 3.0 T MR scanner (Ingenia, Philips Hearthcare). The standard QSM sequence adopted 10-echo fast gradient echo sequence, TR 41.0ms, TE 2.8ms, slice thickness 1.4mm with 0mm gap, FOV 240 × 240 mm2, scanning time 4:53 min; EPI-QSM sequence adopted EPI sequence, TR 3000ms, TE 35ms, slice thickness 2mm with 0mm gap, FOV 240 × 240 mm2 ,two dummy phases and 5 dynamic phases were collected, scanning time 21 seconds.
DATA analysis: The EPI-QSM data were arithmetically averaged across phases. Two groups of data did spatial registration to align space position. Then, the QSM quantities calculated by STI-SUITE (505 Cory Hall, MC # 1770, Berkeley, CA) after phase unwrapping, background field removal, magnetic susceptibility inversion.
RESULTS
EPI-QSM and standard QSM sequences obtained similar parameter images (see Figure 1).Twenty-one regions of interest (ROI) were selected within whole brain showing in Figure 2.
The whole brain QSM results listed in Table 1. Statistics showed QSM quantities measured by two sequences were different(t=-2.538, P=0.012)and yet significantly correlated(R2=0.615, P=0.00) as shown in Figure 3.
DISCUSSION
The rapid EPI-QSM significantly shortens scanning time completing acquisition within 21 seconds, with which could improve the patient's comfort and success rate of scanning. The rapid QSM value emerge good consistency with the standard QSM within whole cerebral cortex. It is worth noting that EPI-QSM was easy to produce deformation in inferior frontal and temporal gyrus, but QSM quantification are not sensitive to geometric deformation [Li J et. al MRM 2012]. Therefore, in practical application, combining with anatomical images, QSM can accurately locate the lesions during diagnosis.CONCLUSION
Rapid EPI-QSM acquisition shorten the scanning time of QSM quantitative collection. QSM quantification is significantly consistent with the value of standard QSM sequence, so it can be used for quantitative measurement of magnetic susceptibility in various diseases in the neuro system.Acknowledgements
noneReferences
1.Ke Y, Ming Qian Z. Iron misregulation in the brain: a primary cause of neurodegenerative disorders[J]. Lancet Neurol, 2003, 2(4): 246-53.
2.Schneider TM, Nagel AM, Zorn M, et al. Quantitative susceptibility mapping and (23) Na imaging-based in vitro characterization of blood clotting kinetics[J]. NMR Biomed, 2018, 31(6): e3926.
3.Li J, Chang S, Liu T, Wang Q, et al. Reducing the object orientation dependence of susceptibility effects in gradient echo MRI through quantitative susceptibility mapping. MAGNET RESON MED. 2012,11-01;68(5):1563-9.
Figures
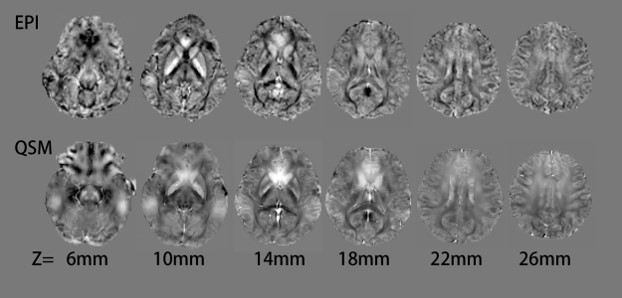
Figure 1: The comparson of
EPI-QSM and standard QSM parameter map.
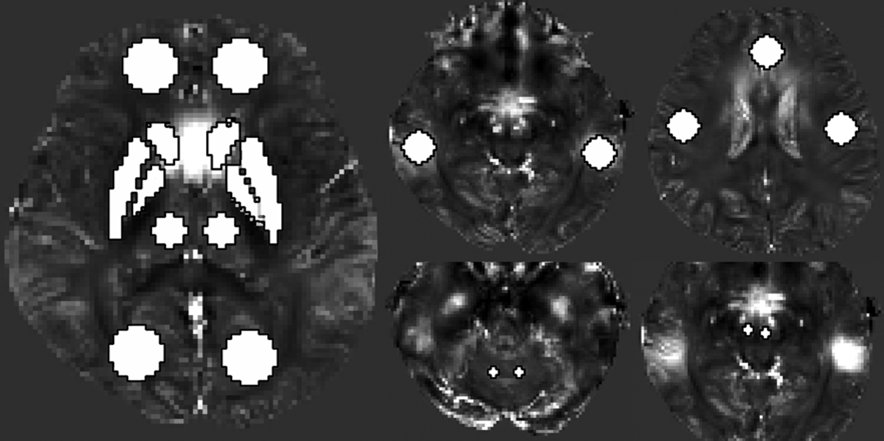
Figure 2: The ROI setup covered
bilateral basal ganglia,middle
frontal gyrus, middle occipital gyrus and middle temporal gyrus. red nuclei,
cerebellum, motor cortex, superior frontal gyrus.

Table 1: Quantities results of QSM
obtained by EPI-QSM and standard QSM sequences.
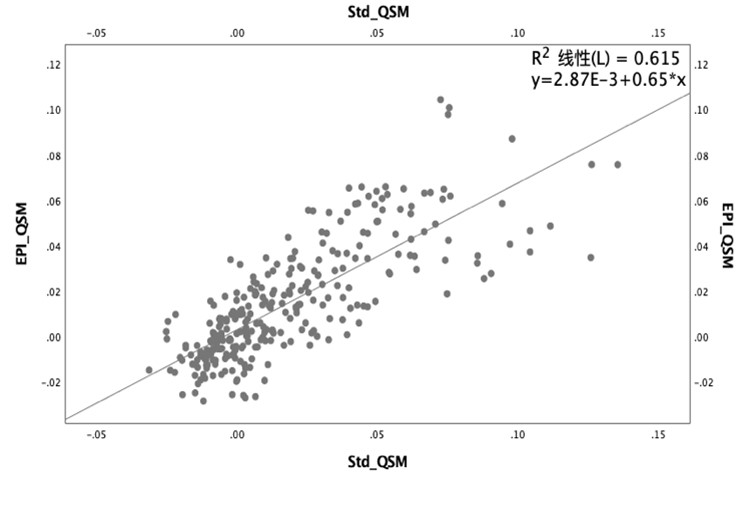
Figure 3: The correlation analysis
demonstrated the QSM acquired by EPI-QSM and standard QSM sequences were linear
correlated.
DOI: https://doi.org/10.58530/2023/3468