3467
Improved differentiation of benign and malignant breast lesions based on Kaiser score descriptors and apparent diffusion coefficient1The Third Affiliated Hospital of Zhengzhou University, Zhengzhou, China, 2General Electric (GE) Healthcare, MR Research China, Beijing, Beijing, China
Synopsis
Keywords: Breast, Breast
Breast cancer is the most frequently diagnosed malignant tumor in women and badly threatens the female's health. Kaiser score (KS) shows excellent and robust performance in evaluating breast lesions. This scoring system doesn’t include quantitative image features and clinical information, however, which may result in false-negative diagnoses, especially for cancers showing atypical morphological characteristics. In this study, we evaluated the importance of five features in KS, apparent diffusion coefficient (ADC), and patient age respectively and combined them to build new models to explore if there will be an improvement in the differential diagnosis of breast lesions compared with KS.Background
As a classification algorithm, the Kaiser score (KS) incorporates five Breast Imaging Reporting and Data System (BI-RADS) criteria (including root sign, time-intensity curve (TIC), margins, internal enhancement patterns, and peritumoral edema), which can provide an intuitive flowchart to assign the lesion malignancy risk associated score to guide clinical decision-making1. Several studies have assessed its clinical value and demonstrated that KS can improve the diagnostic accuracy of inexperienced radiologists and reduce unnecessary biopsies2-5. This scoring system doesn’t include quantitative image features and clinical information, however, which may result in false-negative diagnoses, especially for cancers showing atypical morphological characteristics. Combining ADC and the KS failed to improve the performance of differential diagnosis of breast lesions.Methods
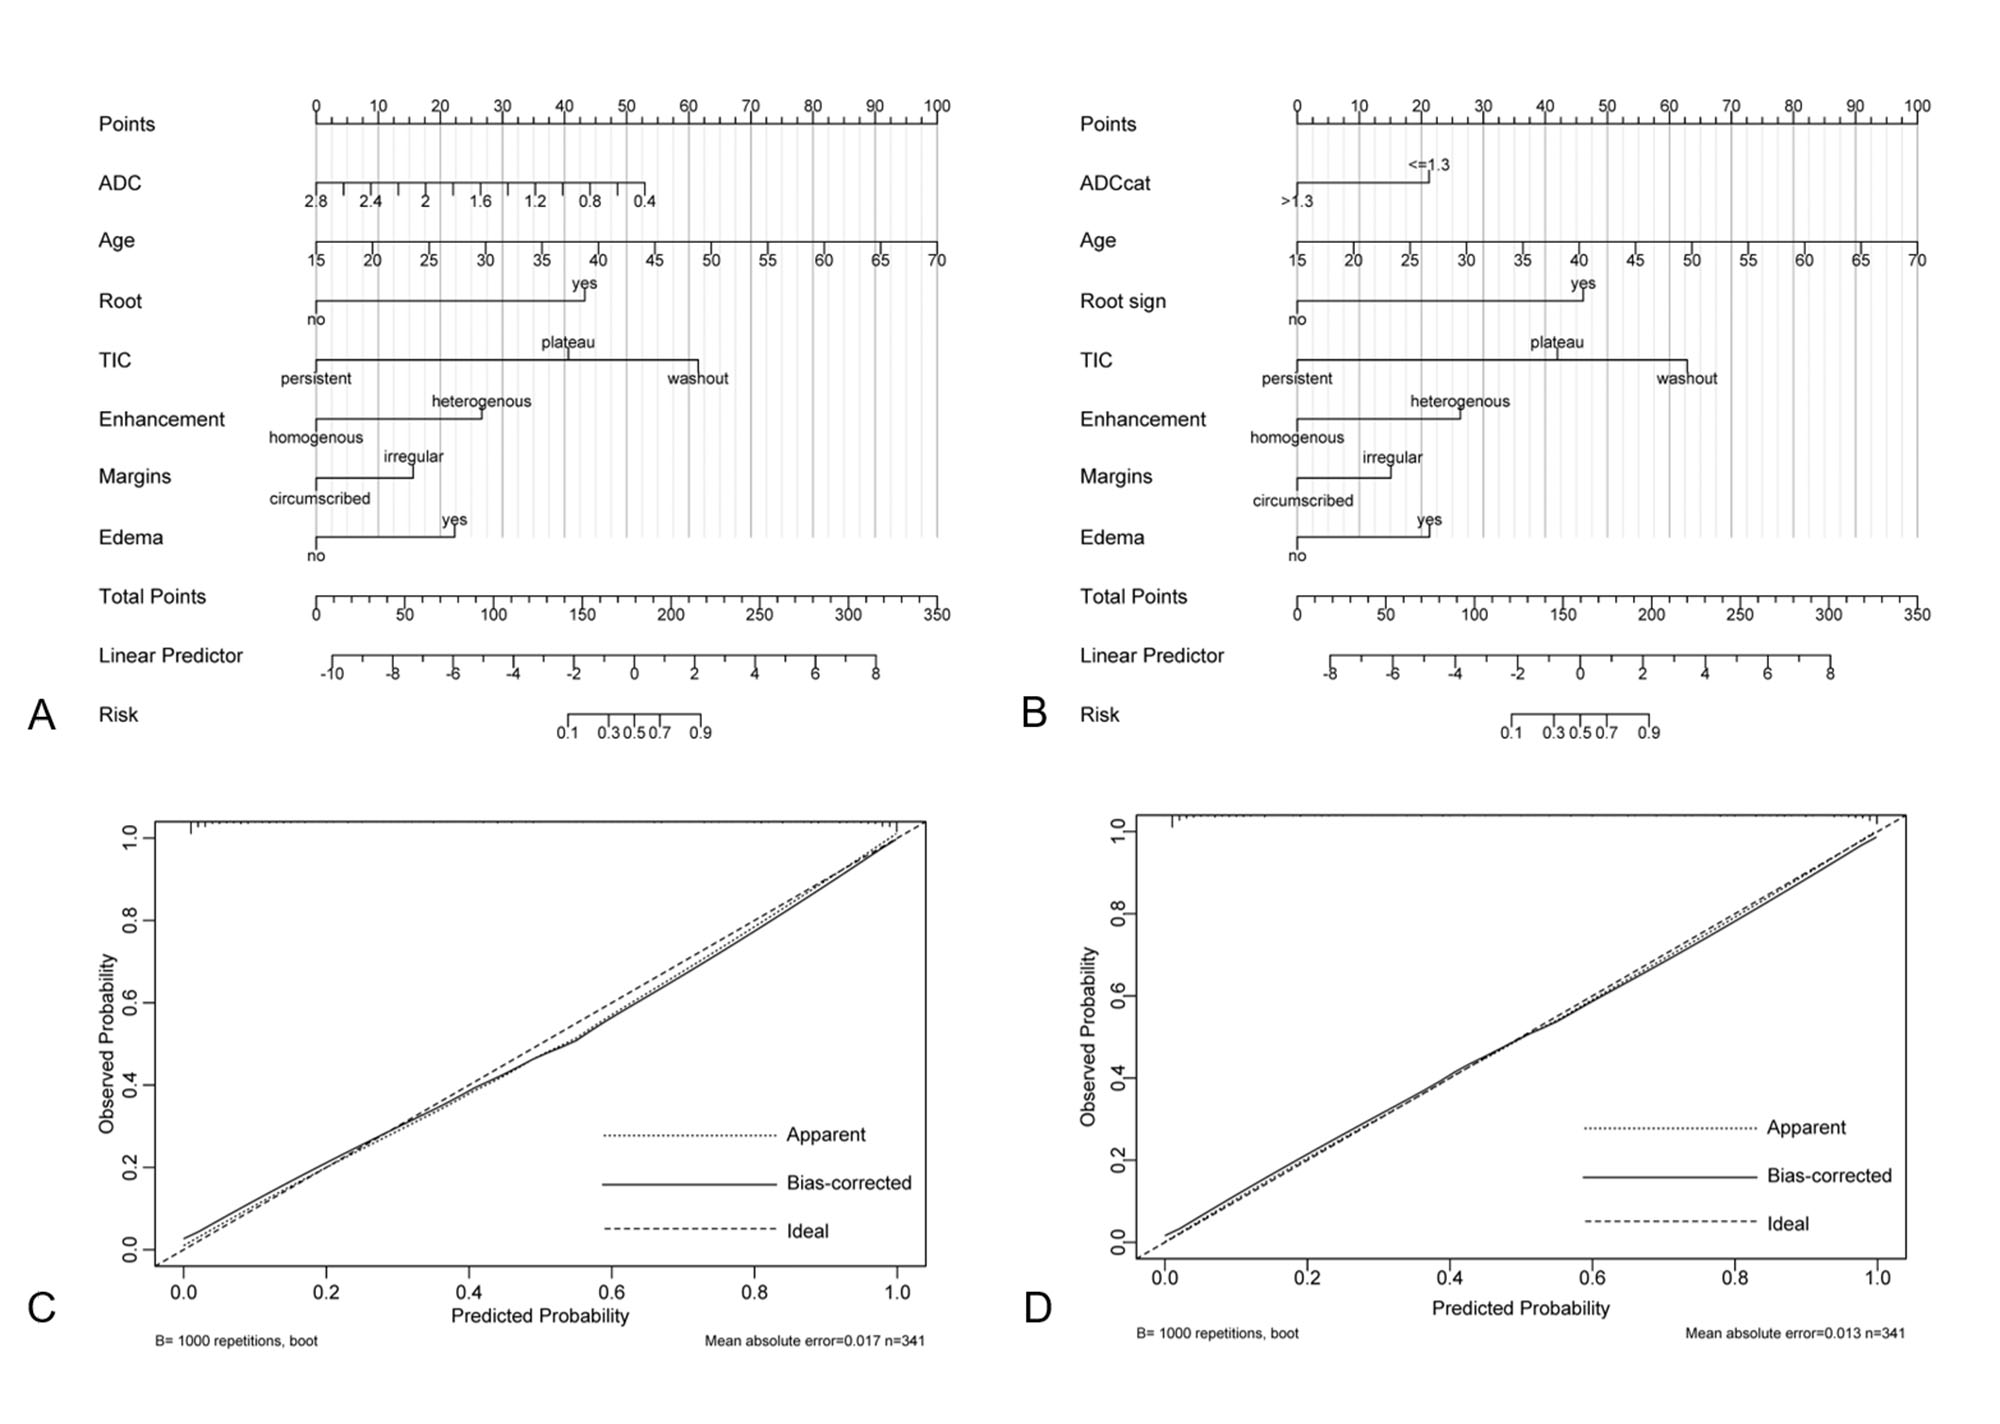
341 lesions (161 malignant and 180 benign) were included. Clinical data and imaging features were reviewed. Univariable and multivariable logistic regression analyses were performed to determine the independent variables. ADC as a continuous or classified into binary form with a cutoff value of 1.3×10⁻³mm2/s was combined with other independent predictors to construct two nomograms, respectively. Receiver operating curve analysis and calibration plot was employed to test the models’ discriminative ability. The diagnostic performance between the developed model and the KS was also compared. All statistical analyses were performed using the statistical software SPSS version 26.0 (IBM) and MedCalc version 19.8 (MedCalc Software). The nomograms corresponding to the models were formulated by using the R software (version 4.1.2, package: rms, http://www.r-project.org)6. P < 0.05 was considered statistically significant.Results
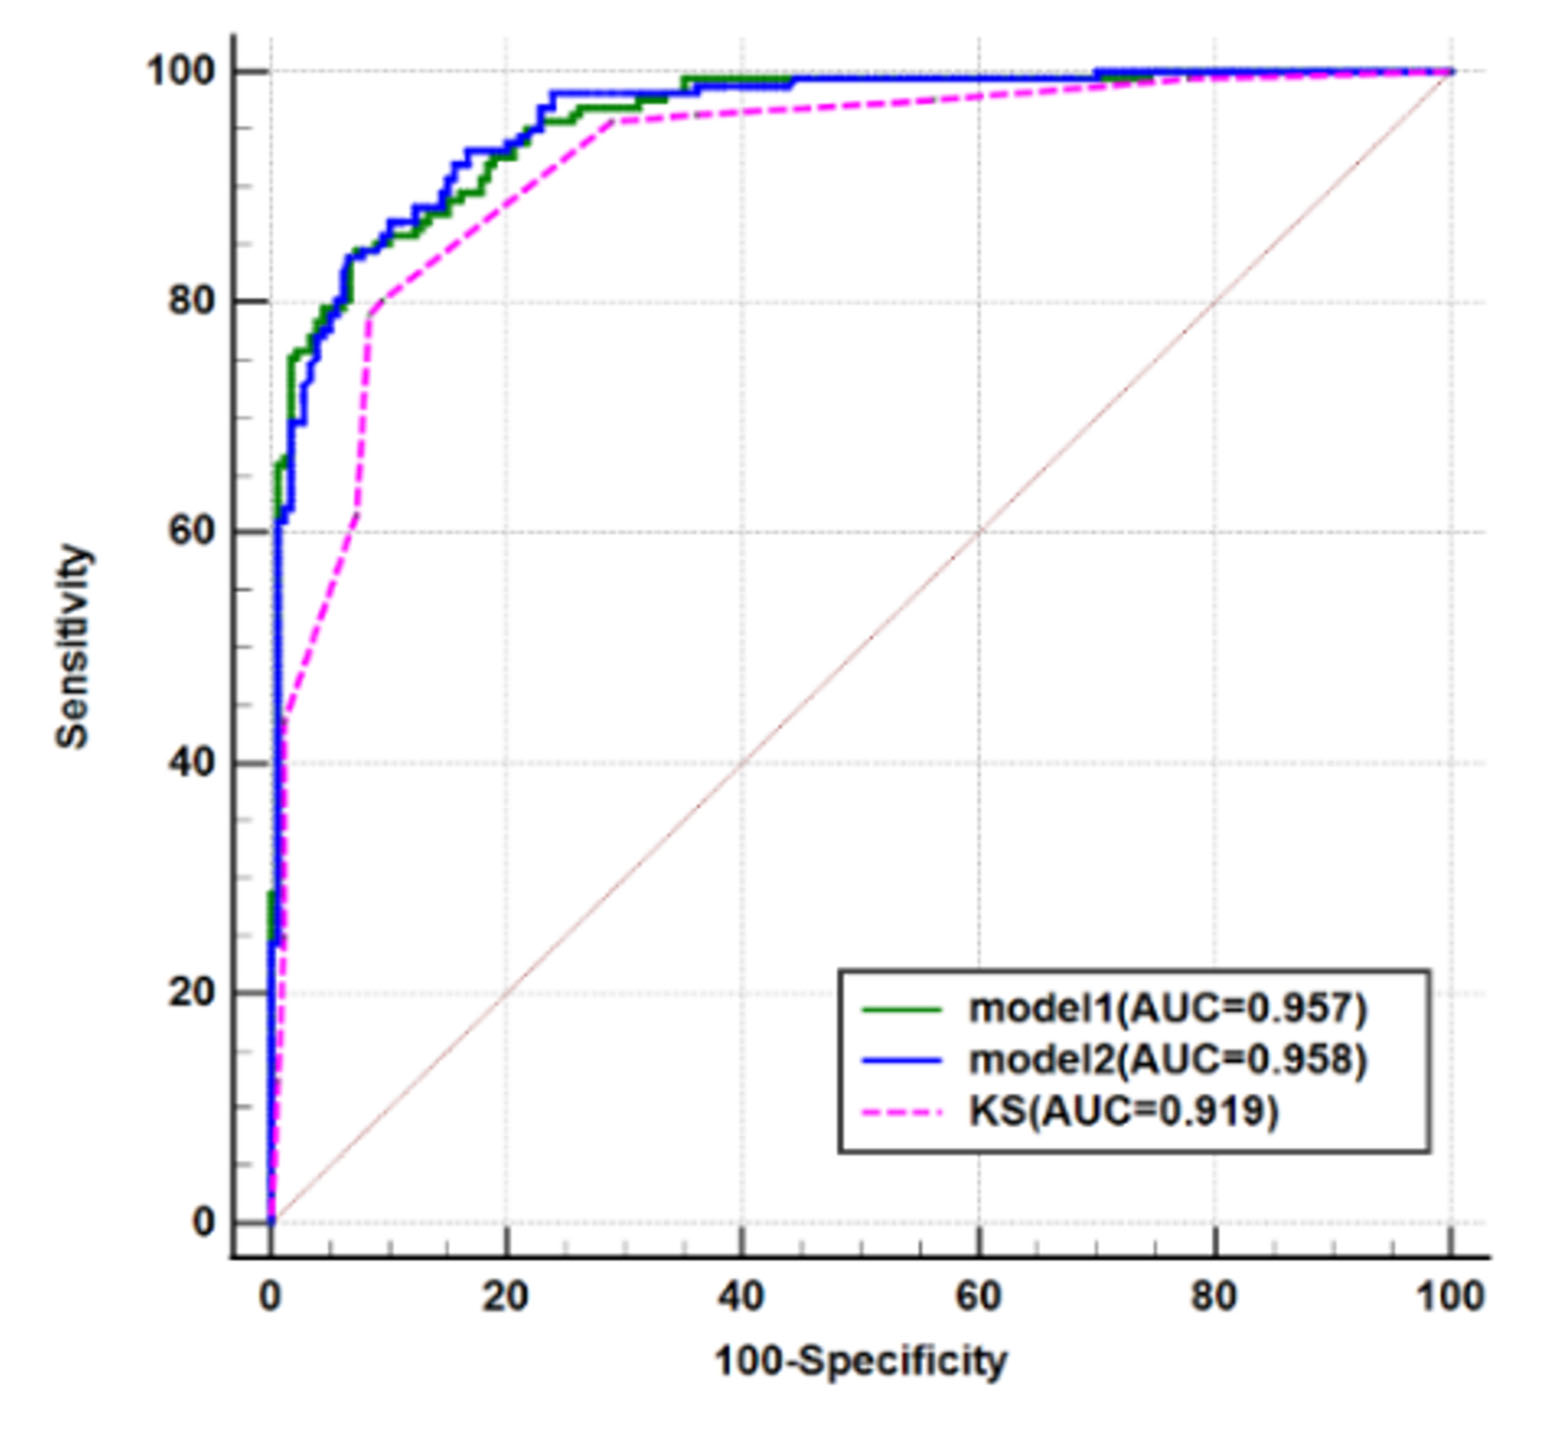
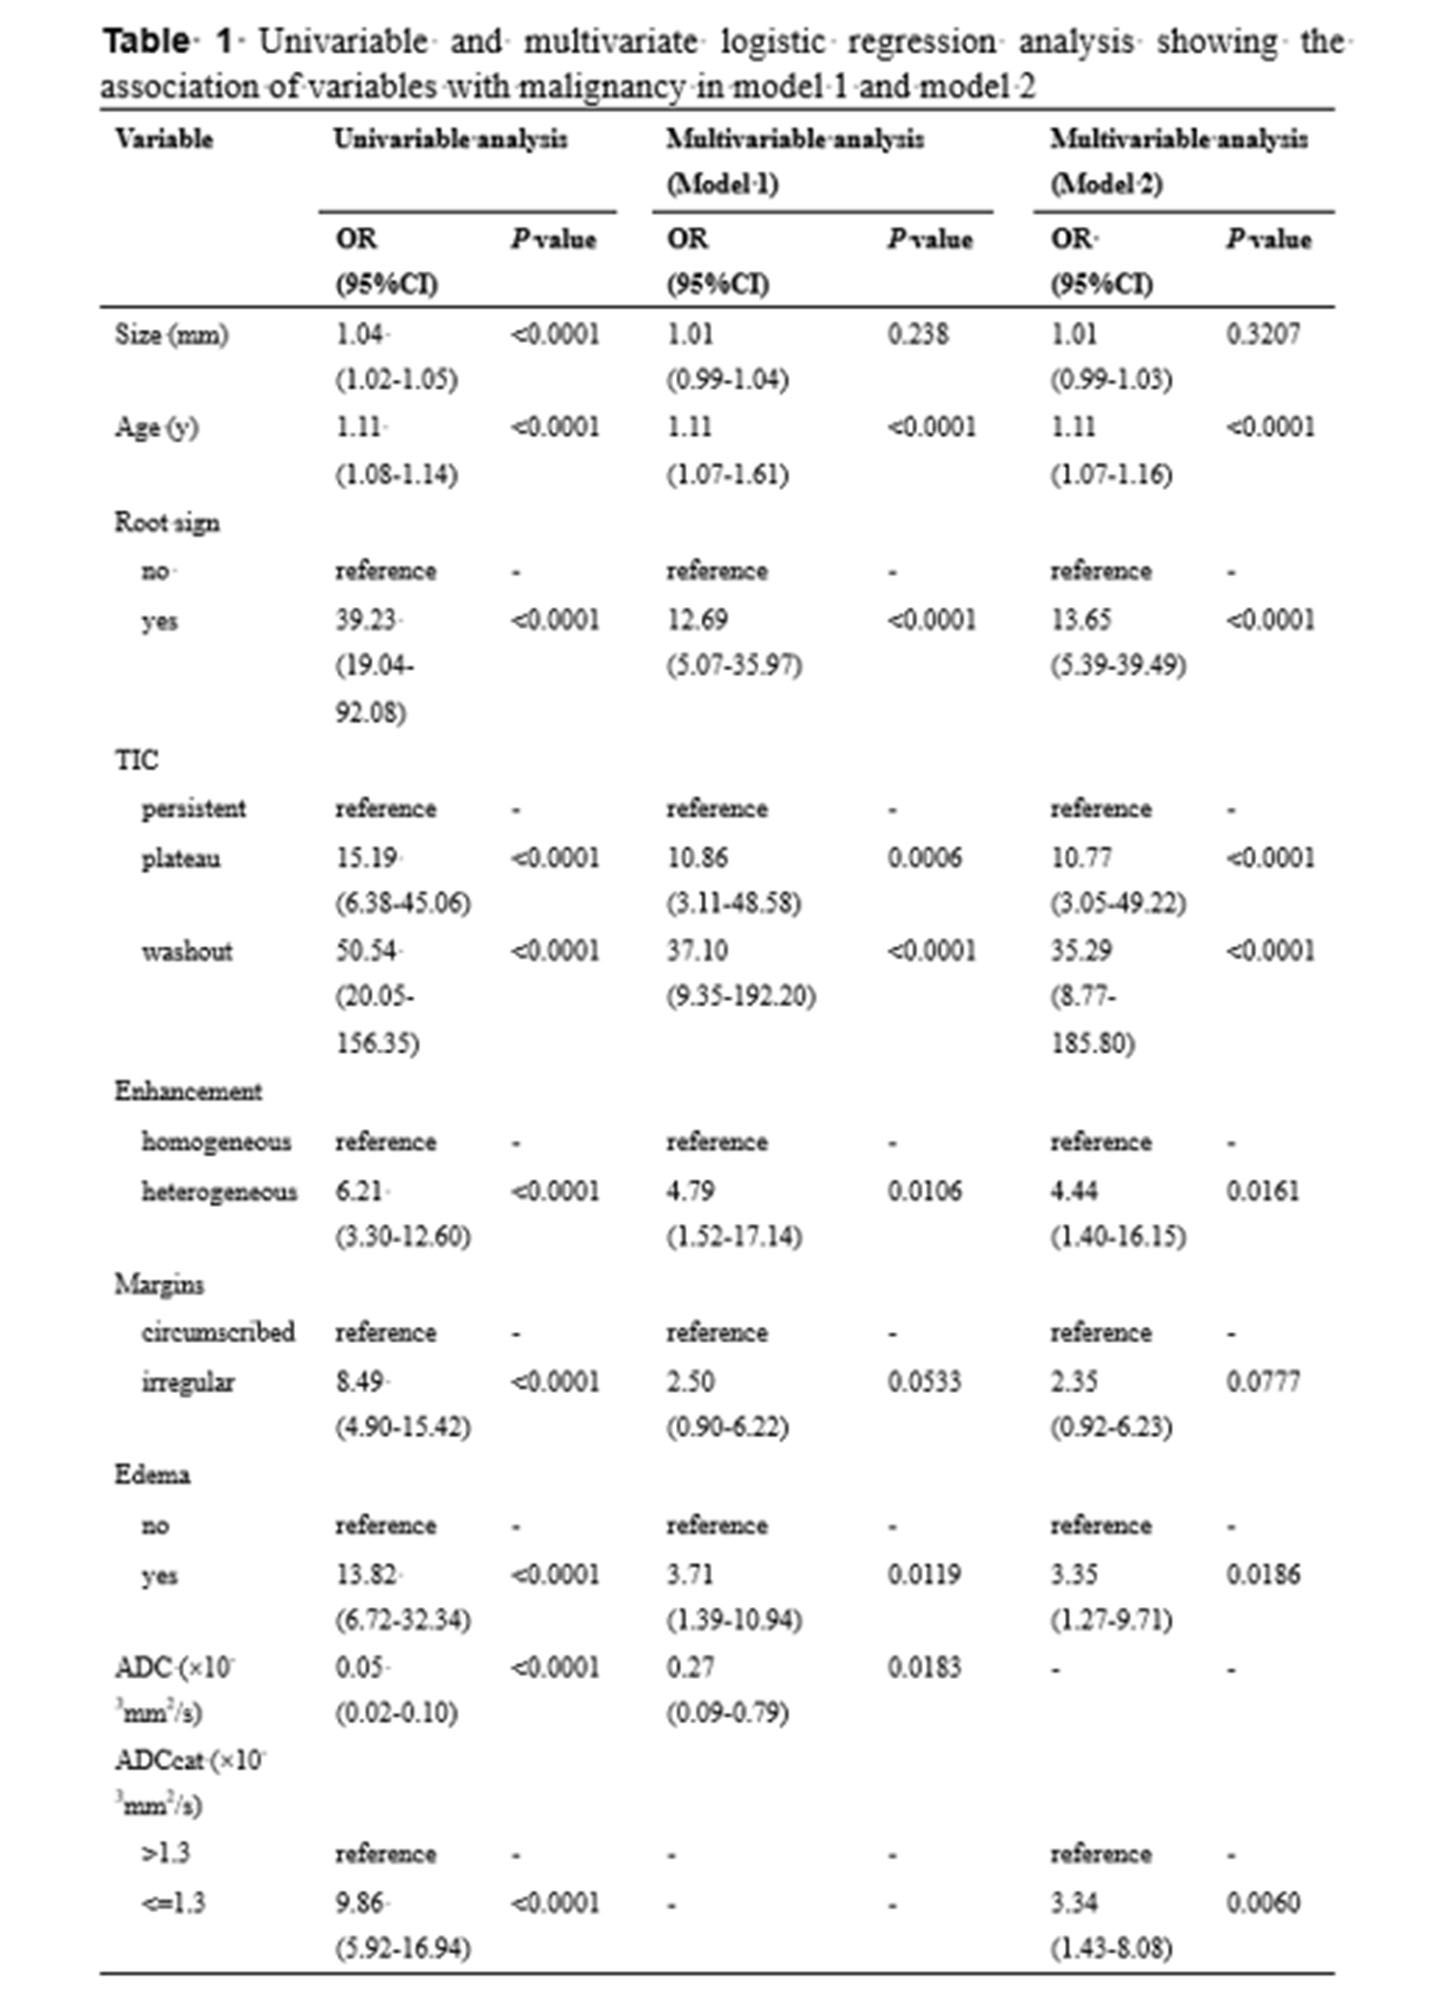
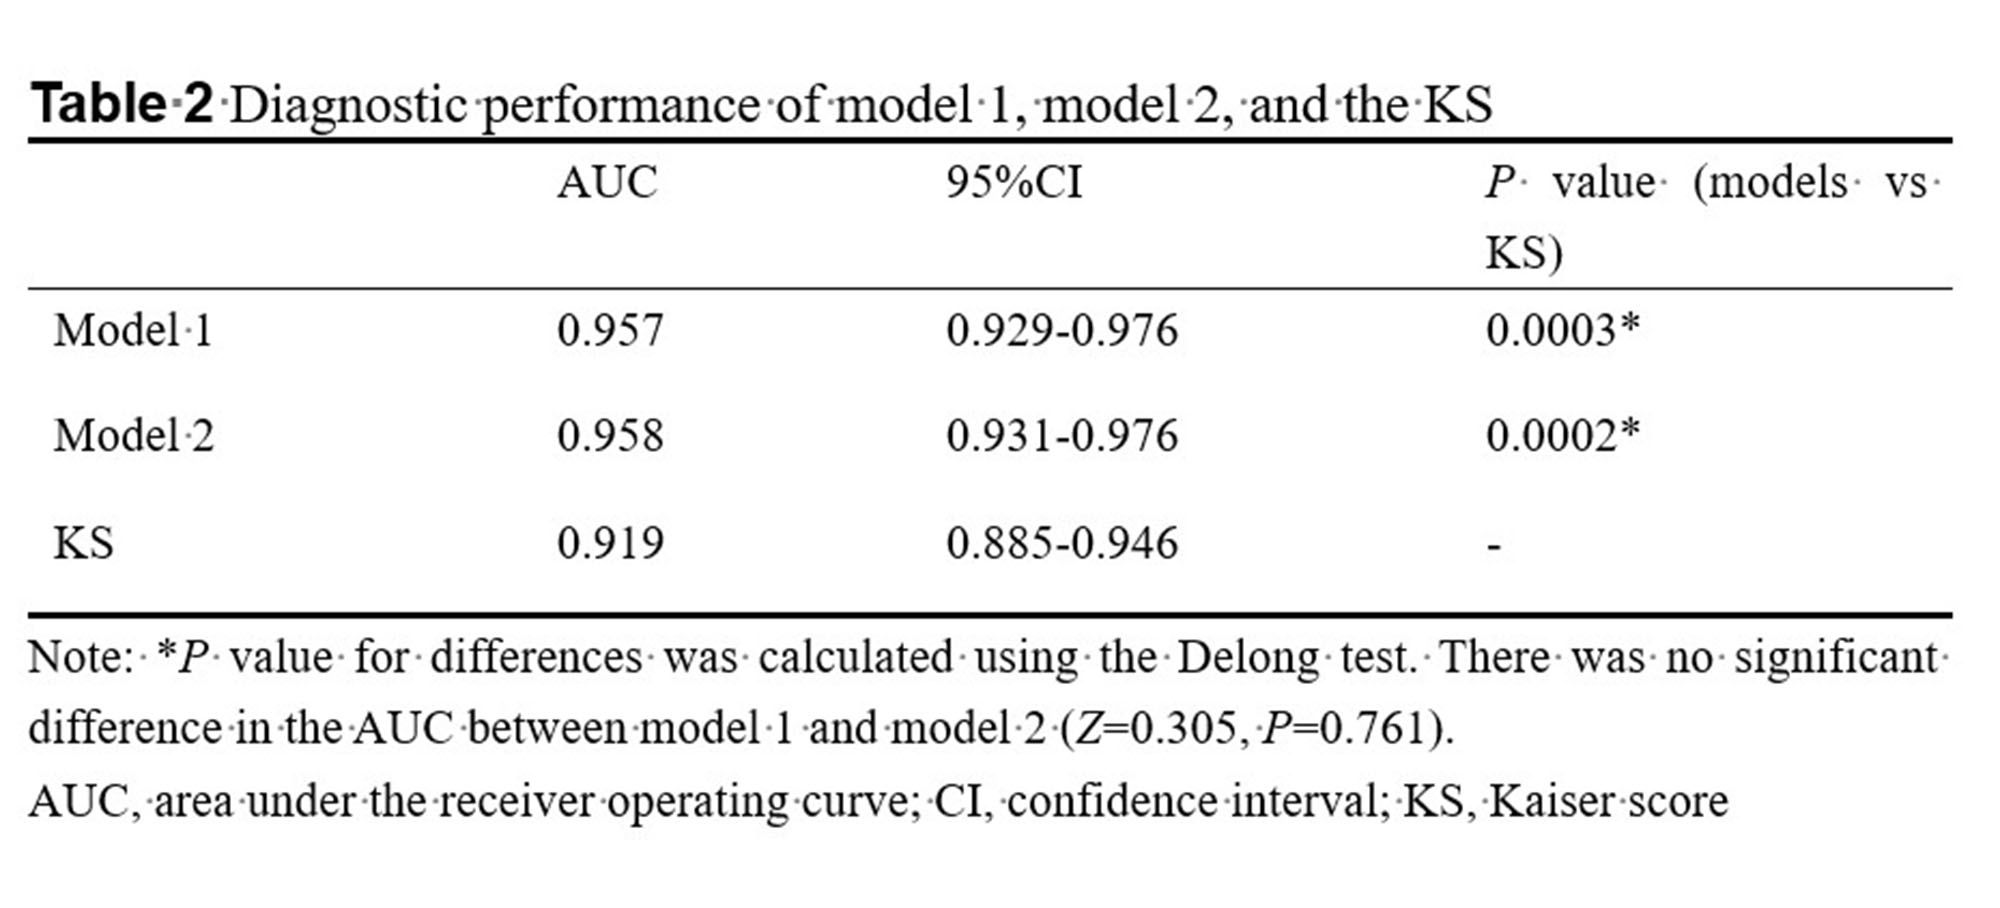
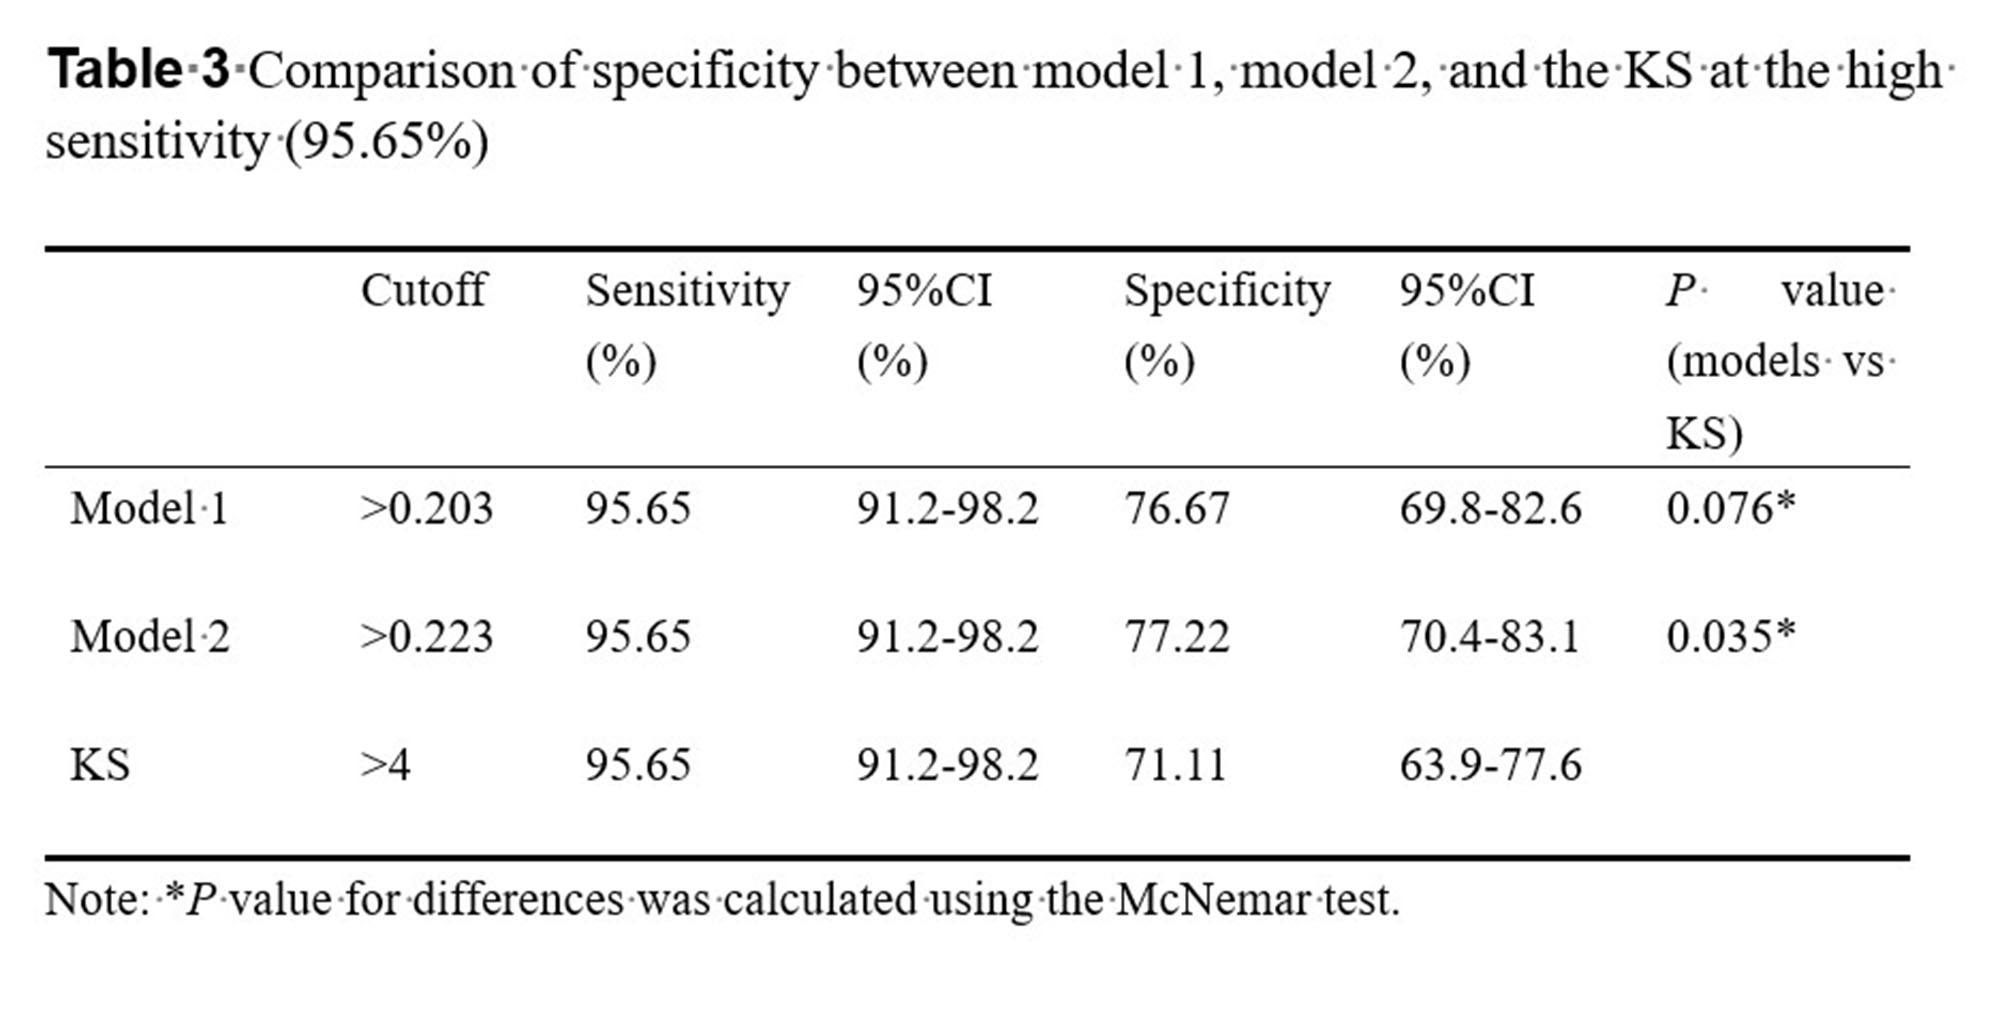
The univariable analysis identified all included variables as associated risk factors for breast cancer: high patient age, small lesion size, the presence of root sign, time-intensity curve (TIC) type (plateau and washout), heterogeneous internal enhancement, irregular margins, the presence of peritumoral edema, and low ADC value. All P < 0.0001. Model 1 utilized the ADC value as a continuous variable while model 2 used the ADC value as a binary variable after truncation with a cut-off. Multivariable analysis showed that all the variables except lesion size and irregular margin were independent risk factors to predict breast cancer. The odds ratio (OR) and its 95% CI, as well as the P value for each variable, are shown in Table 1 for both models. Two nomograms were established based on model 1 and model 2 and showed good agreement between predictive and actual observation in both models (Figure 1). The AUCs of our two models were significantly higher than that of the KS (0.957 vs. 0.919, all P = 0.0003) (Figure 2, Table 2). At the same level of sensitivity (95.65%) as the KS, our models could improve the specificity by the number of 5.56% (P = 0.076) and 6.11% (P = 0.035), respectively (Table 3).Discussion
The results showed that the TIC types (plateau and washout) were the most important image features for malignancy (OR, 10-37). Malignant tumors demonstrate the phenomenon of neovascularization, resulting in increased vasculature with abnormal vascular architecture. Therefore, after intravenous injection of contrast medium, tumors show different TIC curves, reflecting pharmacokinetic properties of the tissue of interest. Root sign was the descriptor second only to TIC types (OR, 12.69 or 13.65) for breast cancer prediction. Peritumoral edema was also a significant predictor of breast cancer. Many reports have demonstrated that the presence of peritumoral edema is indicative of breast malignancy7-8 and is related to breast cancer with a poor prognosis9-10. The patient age was an independent indicator and the probability of malignancy increased with increasing patient age, which was consistent with prior studies11-13. We identified that the lesion size and irregular margins were not independent predictors of breast cancer. ADC value is a promising biomarker in evaluating breast lesions14. A recent survey from the EUSOBI showed that 60% of radiologists applied DWI in every breast lesion diagnosis15. In this study, there were no significant differences in AUCs between the two models, which indicated that ADC as a binary variable might not decrease the diagnostic performance of the model. Our models showed significantly higher diagnostic performance and might have avoided another 10 and 11 unnecessary biopsies without compromising the breast cancer diagnosis compared with the KS alone. The possible reasons for this discrepancy were as follows: (1) We combined five features in KS as separate variables to build the multiparametric model and the diagnostic performance was significantly higher than that of the KS. (2) In addition to image features, we also incorporated patient age, which was an important predictor for malignancy.Conclusion
Our models combining five KS criteria (root sign, TIC, margins, internal enhancement, and presence of edema), quantitative ADC value, and patient age yielded significantly better diagnostic performance than KS. This simple method with the improved diagnostic specificity held the potential to avoid more unnecessary biopsies in comparison with KS, although further external validation is required.Acknowledgements
The authors thank the support from the staff in the Radiology Department of The Third Affiliated Hospital of Zhengzhou University.References
1 Baltzer PA, Dietzel M, Kaiser WA (2013) A simple and robust classification tree for differentiation between benign and malignant lesions in MR-mammography. Eur Radiol 23:2051-2060
2 Marino MA, Clauser P, Woitek R et al (2016) A simple scoring system for breast MRI interpretation: does it compensate for reader experience? Eur Radiol 26:2529-2537
3 Milos RI, Pipan F, Kalovidouri A et al (2020) The Kaiser score reliably excludes malignancy in benign contrast-enhancing lesions classified as BI-RADS 4 on breast MRI high-risk screening exams. Eur Radiol 30:6052-6061
4 Wengert GJ, Pipan F, Almohanna J et al (2020) Impact of the Kaiser score on clinical decision-making in BI-RADS 4 mammographic calcifications examined with breast MRI. Eur Radiol 30:1451-1459 5 Jajodia A, Sindhwani G, Pasricha S et al (2021) Application of the Kaiser score to increase diagnostic accuracy in equivocal lesions on diagnostic mammograms referred for MR mammography. Eur J Radiol 134:109413
Figures