3466
Assessment of breast lesions using amide proton transfer-weighted imaging and dynamic contrast-enhanced MR imaging: a pilot study1Department of Radiology, Peking University Shenzhen Hospital, ShenZhen, China, 2Clinical & Technical Support, Philips Healthcare Ltd, ShenZhen, China, 3Clinical Application, Philips Healthcare Ltd, ShenZhen, China
Synopsis
Keywords: Breast, Breast
MRI is a non-invasive method for breast lesions diagnosis.However, some imaging features of benign and malignant lesions in breast are still overlap. APT-weighted imaging (APTw) is a endogenous biomarker that allows non-invasive visualization of tissue composition and microscopic information for mobile proteins and peptides. The present study explores the feasibility of the combination of APT and dynamic contrast-enhanced MR imaging to assess of breast lesions. Results of this study indicate the APT value has significant difference between benign and malignant breast lesions.Introduction
Breast cancer (BC) is the most prevalent malignant neoplasm for women[1].The American College of Radiology introduced the Breast Imaging Reporting Data System (Bi-RADS) in 1992 to standardize the imaging approach for breast lesions evaluation[2]. However, some imaging features of benign and malignant lesions in breast are still overlap.Therefore, it remains a challenge for evaluating breast lesions. Amide proton transfer-weighted(APTw) imaging technique focuses on the exchange between amide protons and bulk water, it is a endogenous biomarker that allows non-invasive visualization of tissue composition and microscopic information for mobile proteins and peptides[3].There were only a few research about breast recently[4].DCE-MRI has been extensively used for diagnosis, prognosis and therapy tracking of various diseases for breast[5]. Few studies compared the efficacy of APTw with DCE in diagnosing benign and malignant breast lesions . The purpose of this study is to investigate the potential value of the combination of APT and DCE in diagnosis of breast lesions.Methods
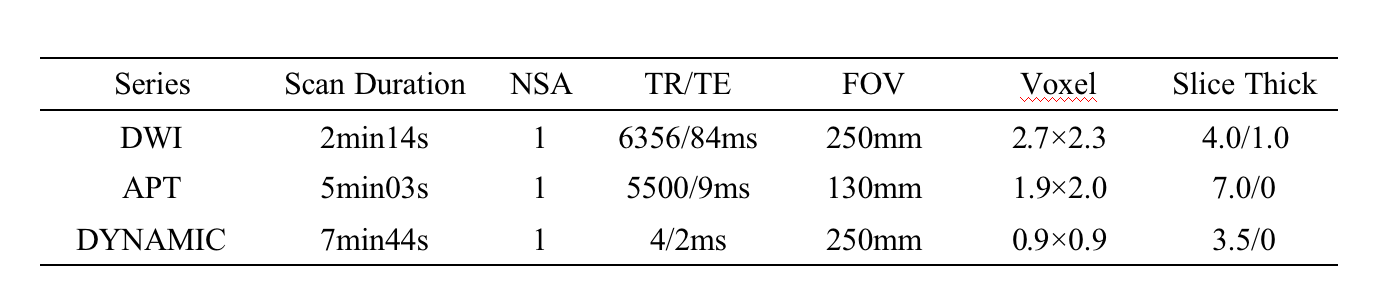
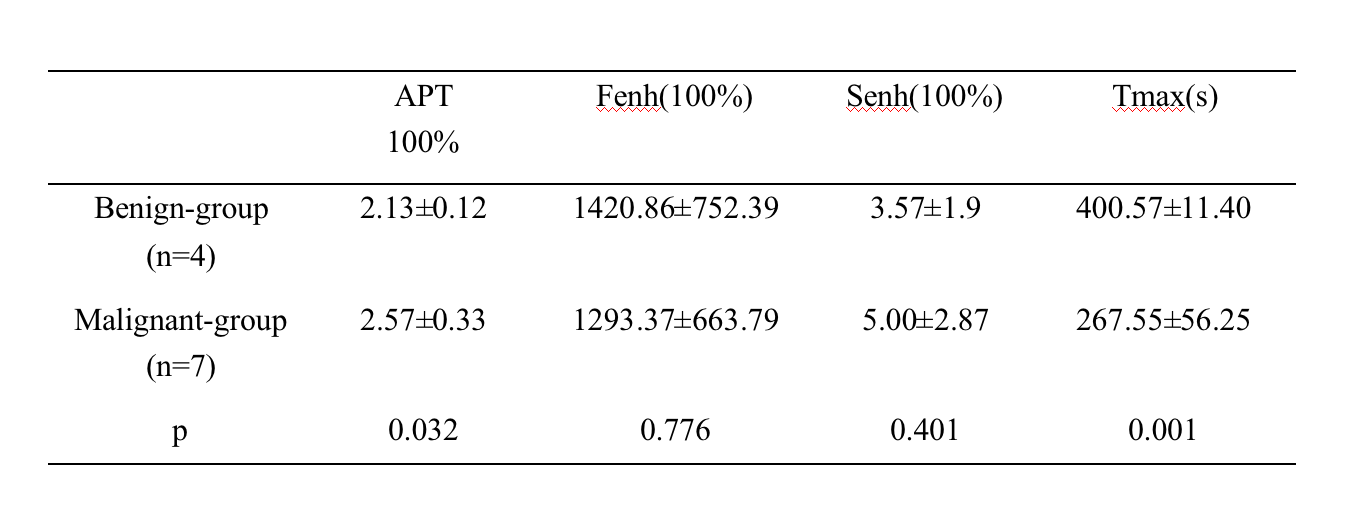
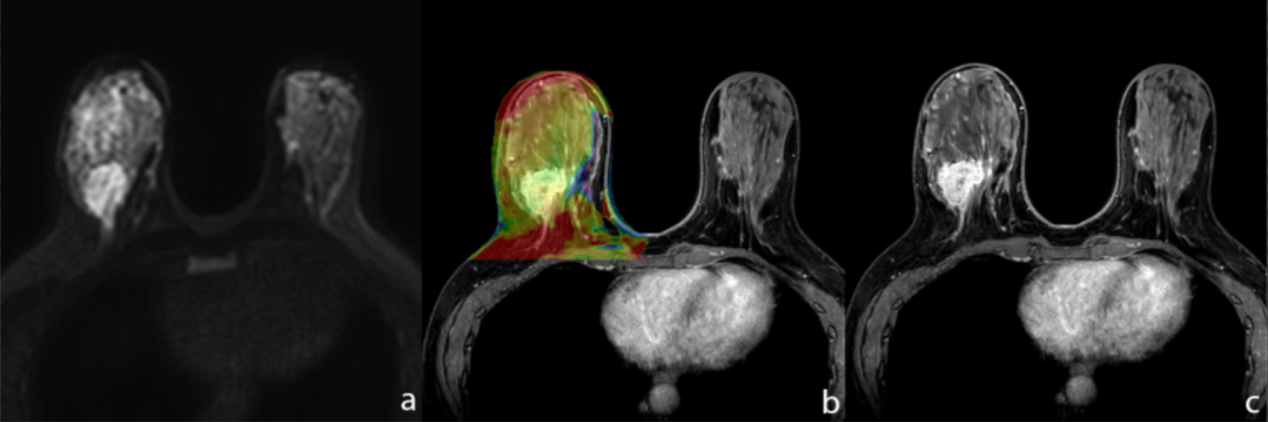
This prospective study was approved by the institutional IRB, and all patients signed informed consent forms before the scans were performed. All examination will be performed on 3.0T MR system with a 16-channel breast coil (Ingenia CX, Philips Healthcare, Best, the Netherlands). At present, a total of 19 female patients were selected for breast MR imaging for the following inclusion criteria: (1) suspicious breast lesions were found on ultrasound or mammography; (2) prior to MRI, no biopsy, radiotherapy or chemotherapy was performed. 8 patients were excluded for the following exclusion criteria:(1) the scanning sequence was incomplete or the image quality was too poor to meet the diagnostic requirement (n=7); (2) definite pathological and IHC results were not obtained after the scanning (n=1). Finally, 11 patients were included. APTw, DWI and DCE imaging protocols were listed in Table 1. The patients were categorized into benign (n=4) group and malignant (n=7) group based on the pathology. ROIs were drawn independently by two radiologists (with 5 and 25 years of radiological experience respectively) on the DCE images on the slice that shows the largest lesion area (Figure 1, Figure 2). The APTw and DCE related parameters including mean APT, Fenh(factor of enhancement), Senh(slope of enhancement) and Tmax(peak time) were extracted by the Intellispace Portal workstation (Philips Healthcare). The measurement of consistency between the two observers was evaluated using intra-class correlation coefficients (ICC). The APT, Fenh ,Senh and Tmax values of the benign and malignant groups were compared using the Mann-Whitney t test. The differential diagnosis performance of APT and DCE parameters was evaluated with ROC curves. The Delong test was used to compare the diagnostic efficacy.Results
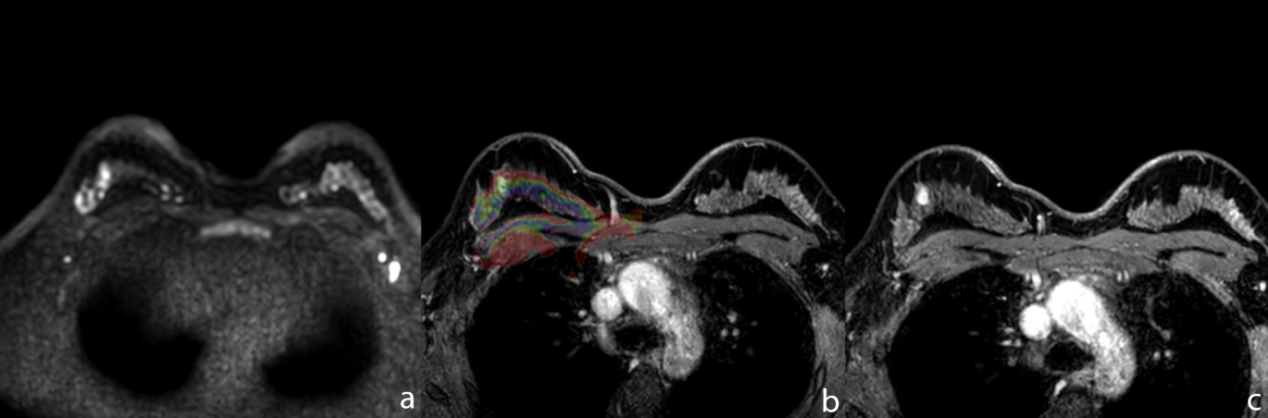
The inter-observer measurement agreement for APT, Fenh, Senh, and Tmax values was good. The APT values in the malignant group were higher than in the benign group (p < 0.05) and the Tmax values in the benign group were significantly higher than in the malignant group (p < 0.05). There were no statistical differences between Fenh and Senh values in the two groups (Table2). For the diagnosis of breast cancer, APT and Tmax yielded an AUC of 0.911, 0.964 respectively. The AUC of the combination of APT values and Tmax by DCE was 0.964. However, no statistical improvement was detected compared with independent use of APT or Tmax.Discussion
Breast cancer may lead to a high proliferation rate of tumor cells, exuberant protein synthesis. This explains why APTw values in malignant group are higher than those in benign group. Our results demonstrated the Tmax value of benign group is higher than that of malignant group, which might be caused by rich blood supply of tumor and could be enhanced quickly. Therefore, both APTw and Tmax of DCE can differentiate benign and malignant breast lesion, which might be promising in clinical applications. However,the sample of this study is limited due to small size of samples, more patients need to be included to verify the results in future.Conclusion
Both APTw and DCE-MRI are potentially promising methods in differentiating benign and malignant breast lesions.Acknowledgements
No acknowledgement found.References
[1] Marklund A, Lundberg FE, Eloranta S,et al. Reproductive Outcomes After Breast Cancer in Women With vs Without Fertility Preservation. JAMA Oncol. 2021;7(1):86-91.
[2] Zanello PA, Robim AF, Oliveira TM, et al. Breast ultrasound diagnostic performance and outcomes for mass lesions using Breast Imaging Reporting and Data System category 0 mammogram. Clinics (Sao Paulo). 2011;66(3):443-448.
[3] Zhou J, Payen JF, Wilson DA, et al. Using the amide proton signals of intracellular proteins and peptides to detect pH effects in MRI. Nat Med. 2003;9(8):1085-1090.
[4] Meng N, Wang X, Sun J, et al. A comparative study of the value of amide proton transfer-weighted imaging and diffusion kurtosis imaging in the diagnosis and evaluation of breast cancer. Eur Radiol. 2021 Mar;31(3):1707-1717.
[5] Kim HJJon. Variability in Quantitative DCE-MRI: Sources and Solutions. J Nat Sci. 2018;4(1):e484.
Figures