3463
Prediction of breast cancer response to neoadjuvant chemotherapy via early changes in quantitative DCE-MRI1Department of Radiology, Sun Yat-sen University First Affiliated Hospital, Guangzhou, China
Synopsis
Keywords: Breast, Cancer, Neoadjuvant chemotherapy
Our study suggests that the percentage change for second visits relative to baseline of enhanced tumor volume-based imaging metrics of DCE-MRI can quantify heterogeneous changes within the tumor as an indicator of therapy response and improve prediction of PCR as early as the first treatment time point in NAC.Synopsis
In this study, we analyzed DCE-MR images before and after the first course of NAC from 58 women with locally advanced breast cancer to evaluate intratumor heterogeneity changes to augment early prediction of pathologic complete response (PCR) after neoadjuvant chemotherapy (NAC). Firstly, we compared the ability of imaging metric of DCE-MRI examined after the first course of NAC, including the surface of the largest non-necrotic section of tumor (LNS) and LNS-based perfusion parameters the percentage change in these imaging metrics relative to baseline in predicting PCR after NAC. In the second half of this study, we explored whether the enhanced tumor volume (ETV) and ETV-based perfusion parameters of the second DCE-MRI examination and their percentage change relative to baseline could improve the predictive ability. We found the percentage change of LNS -based imaging metrics (AUC=0.845) was superior to LNS-based imaging metrics of the second DCE-MRI examination (AUC=0.831) in predicting PCR after NAC, and the percentage change for second visits relative to the baseline of ETV-based metrics (AUC=0.919) can further amplify this predictive ability.Introduction
NAC is often administered before surgery to reduce tumor extent and increase a patient’s surgical options[1]. The ideal outcome of NAC is PCR [2, 3]. DCE-MRI can provide quantitative perfusion parameters to reflect tumor vascular perfusion and permeability, which reflect functional tumor properties as potential earlier indicators of treatment response[4]. While much progress has been made, most approaches reported to date still have important limitations by either falling short of investigating the tumor longitudinally or by overlooking the finer details of the longitudinal imaging phenotype by primarily relying on aggregate measures of tumor structure and function[5]. For example, although Hylton et al[6] have shown that percentage change of ETV during NAC can indicate PCR, ETV does not adequately capture intra-tumour heterogeneity which has increasingly been shown to be a major indicator of tumor aggressiveness and treatment resistance8. In this study, we aim to evaluate the imaging metric of DCE-MRI examined after the first course of NAC, including the surface of LNS, the volume of ETV, LNS/ETV-based perfusion parameters, and the percentage change in these imaging metrics relative to baseline in predicting PCR after NAC.Material and Methods
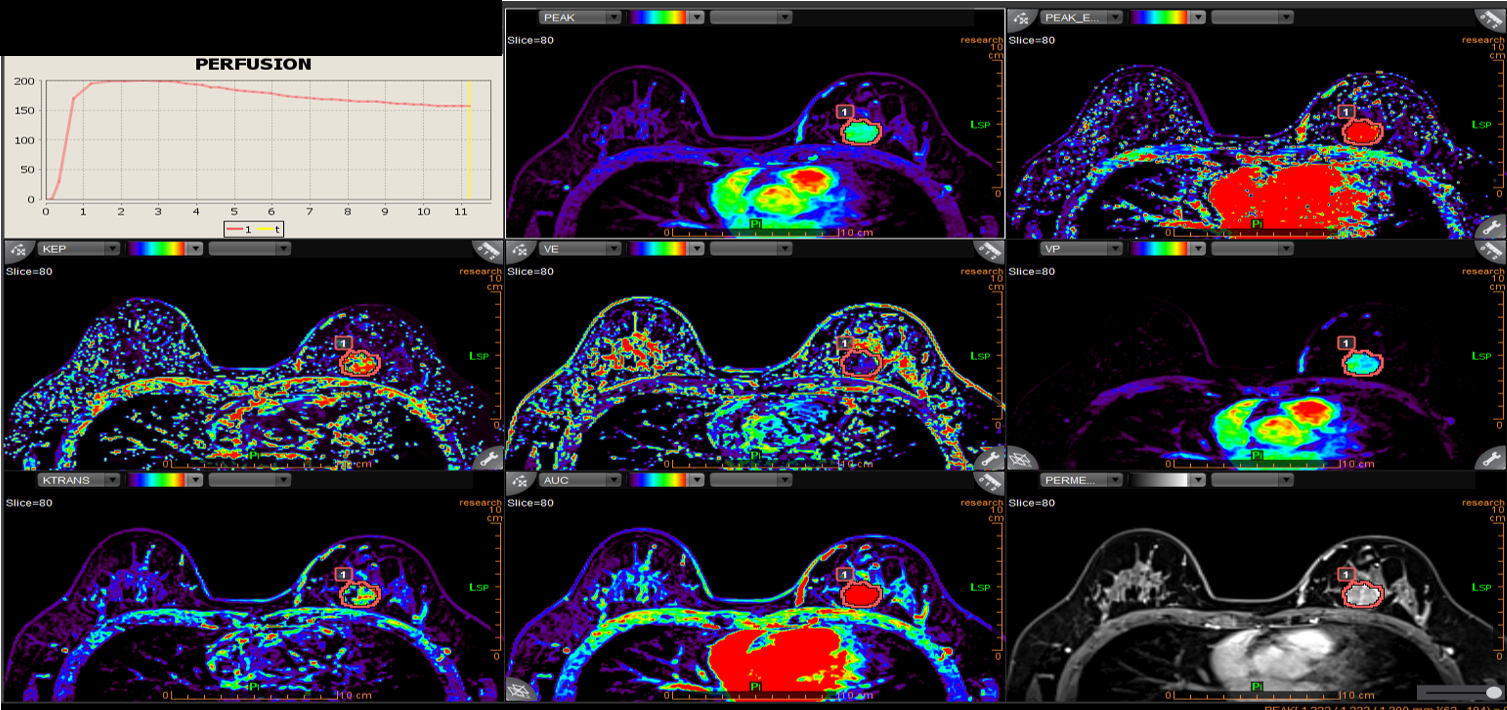
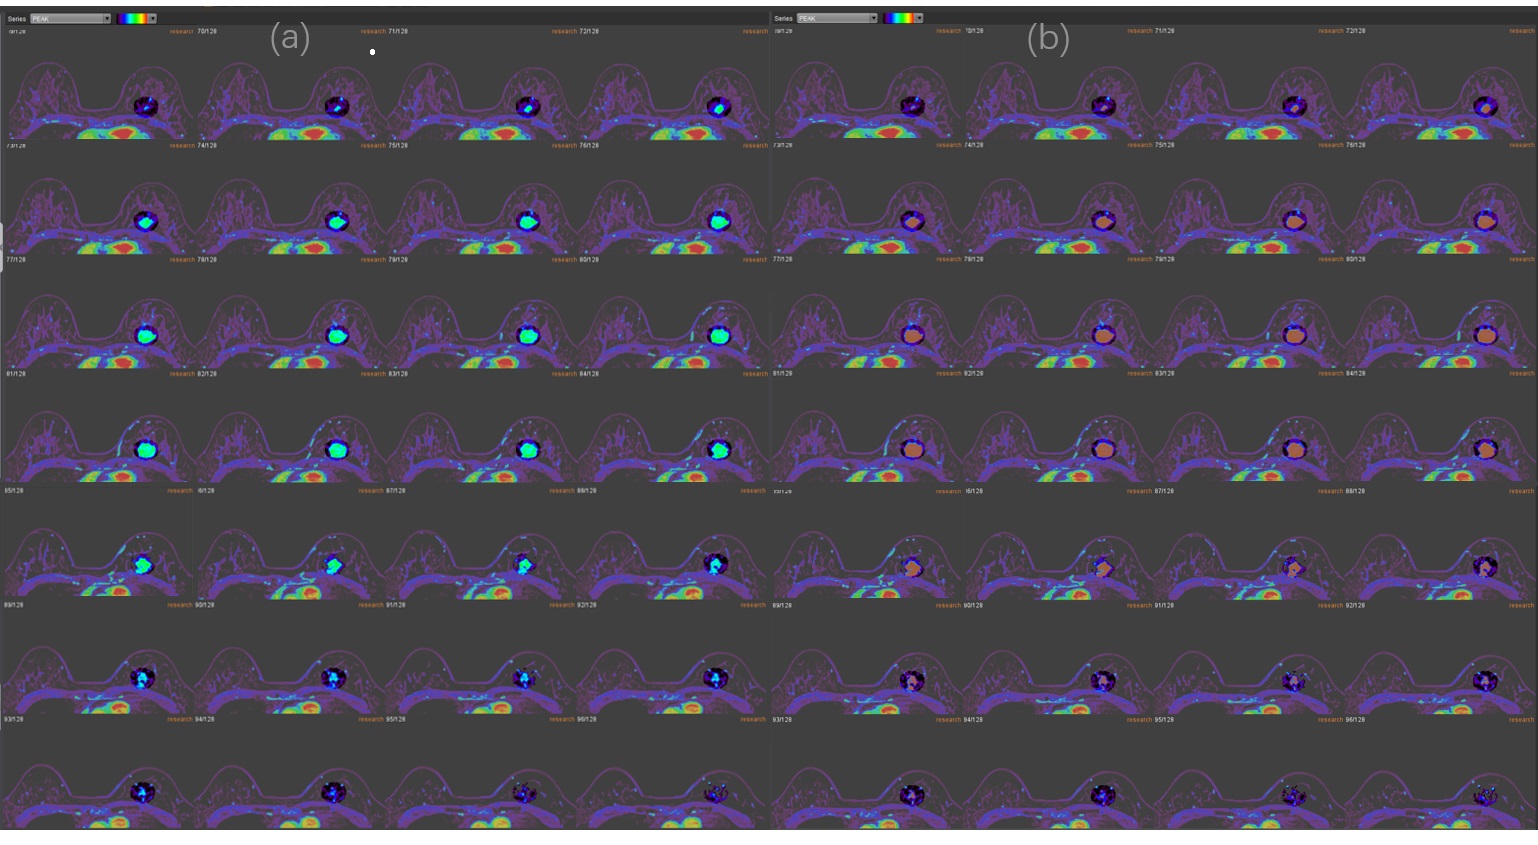
A total of 58 patients (PCR=23, non-PCR=35) with breast cancer who received NAC and post-NAC surgery were prospectively collected. DCE-MRI perfusion parameters were calculated in commercial software (Olea Sphere 2.3, Olea Medical SAS). MRI data were evaluated by two radiologists (ZXL, WMY) in consensus. The LNS and ETV were semi-automatically delineated on the perfusion parameters map to measure the permeability of tumor (Fig1 and Fig2). Then, the value of each perfusion parameter for LNS and ETV was generated respectively. For each imaging metric, including LNS/ETV-based perfusion parameters, the surface of LNS and volume of ETV, the percentage changes(Δf)for the second visits relative to baseline, ETV21% (ETV2 relative to ETV1) and LNS21% (LNS2 relative to LNS 1)were calculated: Δf = (f early treatment – f pre-treatment)/ f pre-treatment, where f is the average value of perfusion parameters, the surface of LNS and volume of ETVResults
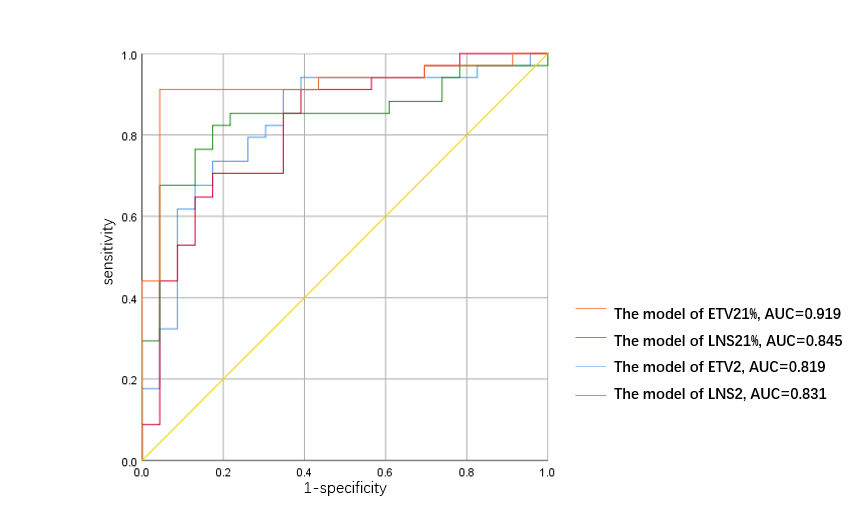
The perfusion parameters were expressed as an average value. The Mann-Whitney U test was used to compare each imaging metric of DCE-MRI examined after the first course of NAC and the percentage change in these imaging metrics relative to baseline in PCR patients and non-PCR patients. Stepwise logistic regression logistics was performed to assess the strength of associations of features based on univariate analysis with PCR. The model of LNS2 and ETV2 all included Pea and PEAK_ENHANCEMENT, the model of LNS21% included Peak21% and Surface21%, and the model of ETV21% consist of Peak21% and surface21%. Where the area under the receiver-operating-characteristic curve (AUC) was used to assess model performance. We found the percentage change of imaging metrics models (the AUC of LNS21%=0.845, the AUC of ETV21%=0.919), all performed better than the imaging metrics model (the AUC of LNS=0.831, the AUC of ETV=0.819, fig 3). - 2 log likelihood was used to evaluate the goodness of fit of each model, and this value of the model of ETV21% was smallest than the other, which also represents it was the optimal predictive model.Discussion
The importance of early-treatment response assessment in optimizing patient care and treatment adjustment has been proven[7, 8]. Peak is the peak of the time–signal intensity curve, which is considered to reflect the concentration of contrast agents in both the intravascular and extravascular interstitial space[9], which can reflect the permeability of tumor vessels. We found that the PEAK was the most significant and stable perfusion parameter in predicting PCR because it was incorporated into four models simultaneously. In our findings, we amazedly found higher peak2 and lower percentage changes of peak21% were associated with non-PCR patients, implying that non-PCR patient vasculature had higher permeability and more neovessels which constitutes a physiological barrier to the delivery of therapeutics and hinders the efficacy of NAC.Conclusion
Our study suggests that the percentage change for second visits relative to the baseline of ETV-based imaging metrics can quantify heterogeneous changes within the tumor as an indicator of therapy response and improve prediction of PCR as early as the first treatment time point in NAC.Acknowledgements
The authors would like to thank Olea (Olea Sphere 2.3, Olea Medical SAS) for calculating the DCE-MRI perfusion parameters.References
[1] A.M. Thompson, S.L. Moulder-Thompson, Neoadjuvant treatment of breast cancer. Ann Oncol. 23 Suppl 10(2012)x231-236, http://doi.org/10.1093/annonc/mds324.
[2] X. Kong, M.S. Moran, N. Zhang, B. Haffty, Q. Yang, Meta-analysis confirms achieving pathological complete response after neoadjuvant chemotherapy predicts favourable prognosis for breast cancer patients. Eur J Cancer. 47(2011)2084-2090, http://doi.org/10.1016/j.ejca.2011.06.014.
[3] S. Luangdilok, N. Samarnthai, K. Korphaisarn, Association between Pathological Complete Response and Outcome Following Neoadjuvant Chemotherapy in Locally Advanced Breast Cancer Patients. J Breast Cancer. 17(2014)376-385, http://doi.org/10.4048/jbc.2014.17.4.376.
[4] N.M. Hylton, J.D. Blume, W.K. Bernreuter, et al., Locally advanced breast cancer: MR imaging for prediction of response to neoadjuvant chemotherapy--results from ACRIN 6657/I-SPY TRIAL. Radiology. 263(2012)663-672, http://doi.org/10.1148/radiol.12110748.
[5] N.M. Braman, M. Etesami, P. Prasanna, et al., Intratumoral and peritumoral radiomics for the pretreatment prediction of pathological complete response to neoadjuvant chemotherapy based on breast DCE-MRI. Breast Cancer Res. 19(2017)57, http://doi.org/10.1186/s13058-017-0846-1.
[6] N.M. Hylton, C.A. Gatsonis, M.A. Rosen, et al., Neoadjuvant Chemotherapy for Breast Cancer: Functional Tumor Volume by MR Imaging Predicts Recurrence-free Survival-Results from the ACRIN 6657/CALGB 150007 I-SPY 1 TRIAL. Radiology. 279(2016)44-55, http://doi.org/10.1148/radiol.2015150013.
[7] C. Rousseau, A. Devillers, C. Sagan, et al., Monitoring of early response to neoadjuvant chemotherapy in stage II and III breast cancer by [18F]fluorodeoxyglucose positron emission tomography. J Clin Oncol. 24(2006)5366-5372, http://doi.org/10.1200/jco.2006.05.7406.
[8] U. Sharma, K.K. Danishad, V. Seenu, N.R. Jagannathan, Longitudinal study of the assessment by MRI and diffusion-weighted imaging of tumor response in patients with locally advanced breast cancer undergoing neoadjuvant chemotherapy. NMR Biomed. 22(2009)104-113, http://doi.org/10.1002/nbm.1245. [9] P.S. Tofts, G. Brix, D.L. Buckley, et al., Estimating kinetic parameters from dynamic contrast-enhanced T(1)-weighted MRI of a diffusable tracer: standardized quantities and symbols. J Magn Reson Imaging. 10(1999)223-232, http://doi.org/10.1002/(sici)1522-2586(199909)10:3<223::aid-jmri2>3.0.co;2-s.
Figures