3460
Early parenchymal changes on MRI and fluoroestradiol db-PET during neoadjuvant endocrine therapy in patients with ER +/HER2- breast cancer1Radiology, UCSF, San Francisco, CA, United States, 2UCSF, San Francisco, CA, United States, 3NIH, San Francisco, CA, United States
Synopsis
Keywords: Breast, Cancer, MRI, fluoroestradiol, PET, endocrine, therapy
The aim of our study was to assess early parenchymal changes during neoadjuvant endocrine therapy (NET) using both DCE-MRI and dedicated breast PET with [18F]-fluoroestradiol (FES-dbPET). We investigated background parenchymal enhancement (BPE) on MRI and background parenchymal uptake on FES-dbPET for seventeen patients with ER+/HER2- breast cancers. Statistically significant decrease in BPE was shown after 3 weeks of NET. Estimated SUVs (mean, max and peak) were lower after 3 weeks of NET, although the difference did not reach statistical significance. Our results illustrate the potential of DCE-MRI and FES-dbPET to detect early change in breast parenchyma during NET.Purpose
The breast parenchyma presents the stage for interaction between tumor cells, tumor stroma and immune cells reacting against the breast tumor1. Normal parenchymal enhancement at dynamic contrast-enhanced magnetic resonance imaging (DCE-MRI) is called background parenchymal enhancement (BPE), which is hormonally regulated2–4. Previous BPE studies showed association between BPE and treatment response to neoadjuvant chemotherapy 4–6.Dedicated breast positron emission tomography (dbPET) is a new imaging modality that offers high resolution for identifying small breast lesions7,8. Background parenchyma uptake (BPU) is an imaging parameter which describes the level of radiotracer uptake in normal breast tissue. We utilized [18F]-fluoroestradiol (FES), a radiotracer developed for imaging estrogen receptor (ER) activity, to examine ER status in the breast parenchyma.Neoadjuvant endocrine therapy (NET) is increasingly being utilized for patients with estrogen receptor-positive (ER+)/HER2-negative breast cancer because NET has less toxicity and similar effectiveness to NAC9. Considering the previous BPE research in the NAC setting, we anticipate that parenchymal imaging parameters such as BPE and BPU could be imaging biomarkers for patients undergoing NET. There is limited available information about the impact of NET on BPE and BPU. The aim of our study was to assess early parenchymal changes (after 3 weeks of NET) using both DCE-MRI and FES-db-PET and to investigate correlations between BPE and BPU in the contralateral breast.Methodology
We analyzed 17 patients with biopsy-proven ER+/HER2- breast cancers who received neoadjuvant endocrine therapy in a sub-study of the I-SPY2. DCE-MRI and FES dbPET exams were acquired before treatment (T0) and after 3 weeks of treatment (T1). Sixteen patients had analyzable DCE scans at both T0 and T1. DCE-MRI was performed with a 3T scanner (SIGNA Premier, GE Healthcare) with dedicated 16ch Sentinelle breast coil (Dunlee). DCE-MRI was acquired with a T1 fat-suppressed 3D fast gradient echo sequence with: TR = 6.7 msec and TE = 4.6 msec, flip angle 20°, phase acquisition time: 80-100 seconds; early postcontrast time for BPE of 2 to 2.5 minutes. FOV 260-360mm; in-plane resolution ≤1.4mm; slice thickness ≤2.5mm; axial orientation in prone position. Dotarem (gadoterate meglumine) was administered at the manufacturer-recommended dose. Using in-house software developed in IDL (L3Harris Geospatial, Broomfield, CO, USA), the contralateral breast parenchyma was automatically segmented for the entire breast volume. Contralateral BPE was quantitatively measured as the mean early (~150s post-contrast injection) percent enhancement of the central 50% of the axial slices. Seventeen patients had FES-dbPET at T0 and T1 in the ipsilateral breast and 16 in the contralateral breast. Using a dedicated breast PET scanner (Mammi, OncoVision), FES dbPET images were scanned in a prone position with a single breast positioned through the aperture into the detector ring. FES dbPET images of the ipsilateral breast were acquired 45 minutes after injection of 5 mCi of FES. Immediately after the ipsilateral scan, the contralateral breast was imaged. The time lag between the ipsilateral and contralateral breast scans were approximately 15 mins. Three different standardized uptake values (SUV mean, max and peak) were used to evaluate BPU. A 3D circular region of interest (ROI) of 2 cm in diameter was placed in five locations: an uninvolved quadrant of the ipsilateral breast and four quadrants of the contralateral breast. Wilcoxon signed rank test was used to compare each parameter between T0 and T1. Spearman’s correlation coefficient was computed to examine the correlation between BPE and BPU. P values less than 0.05 were considered to indicate statistical significance.Results
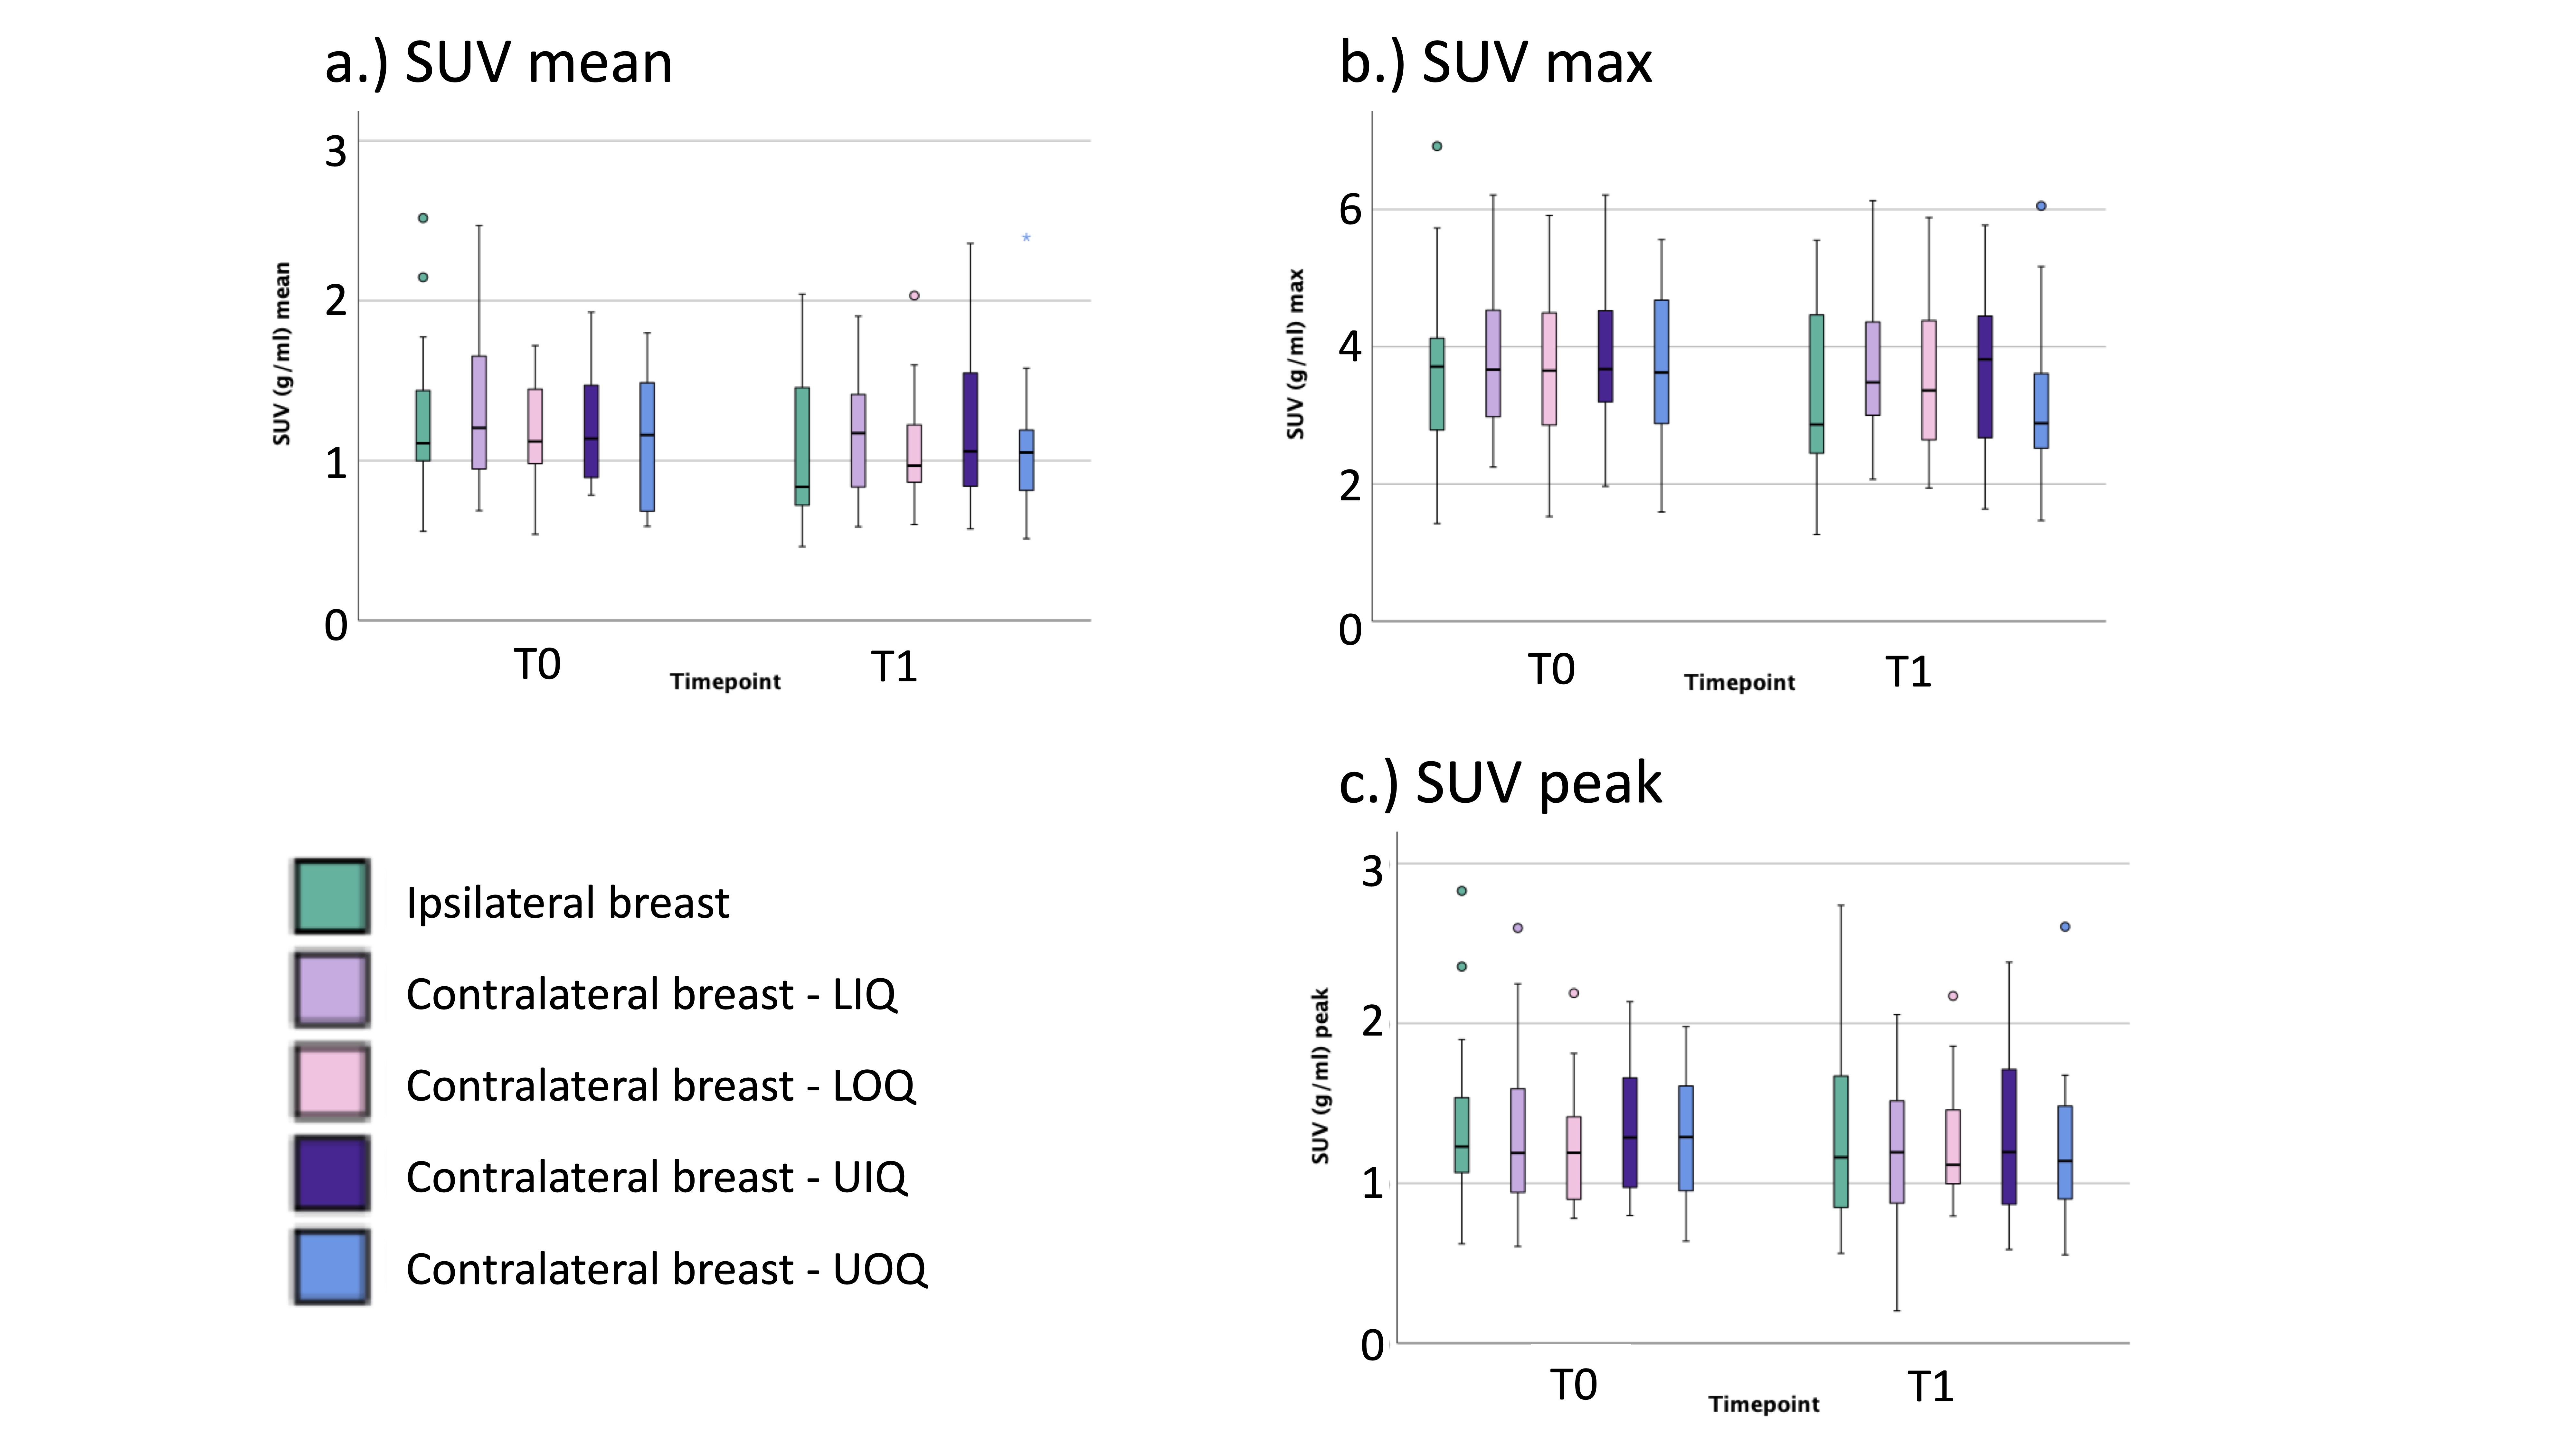
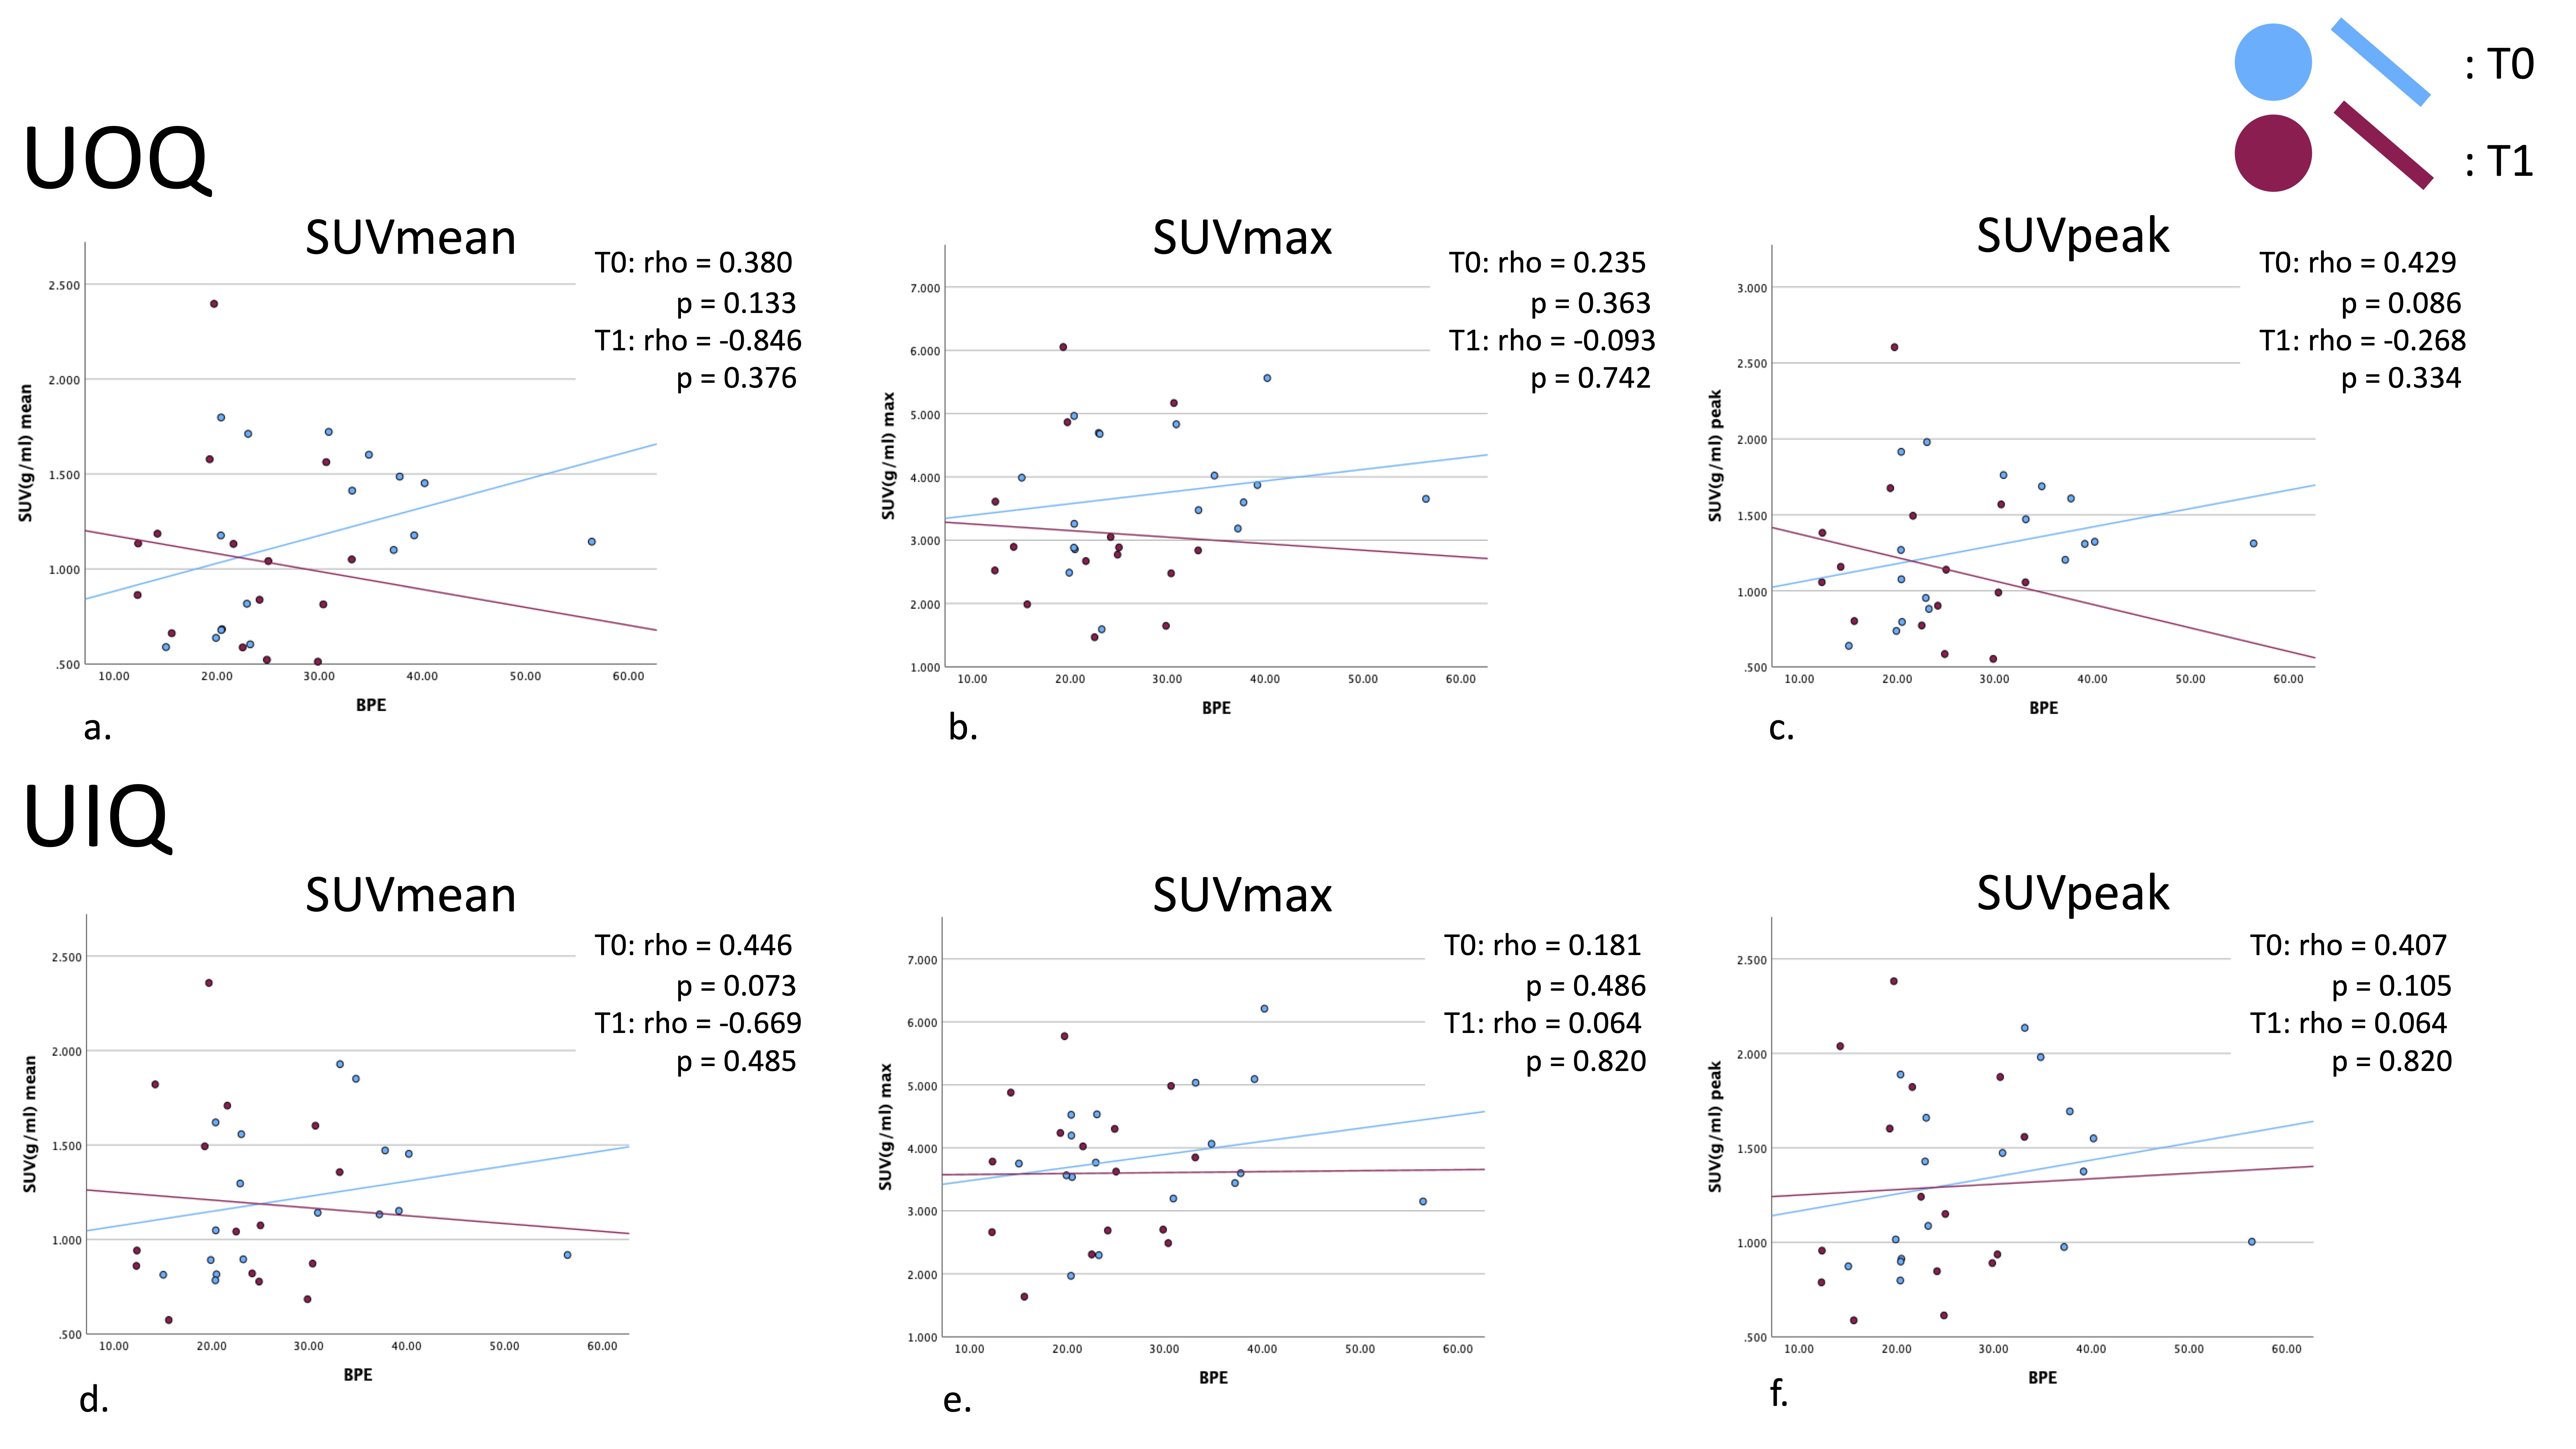
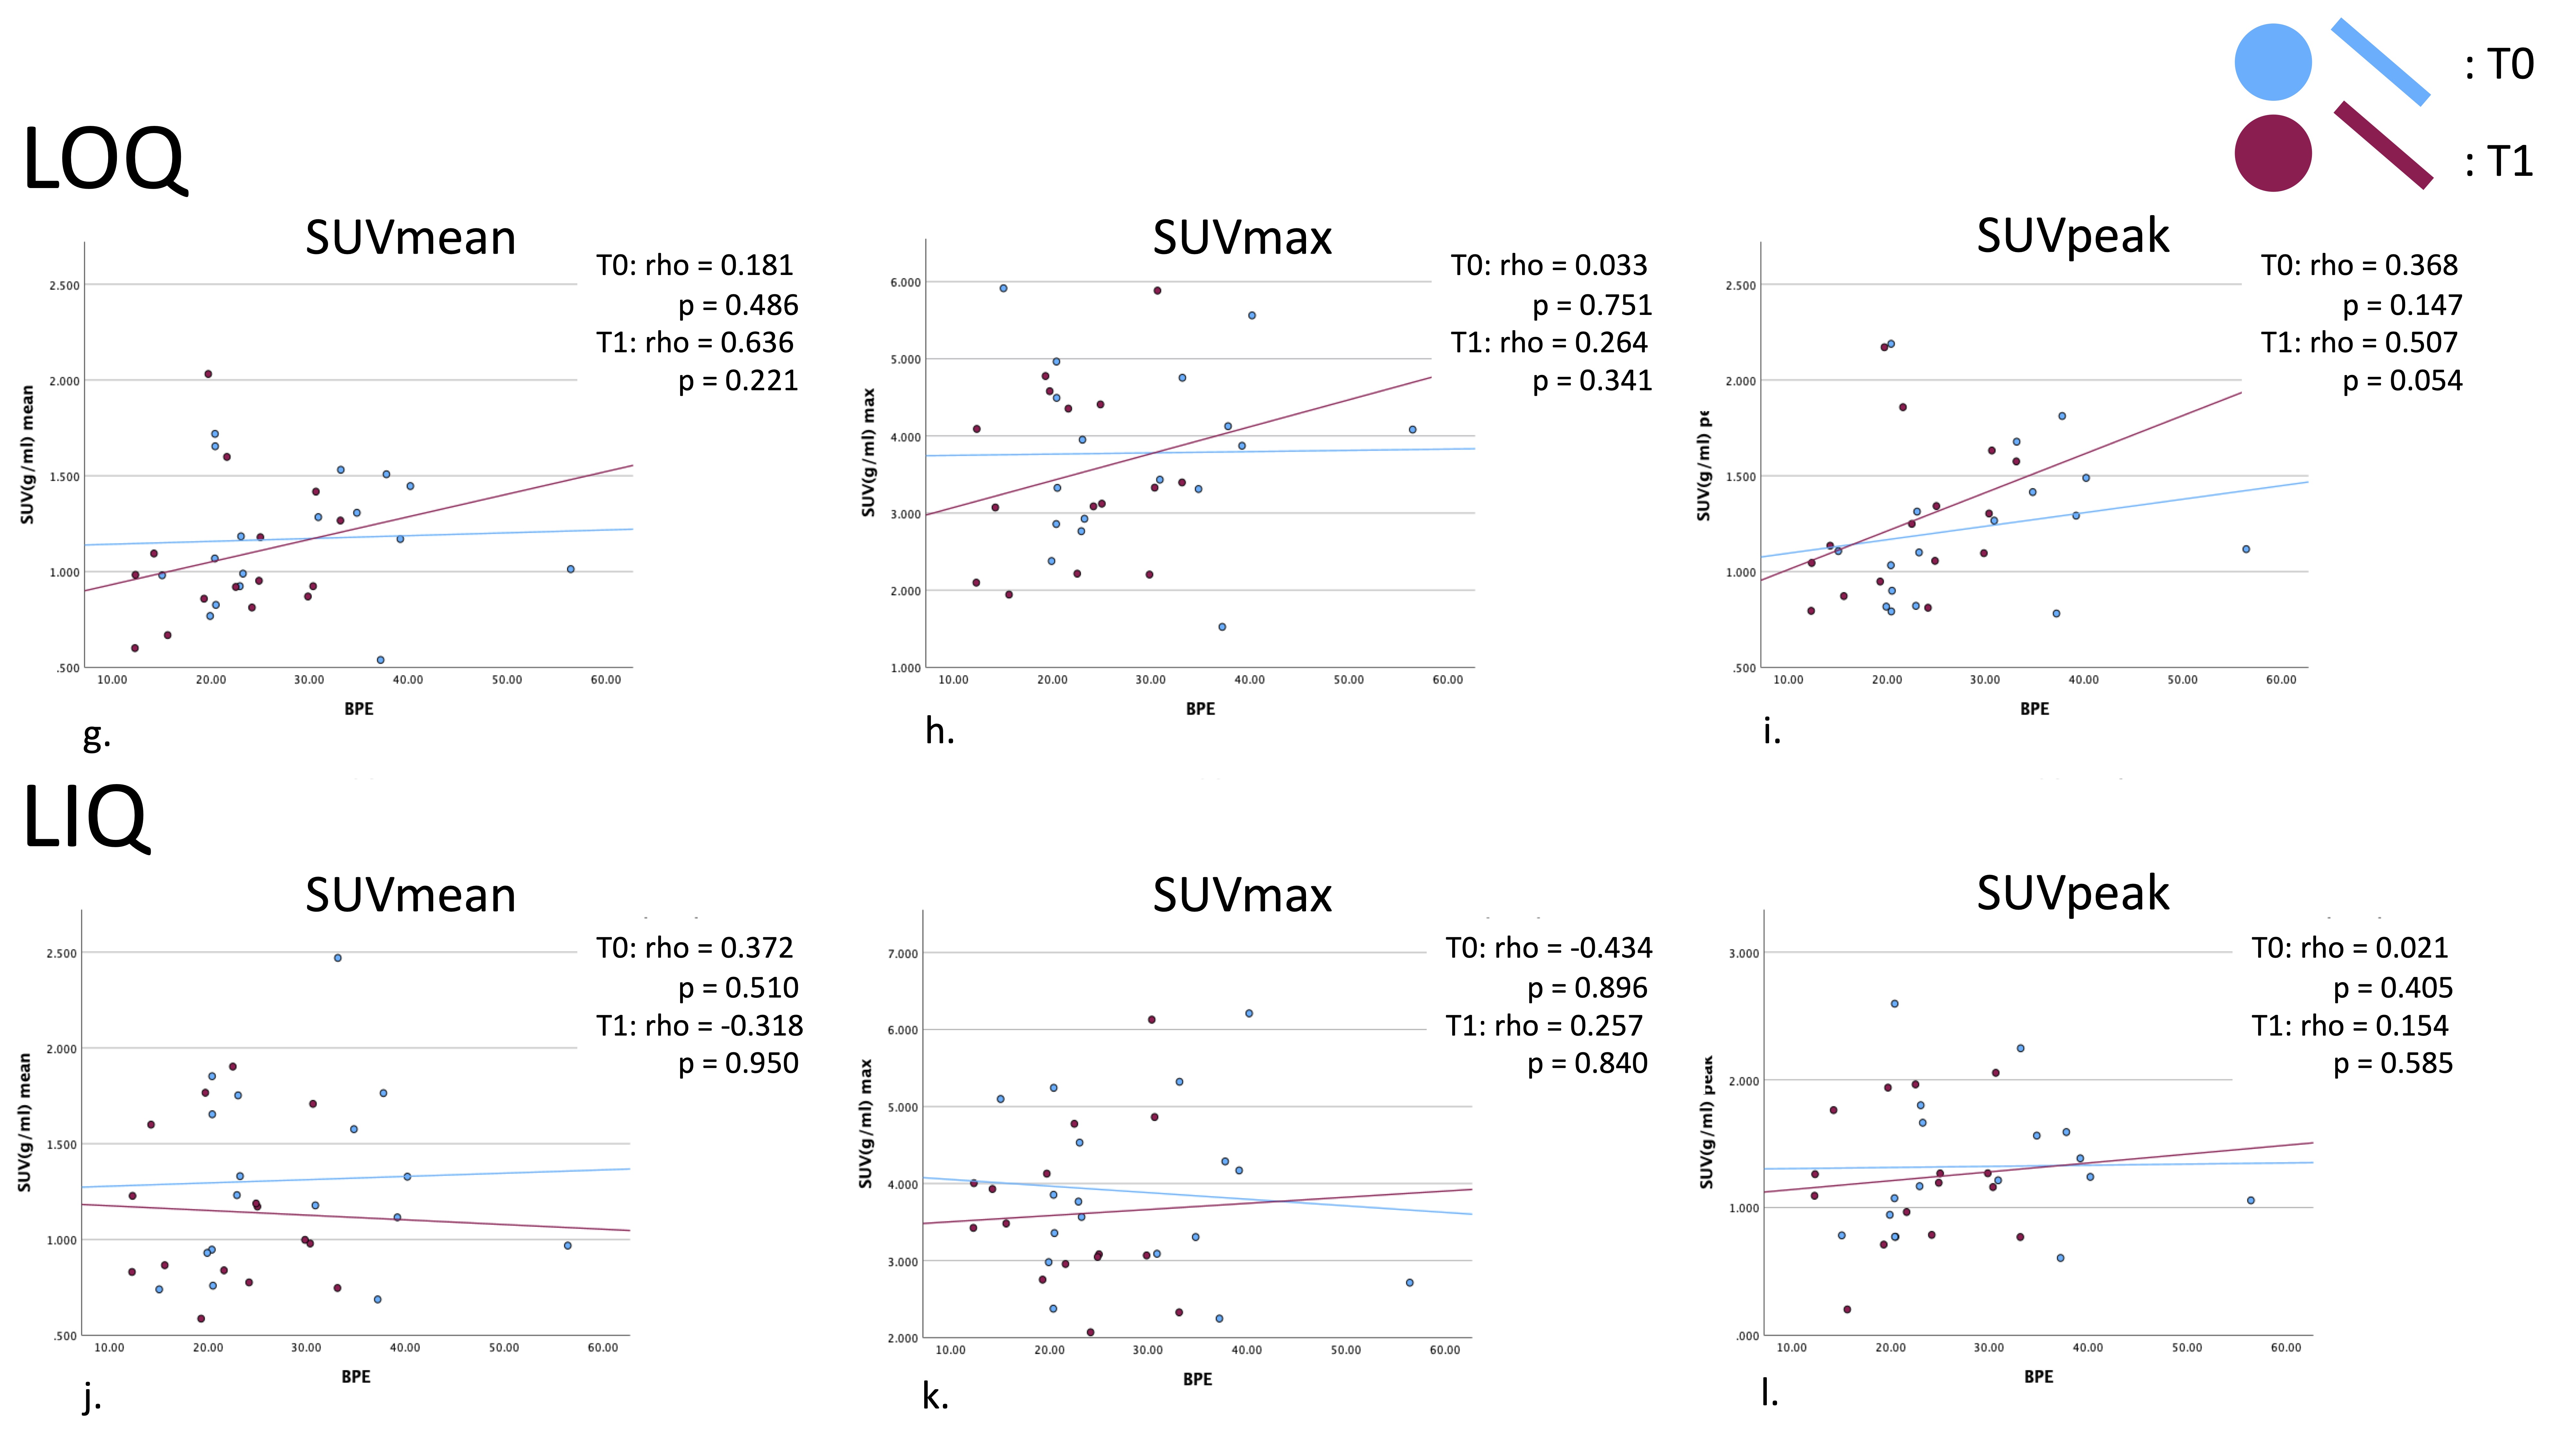
Patient age range was 32-72 years. Figure 1 presents the median [1st and 3rd quartiles] of each parameter at T0 and T1 with estimated median difference in parameters (parameter for T0 minus that for T1) in the ipsilateral breast and all quadrants of the contralateral breast. Figure 2 shows the data as box plots. Statistically significant decrease in BPE was shown between T0 and T1 (p=0.009). Estimated BPU parameters (SUV mean, max and peak) were lower at T1 compared to T0 in all five locations, although the difference did not reach statistical significance. The largest decrease was found in SUV max in the ipsilateral breast, upper and lower outer quadrants of the contralateral breast. Figure 3 presents scatter plots for BPE vs. BPU (SUV mean, max and peak) in each quadrant of the contralateral breast. The plots and the calculated rho values suggested weak correlations, but no consistent patterns were identified.Conclusion
Our results illustrate the possible utility of MRI and FES-dbPET in detecting early changes of the breast parenchyma during NET. Although we cannot conclude if BPE and BPU are correlated because of the small sample size, there is the possibility that BPE and BPU provide different information. Further studies involving larger numbers of patients are needed to validate our initial observations.Acknowledgements
This work was supported by NIH U01 CA225427, NIH R01 CA132870, and NIH P01 CA210961, Department of Defense W81XWH-18-1-0671.References
1. Al-Zoughbi W, Al-Zhoughbi W, Huang J, et al. Tumor macroenvironment and metabolism. Semin Oncol 2014; 41: 281–95.
2. Choi EJ, Choi H, Choi SA, Youk JH. Dynamic contrast-enhanced breast magnetic resonance imaging for the prediction of early and late recurrences in breast cancer. Medicine 2016; 95: e5330.
3. Giess CS, Yeh ED, Raza S, Birdwell RL. Background parenchymal enhancement at breast MR imaging: normal patterns, diagnostic challenges, and potential for false-positive and false-negative interpretation. Radiographics 2014; 34: 234–47.
4 Liao GJ, Henze Bancroft LC, Strigel RM, et al. Background parenchymal enhancement on breast MRI: A comprehensive review. J Magn Reson Imaging 2019; published online April 19. DOI:10.1002/jmri.26762.
5 Onishi N, Li W, Newitt DC, et al. Breast MRI during neoadjuvant chemotherapy: lack of background parenchymal enhancement suppression and inferior treatment response. Radiology 2021; 301: 295–308.
6 Li W, Newitt DC, Gibbs J, et al. Predicting breast cancer response to neoadjuvant treatment using multi-feature MRI: results from the I-SPY 2 TRIAL. NPJ Breast Cancer 2020; 6: 63.
7 Hathi DK, Li W, Seo Y, et al. Evaluation of primary breast cancers using dedicated breast PET and whole-body PET. Sci Rep 2020; 10: 21930.
8 Jones EF, Ray KM, Li W, et al. Dedicated breast positron emission tomography for the evaluation of early response to neoadjuvant chemotherapy in breast cancer. Clin Breast Cancer 2017; 17: e155–9.
9 Spring LM, Gupta A, Reynolds KL, et al. Neoadjuvant Endocrine Therapy for Estrogen Receptor-Positive Breast Cancer: A Systematic Review and Meta-analysis. JAMA Oncol 2016; 2: 1477–86.
Figures
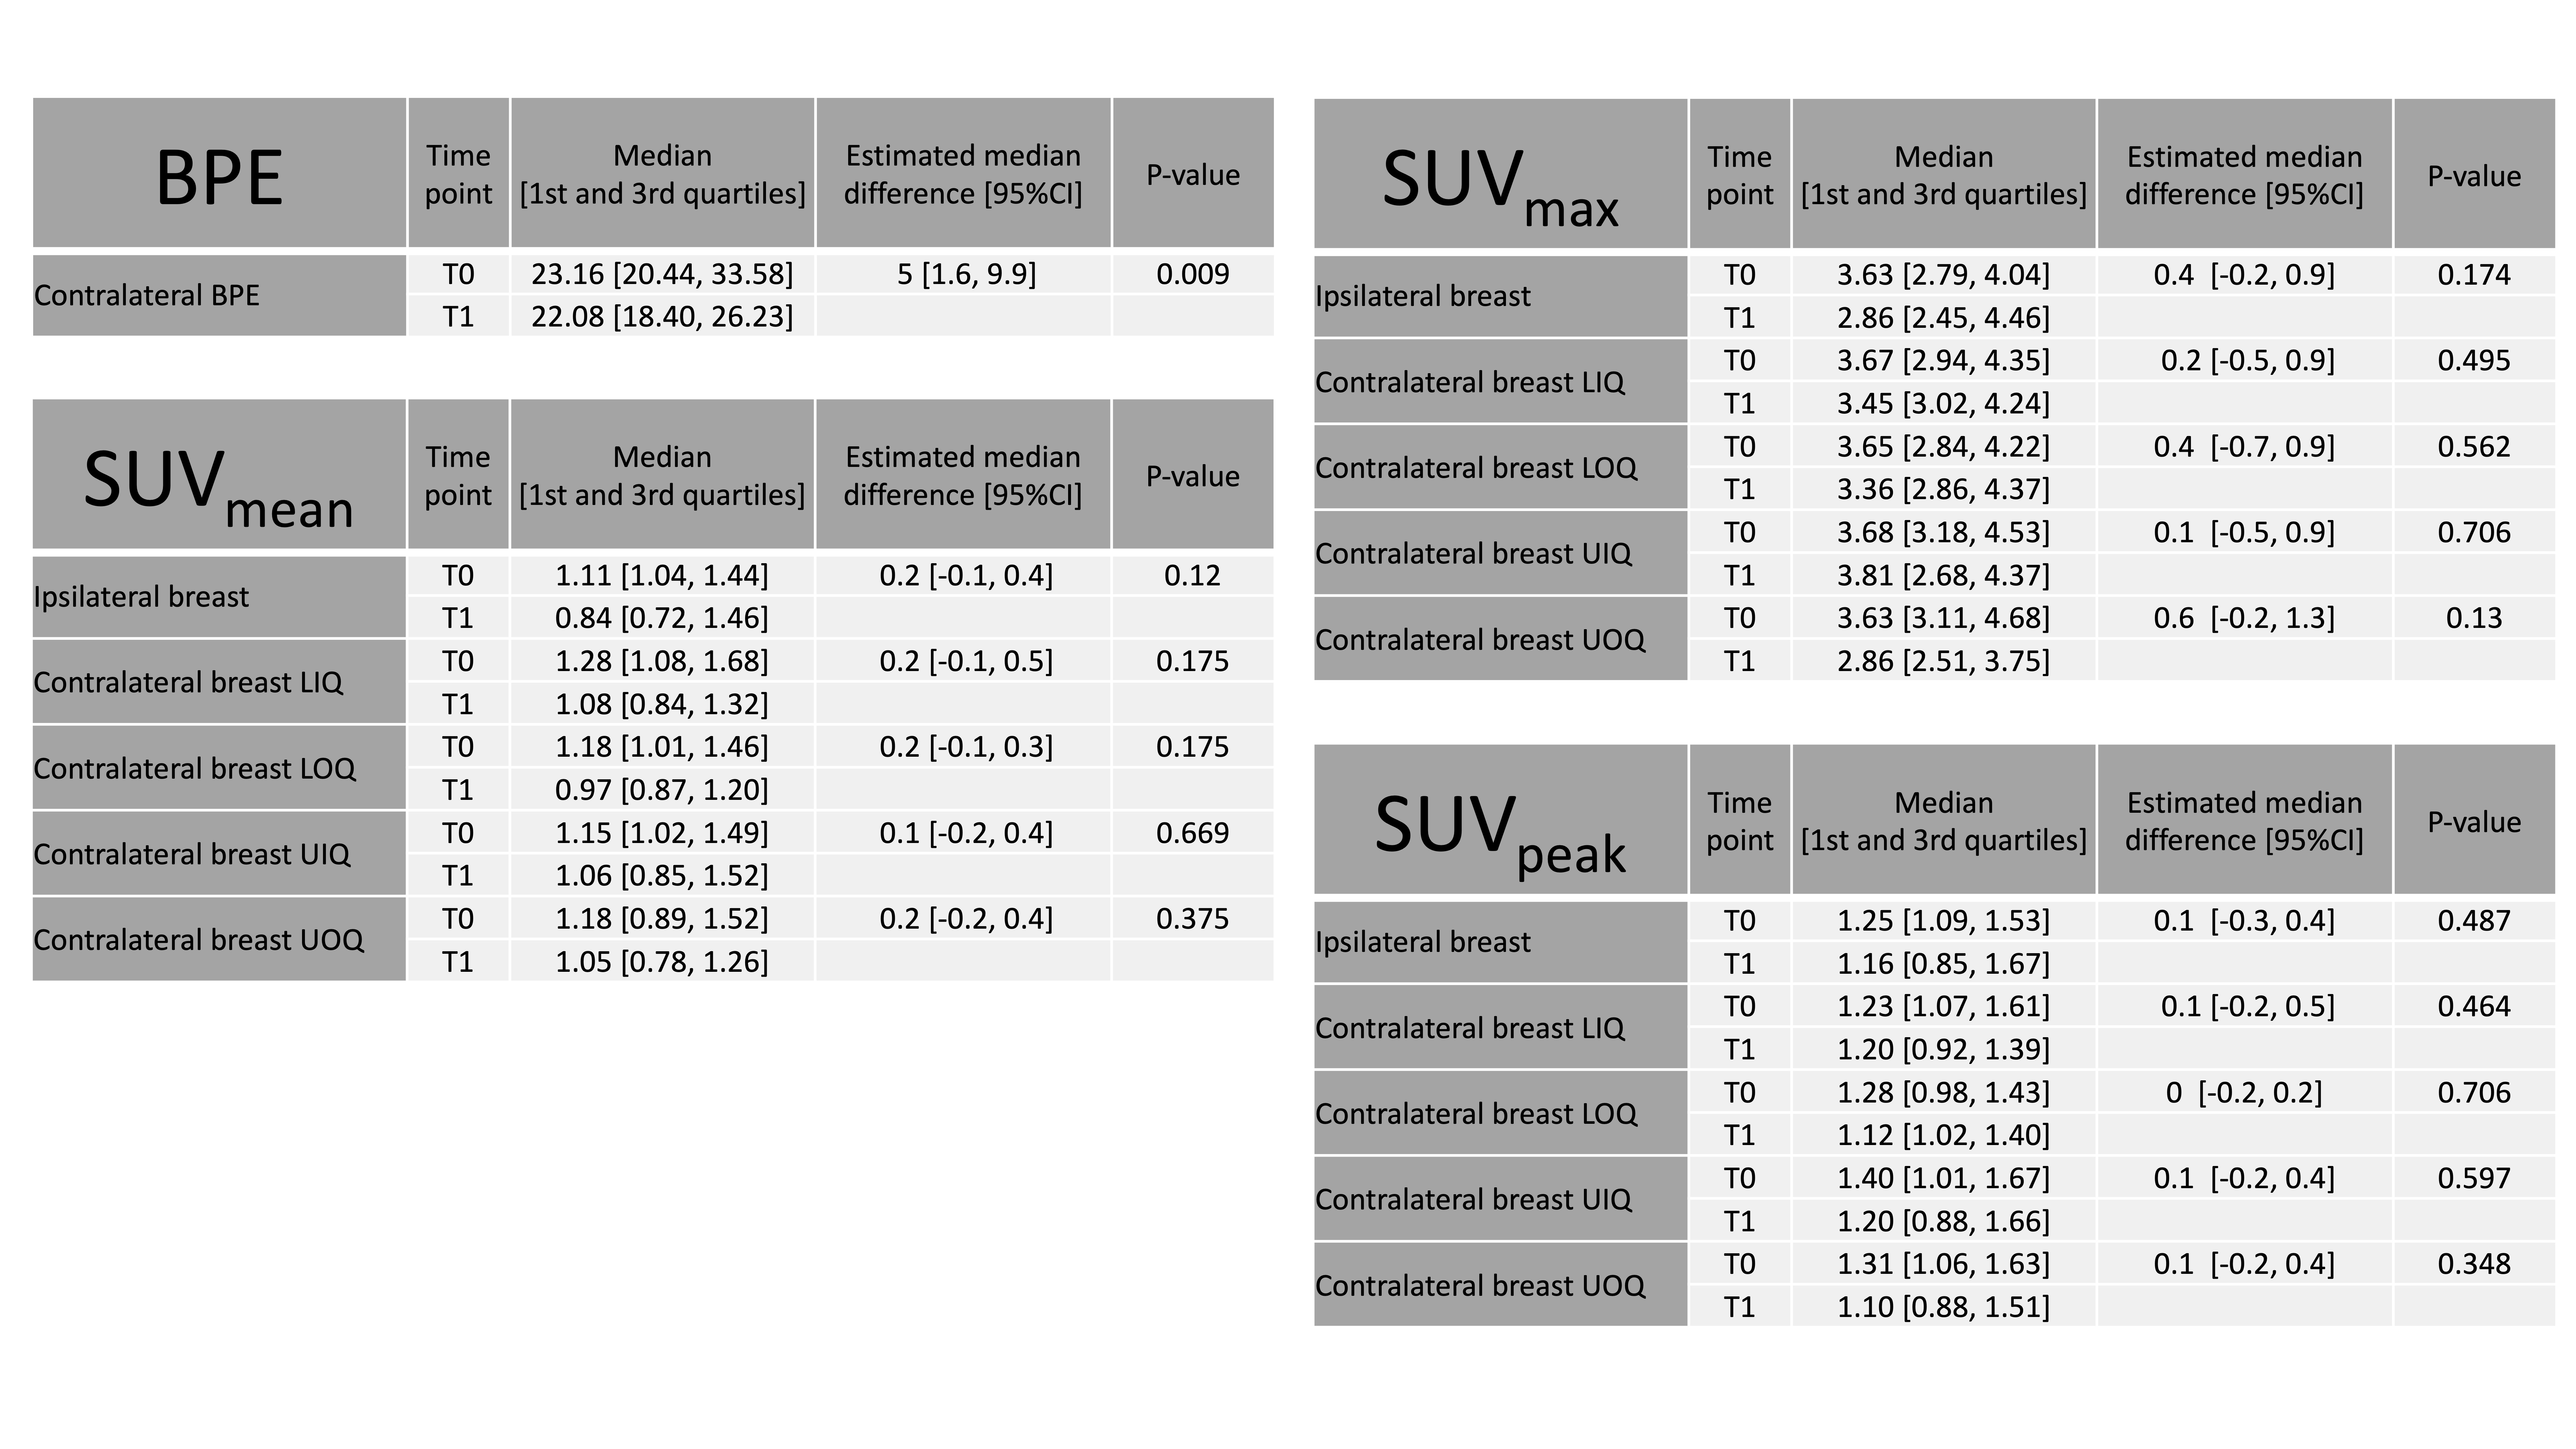
Figure 1. Comparison of BPE and BPU parameters between baseline (T0) and after 3 weeks of neoadjuvant endocrine treatment (T1).
BPE: Background parenchyma enhancement, BPU: Background parenchymal uptake, Ipsi: Ipsilateral breast. LIQ: Lower inner quadrant of the contralateral breast. LOQ: Lower outer quadrant. UOQ: Upper outer quadrant. UIQ: Upper inner quadrant.