3459
MRI-based tumor shrinkage patterns after early neoadjuvant therapy in breast cancer: Correlation with subtypes and pathological response1The First Hospital of China Medical University, Shenyang, China, 2GE Healthcare, Beijing, China
Synopsis
Keywords: Breast, Cancer, breast cancer, neoadjuvant chemotherapy
We analyzed the correlation between MRI-based tumor shrinkage patterns after the early stage (first and second cycles) of NAC and pathological response in different subtypes. Fragmentation and diffuse decrease are collectively referred to as non-CS. We found that non-CS could be observed in some patients after the early stage of NAC, and non-CS and pCR were significantly correlated in HR+/HER2 subtypes after the first cycle of NAC.Background
The purpose was to analyze and compare the relationship between dynamic contrast-enhanced magnetic resonance imaging (DCE-MRI) tumor shrinkage patterns after the early stage (first and second cycles) of neoadjuvant chemotherapy (NAC) and its relationship with molecular subtypes and pathological response.Methods
We retrospectively analyzed the clinicopathological data of 350 patients with invasive ductal cancers who received NAC in the first hospital of China medical university from September 2018 to December 2021. Patients underwent baseline DCE-MRI and DCE-MRI following the first or second cycle of NAC. Two breast radiologists (with 2 years and 10 years of experience respectively) independently measured and evaluated the maximum tumor diameter and the shrinkage patterns at peak enhancement. The shrinkage patterns were categorized into five types: concentric shrinkage (CS: > 3mm), fragmentation, diffuse decrease, stable (no response,Shrinkage < 3mm or increase < 3mm) and progressive (increase > 3mm or new lesions)1. Fragmentation and diffuse decrease collectively referred to as non-CS. According to the pathological results after NAC, the patients were divided into complete response (pCR) group and non-pCR group. In all patients and each subtype, Fisher’s exact and Mann-Whitney tests were used to compare the differences of clinicopathological and imaging indicators between pCR group and non-pCR group; Binary logistic regression was used to evaluate univariate and multivariate associations with pCR. Stratified analysis according to the molecular subtype.Results
There were 350 women with 351 tumors (1 bilateral) in both study cohorts(DCE-MRI baseline and after the first cycle of NAC: 248, including HR+/HER2-: 101, HER2+: 94, TN: 53; DCE-MRI baseline and after the second cycle of NAC: 210, including HR+/HER2-: 94, HER2+: 75, TN: 41. After the first cycle of NAC, 84 patients had a pCR, and 164 patients had a non-pCR. The most common tumor shrinkage pattern of each subtype in the pCR group was CS, followed by non-CS(HR+/HER2-: reader 1 and 2: 3/8, HER2+: reader 1 and 2: 20/50, TN: reader 1 and 2: 5/26). After the second cycle of NAC, 70 patients had a pCR, and 140 patients had a non-pCR. The most common tumor shrinkage pattern of each subtype in the pCR group was CS, followed by non-CS(HR+/HER2-: reader 1 and 2: 2/9, HER2+: reader 1 and 2: 21/43, TN: reader 1: 5/18, reader 2: 4/18) ,and no stable disease in pCR group. After the first cycle of NAC, univariate analysis showed that non-CS was associated with pCR in HR+/HER2-(OR: 6.450, p=0.038), stable diseases were associated with non-pCR in TN(OR: 0.059, p<0.001) and HER2+(OR: 0.099, p=0.035) . Multivariate analysis showed non-CS was significantly associated with pCR in HR+/HER2-(OR: 7.722, p<0.029), and was independent of size. After the second cycle of NAC, univariate analysis showed that there was no significant correlation between non-CS and pCR in all subtypes, but only size was related to pCR.Discussion
MRI can evaluate tumor response and chemosensitivity after early neoadjuvant chemotherapy. The accuracy of MRI in determining the size of luminal tumors during NAC is lower than non-luminal tumors, because fibrous stroma may persist, or even enhance on MRI, resulting in some tumors showing as scattered islands of tumor cells. Therefore, measuring tumor size alone cannot reflect the overall loss of tumor internal environment. Goorts et al.2 and Reis et al.3 found that concentric and fragmentation tumors halfway through NAC were more frequently observed in the pCR group. This is partly consistent with our results. Since the number of diffuse decreas were too small, we call fragmentation and diffuse decrease non-CS. We found that 33% and 40% of non-CS tumors had pCR after the first and second cycles of NAC, respectively. And non-CS was significantly associated with pCR in HR+/HER2- after the first cycles of NAC. This result may be explained by the heterogeneity and low pCR rate in HR+/HER2-. Non-CS pattern tumors may have more drug-resistant cells than CS, its apoptosis rate and sensitivity to chemotherapy is low. Due to the inconsistent shrinkage degree after the early stage of NAC, such cells are more likely to collapse and may acquire the ability of distant metastasis. Whereas TN and HER2+ tumors, massive tumor regression was observed after the first cycles of NAC. We also observed that the shrinkage pattern had no significant effect on pCR in each subtype after the second cycle of NAC. It could be that tumor cells that were less sensitive to first chemotherapy cycle continue to kill those cells in the second. In addition, these studies analyzed shrinkage patterns halfway through or after completion of NAC. At this point, changes in treatment regimen are no longer possible. We demonstrated after the first cycle of NAC that non-CS is favorable for pCR in the HR+/HER2-. It suggests that non-CS pattern is a good imaging factor for clinicians after early neoadjuvant therapy.Conclusion
Some non-CS tumors can be observed in the early stage of NAC. After the first cycle of NAC, the non-CS pattern was significantly associated with pCR in HR+/HER2-, and was independent of size. The stable disease strongly indicates poor pathological response. After the second cycle of NAC, shrinkage pattern no longer affects pCR, only size was significantly related to pCR.Keywords
breast cancer, neoadjuvant chemotherapy, magnetic resonance imagingAcknowledgements
No.References
1. Fukada I, Araki K, Kobayashi K, Shibayama T, Takahashi S, Gomi N, Kokubu Y, Oikado K, Horii R, Akiyama F, Iwase T, Ohno S, Hatake K, Sata N, Ito Y. Pattern of Tumor Shrinkage during Neoadjuvant Chemotherapy Is Associated with Prognosis in Low-Grade Luminal Early Breast Cancer. Radiology. 2018 Jan;286(1):49-57.
2. Goorts B, Dreuning KMA, Houwers JB, Kooreman LFS, Boerma EG, Mann RM, Lobbes MBI, Smidt ML. MRI-based response patterns during neoadjuvant chemotherapy can predict pathological (complete) response in patients with breast cancer. Breast Cancer Res. 2018 Apr 18;20(1):34.
3. Reis J, Thomas O, Lahooti M, Lyngra M, Schandiz H, Boavida J, Gjesdal KI, Sauer T, Geisler J, Geitung JT. Correlation between MRI morphological response patterns and histopathological tumor regression after neoadjuvant endocrine therapy in locally advanced breast cancer: a randomized phase II trial. Breast Cancer Res Treat. 2021 Oct;189(3):711-723.
Figures
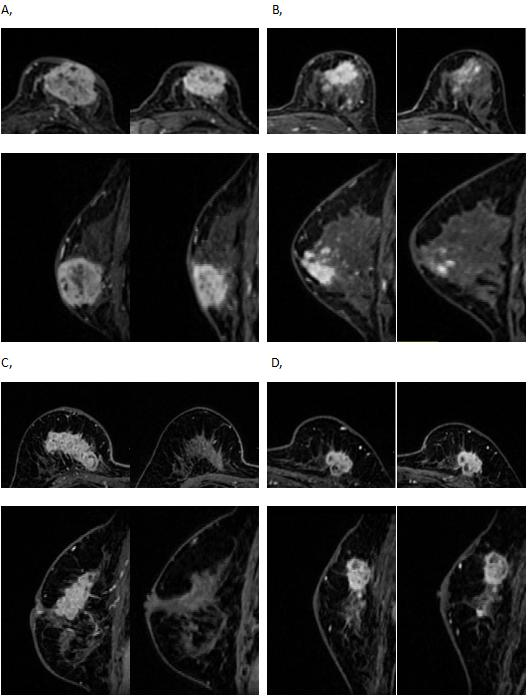
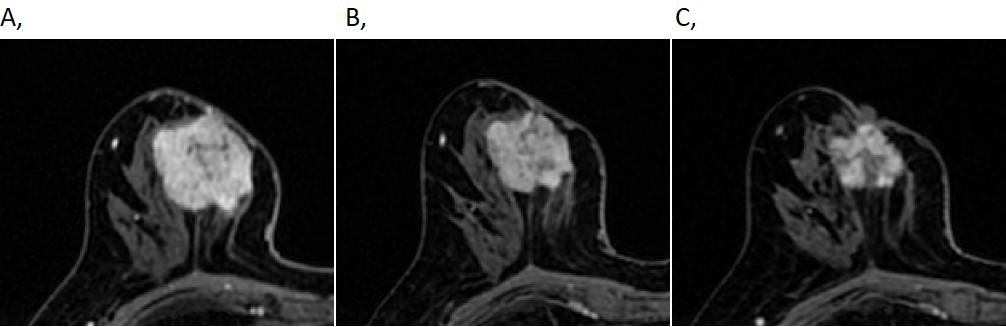
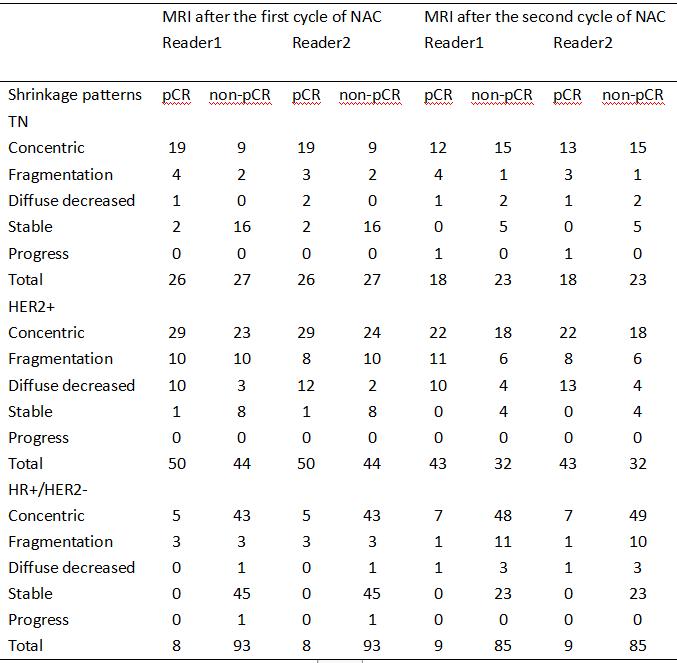
Table 1. MRI-based shrinkage patterns of breast cancers after the first and second cycle of NAC association with the pathological response according to different molecular subtypes.
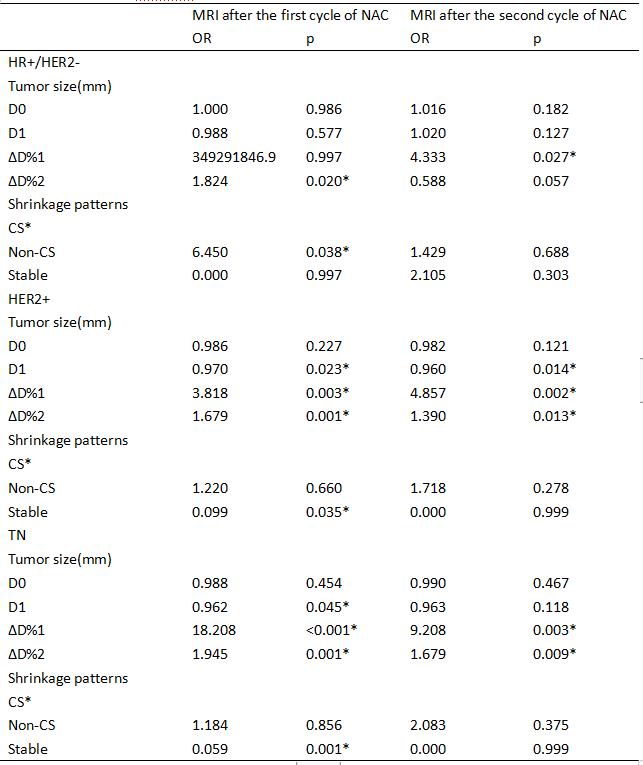
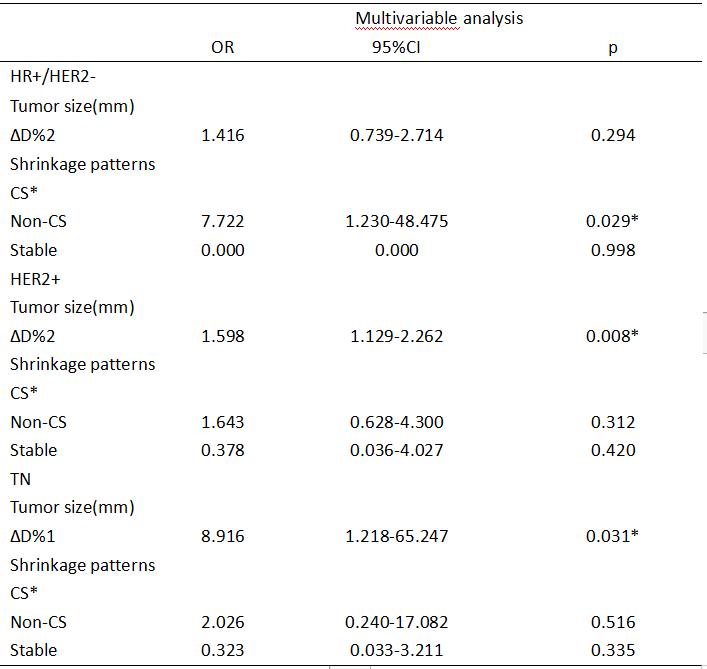
Table 2. Univariable analysis of factors associated with the pathological response according to different molecular subtypes.
CS: concentric shrinkage; Non-CS: fragmentation and diffuse decrease; ∆D%1: categorical variable, cutoff value of ∆D% in ROC curve(after the first cycle of NAC: 12%, 27%, 13% in HR+/HER2-, HER2+, TN, respectively; after the second cycle of NAC: 6%, 28%, 36% in HR+/HER2-, HER2+, TN, respectively), ∆D%2: continuous variable, ∆D% in 10% increments.