3458
Breast MRI during neoadjuvant endocrine therapy for patients with estrogen-receptor positive/HER2 negative breast cancer1Department of Radiology & Biomedical Imaging, University of California, San Francisco, San Francisco, CA, United States, 2Department of Surgery, University of California, San Francisco, San Francisco, CA, United States, 3Quantum Leap Healthcare Collaborative, San Francisco, CA, United States, 4Department of Medicine, University of California, San Francisco, San Francisco, CA, United States
Synopsis
Keywords: Breast, Cancer
This study aimed to investigate the longitudinal changes in functional tumor volume (FTV) and background parenchymal enhancement (BPE) derived from dynamic contrast-enhanced breast MRI during neoadjuvant endocrine therapy (NET). For comparison, we also evaluated a similar cohort of patients who received standard neoadjuvant chemotherapy (NAC). Similar to the NAC cohort, the NET cohort showed early changes in FTV and BPE as early as three weeks of treatment. In the NET cohort, early BPE decrease was prominent especially for patients with higher baseline BPE and premenopausal patients. These finding illustrate the potential of MRI metrics as early imaging biomarkers for NET.Purpose
Neoadjuvant endocrine therapy (NET) is increasingly utilized for patients with hormone receptor-positive (HR+)/HER2-negative breast cancer because NET has less toxicity and similar effectiveness to NAC1. However, there is limited evidence that pathological response or change in biomarkers after NET is predictive of survival outcome2. Although imaging could supplement other biomarkers, there is limited research on MRI during NET.Our previous study using dynamic contrast-enhanced (DCE) breast MRI in the I-SPY 2 TRIAL illustrated the utility of functional tumor volume (FTV) and background parenchymal enhancement (BPE) in predicting treatment response to neoadjuvant chemotherapy (NAC)3–6. BPE is a quantitative measure of normal fibroglandular breast tissue enhancement, which is separately described from tumor enhancement7. It is well known that BPE is affected by hormonal status and suppressed by post-surgical hormone therapy8–10.
In the ongoing I-SPY 2 TRIAL, patients are provided with the chance to redirect to less toxic or more effective therapy based on excellent versus minimal early response to NAC, respectively11. Patient stratification for treatment redirection is currently based on early prediction of outcome using FTV and biopsy pathology. Similarly, a combination of FTV and BPE might be helpful to navigate treatment redirection strategies for patients receiving NET. This study focused on the investigation of 1) longitudinal FTV and BPE changes during NET and 2) impact of menopausal status on BPE changes during NET.
Methods
We included patients with stage 2/3, MammaPrint (MP) low-risk, HR+/HER2-negative breast cancer receiving NET in an ongoing I-SPY 2 sub-study as of October 2022 (NET cohort). For comparison, we also evaluated a similar sub-cohort of I-SPY 2 patients with stage 2/3, MP high-risk 1, HR+/HER2-negative cancer who completed standard NAC between 2010–2016 (NAC cohort). I-SPY 2 participants undergo four MRI exams, at baseline (T0, pre-treatment), 3-week (T1), 12-week (T2), and 6-month (T3, pre-surgery) time points. Inclusion criteria for this analysis were defined as follows: 1) patients with analyzable MRI at T0 and T1, 2) patients with known menopausal status. Standardized DCE MRI protocol in I-SPY 2 is as follows: acquisition duration 80–100s; early phase timing 120–150s post-contrast injection; FOV 260–360 mm; in-plane resolution ≤1.4 mm; slice thickness ≤2.5 mm. Using in-house software developed in IDL (L3Harris Geospatial, Broomfield, CO, USA), the contralateral breast parenchyma was automatically segmented for the entire breast volume. Contralateral BPE was quantitatively measured as the mean early (~150s post-contrast injection) percent enhancement of the central 50% of the segmented axial slices. Percent FTV change at Tn (n = 1, 2, or 3) was calculated by ( FTVTn- FTVT0)/ FTVT0×100%. Percent BPE change was similarly calculated.Longitudinal changes in FTV and BPE were evaluated for the NET and NAC cohorts. Subgroup analysis by menopausal status was performed in the NET cohort. Mann-Whitney U test was used for statistical comparison. P values less than 0.05 were considered to indicate statistical significance.
Results
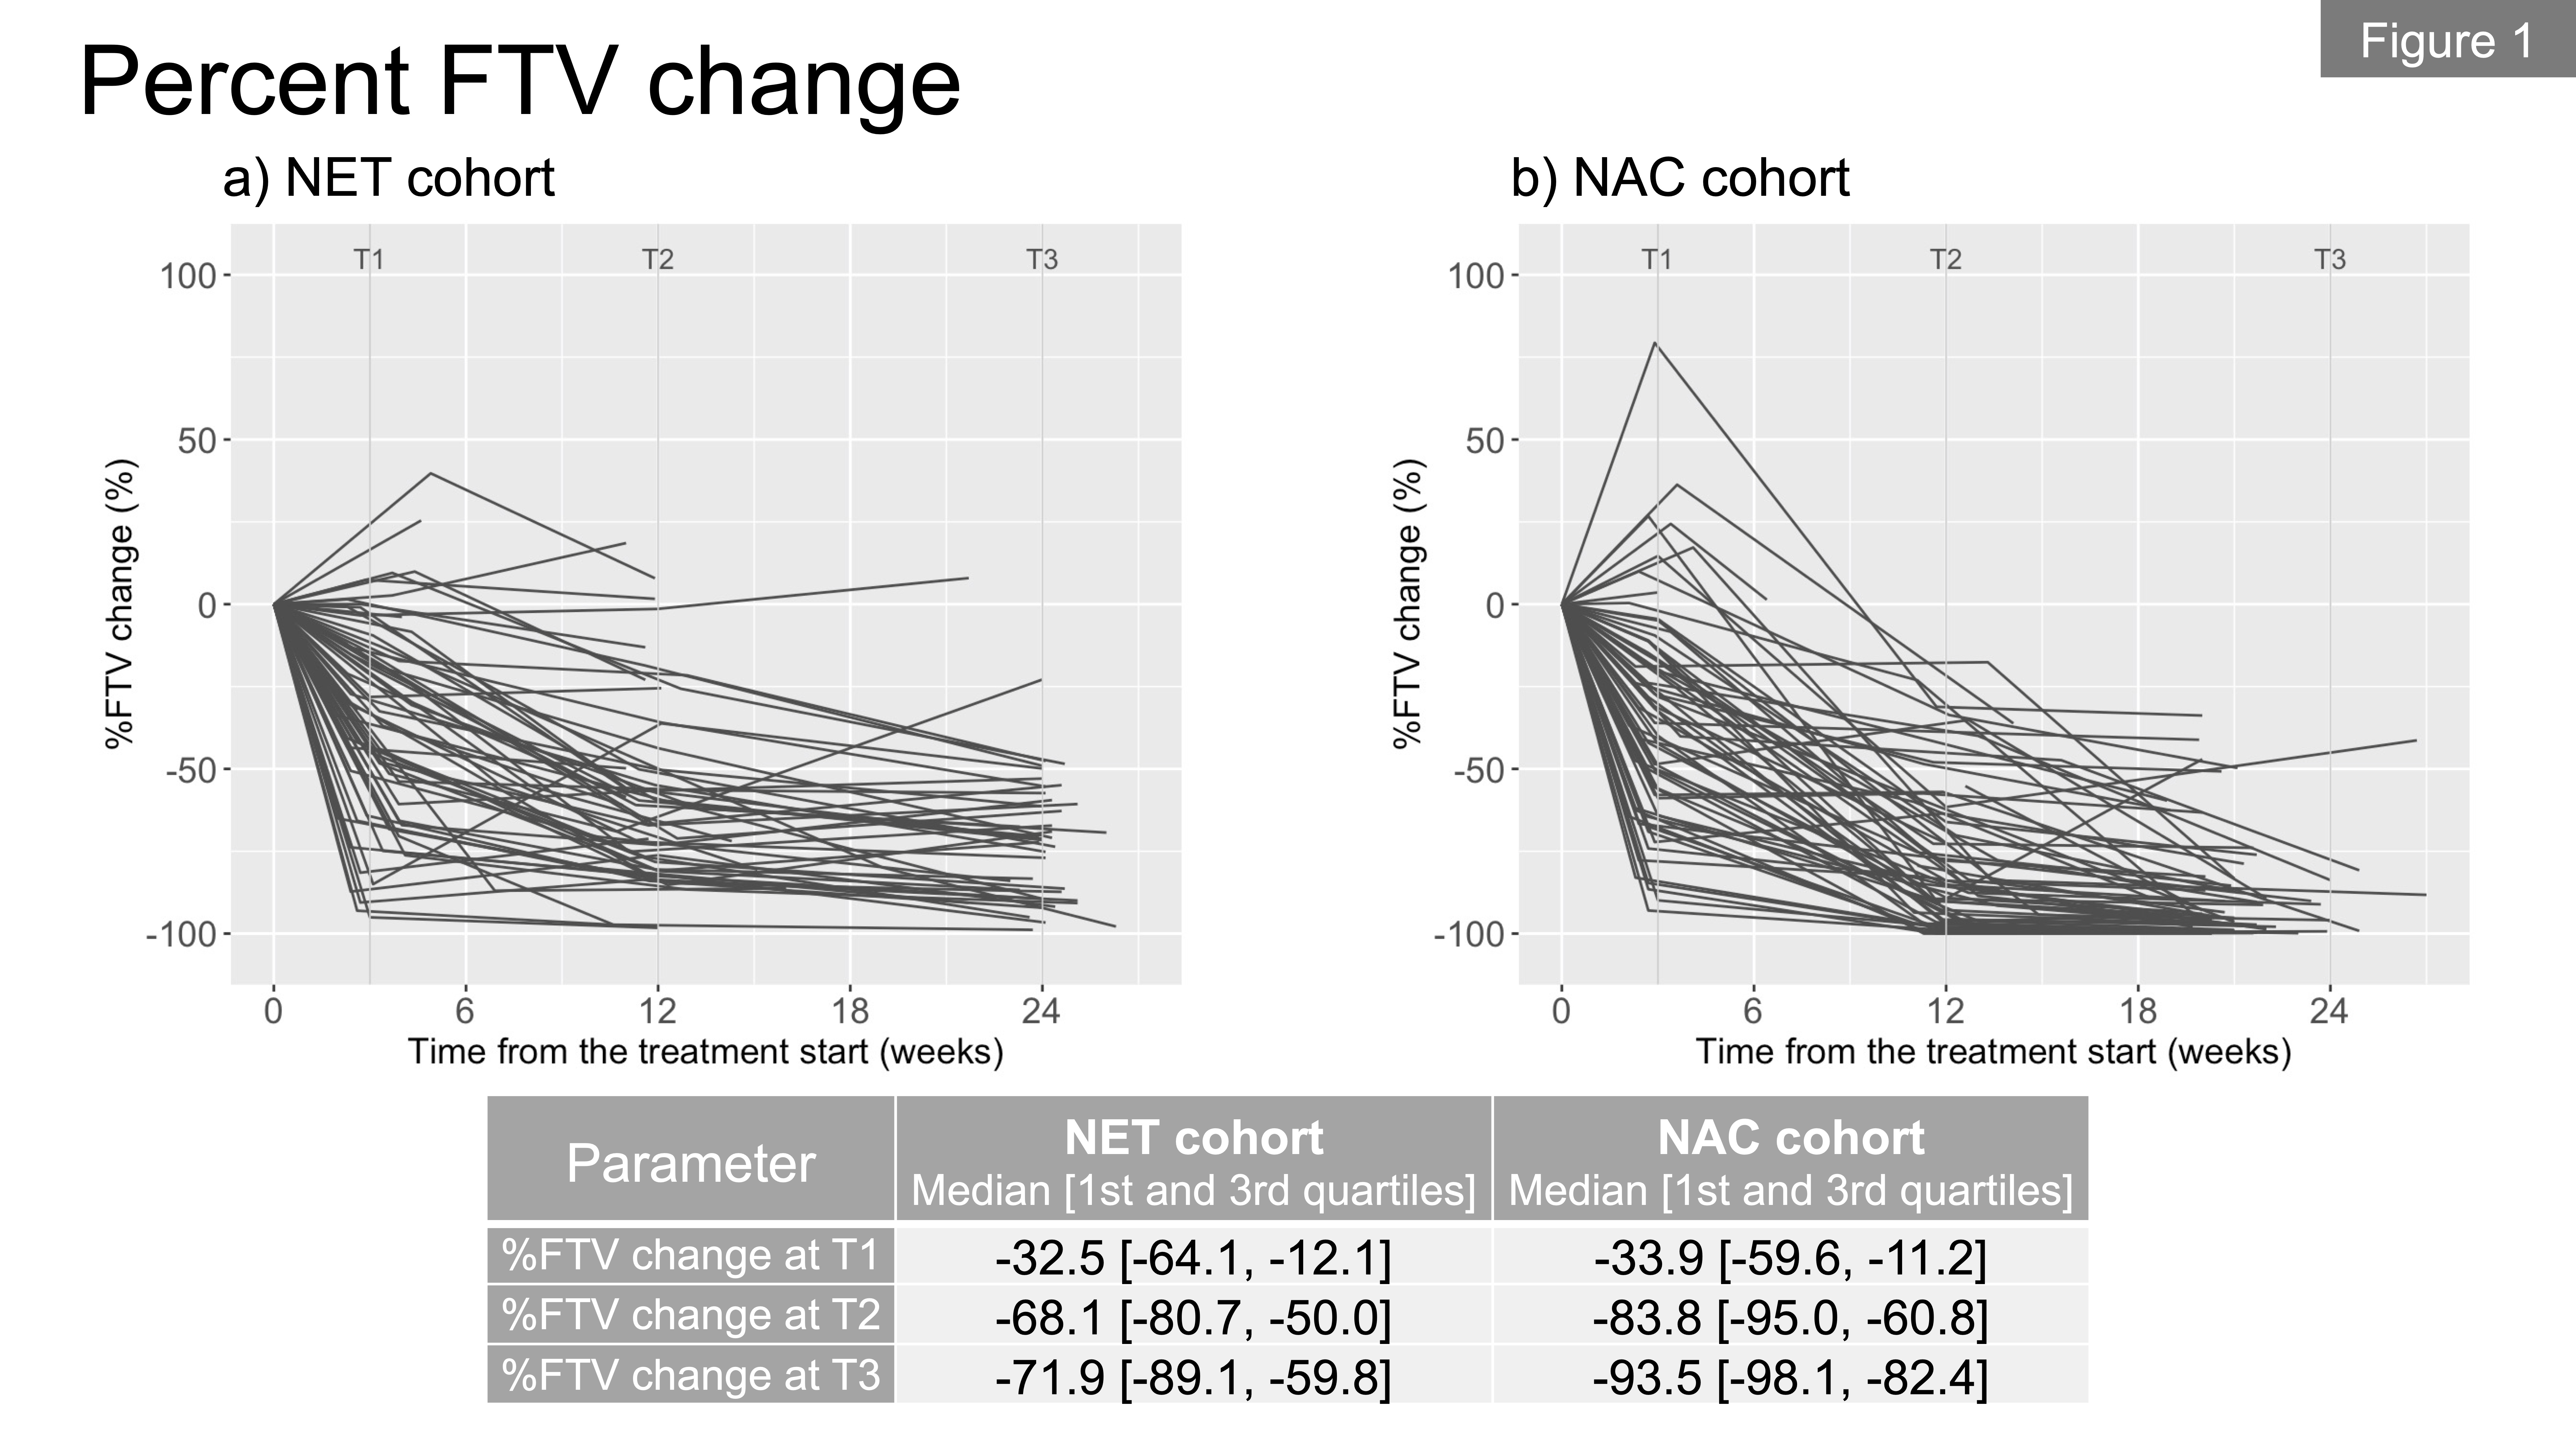
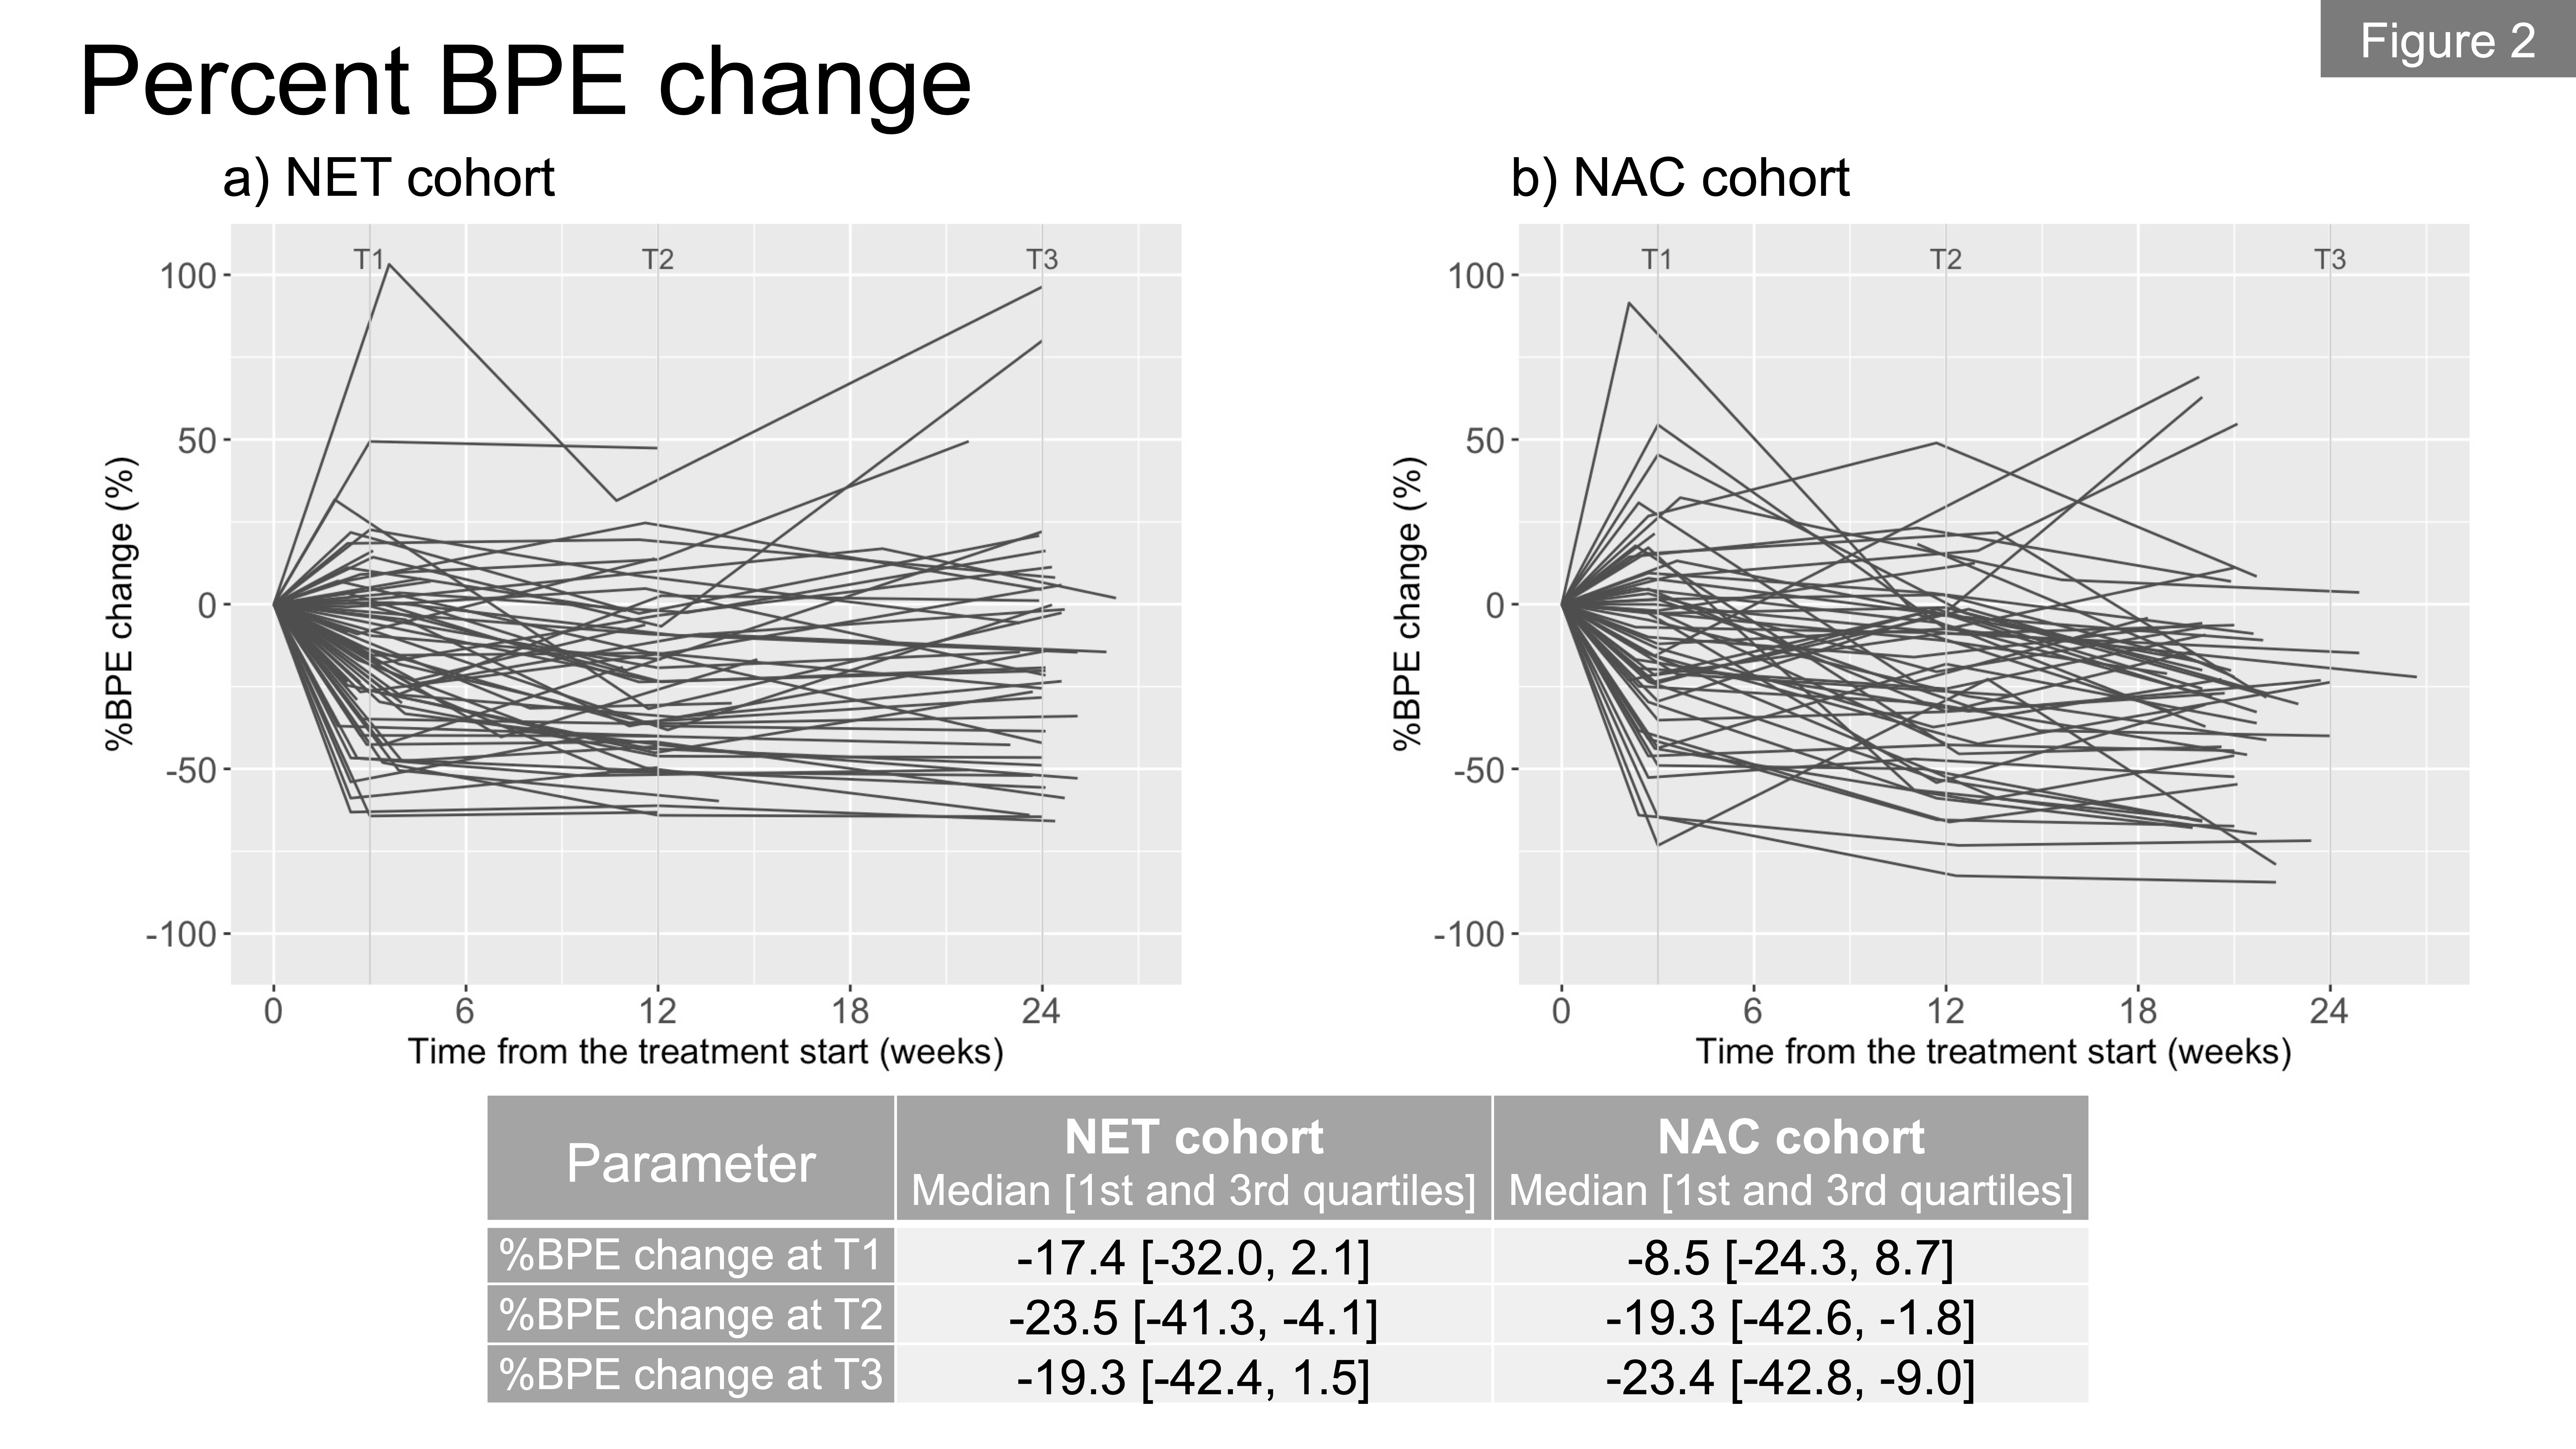
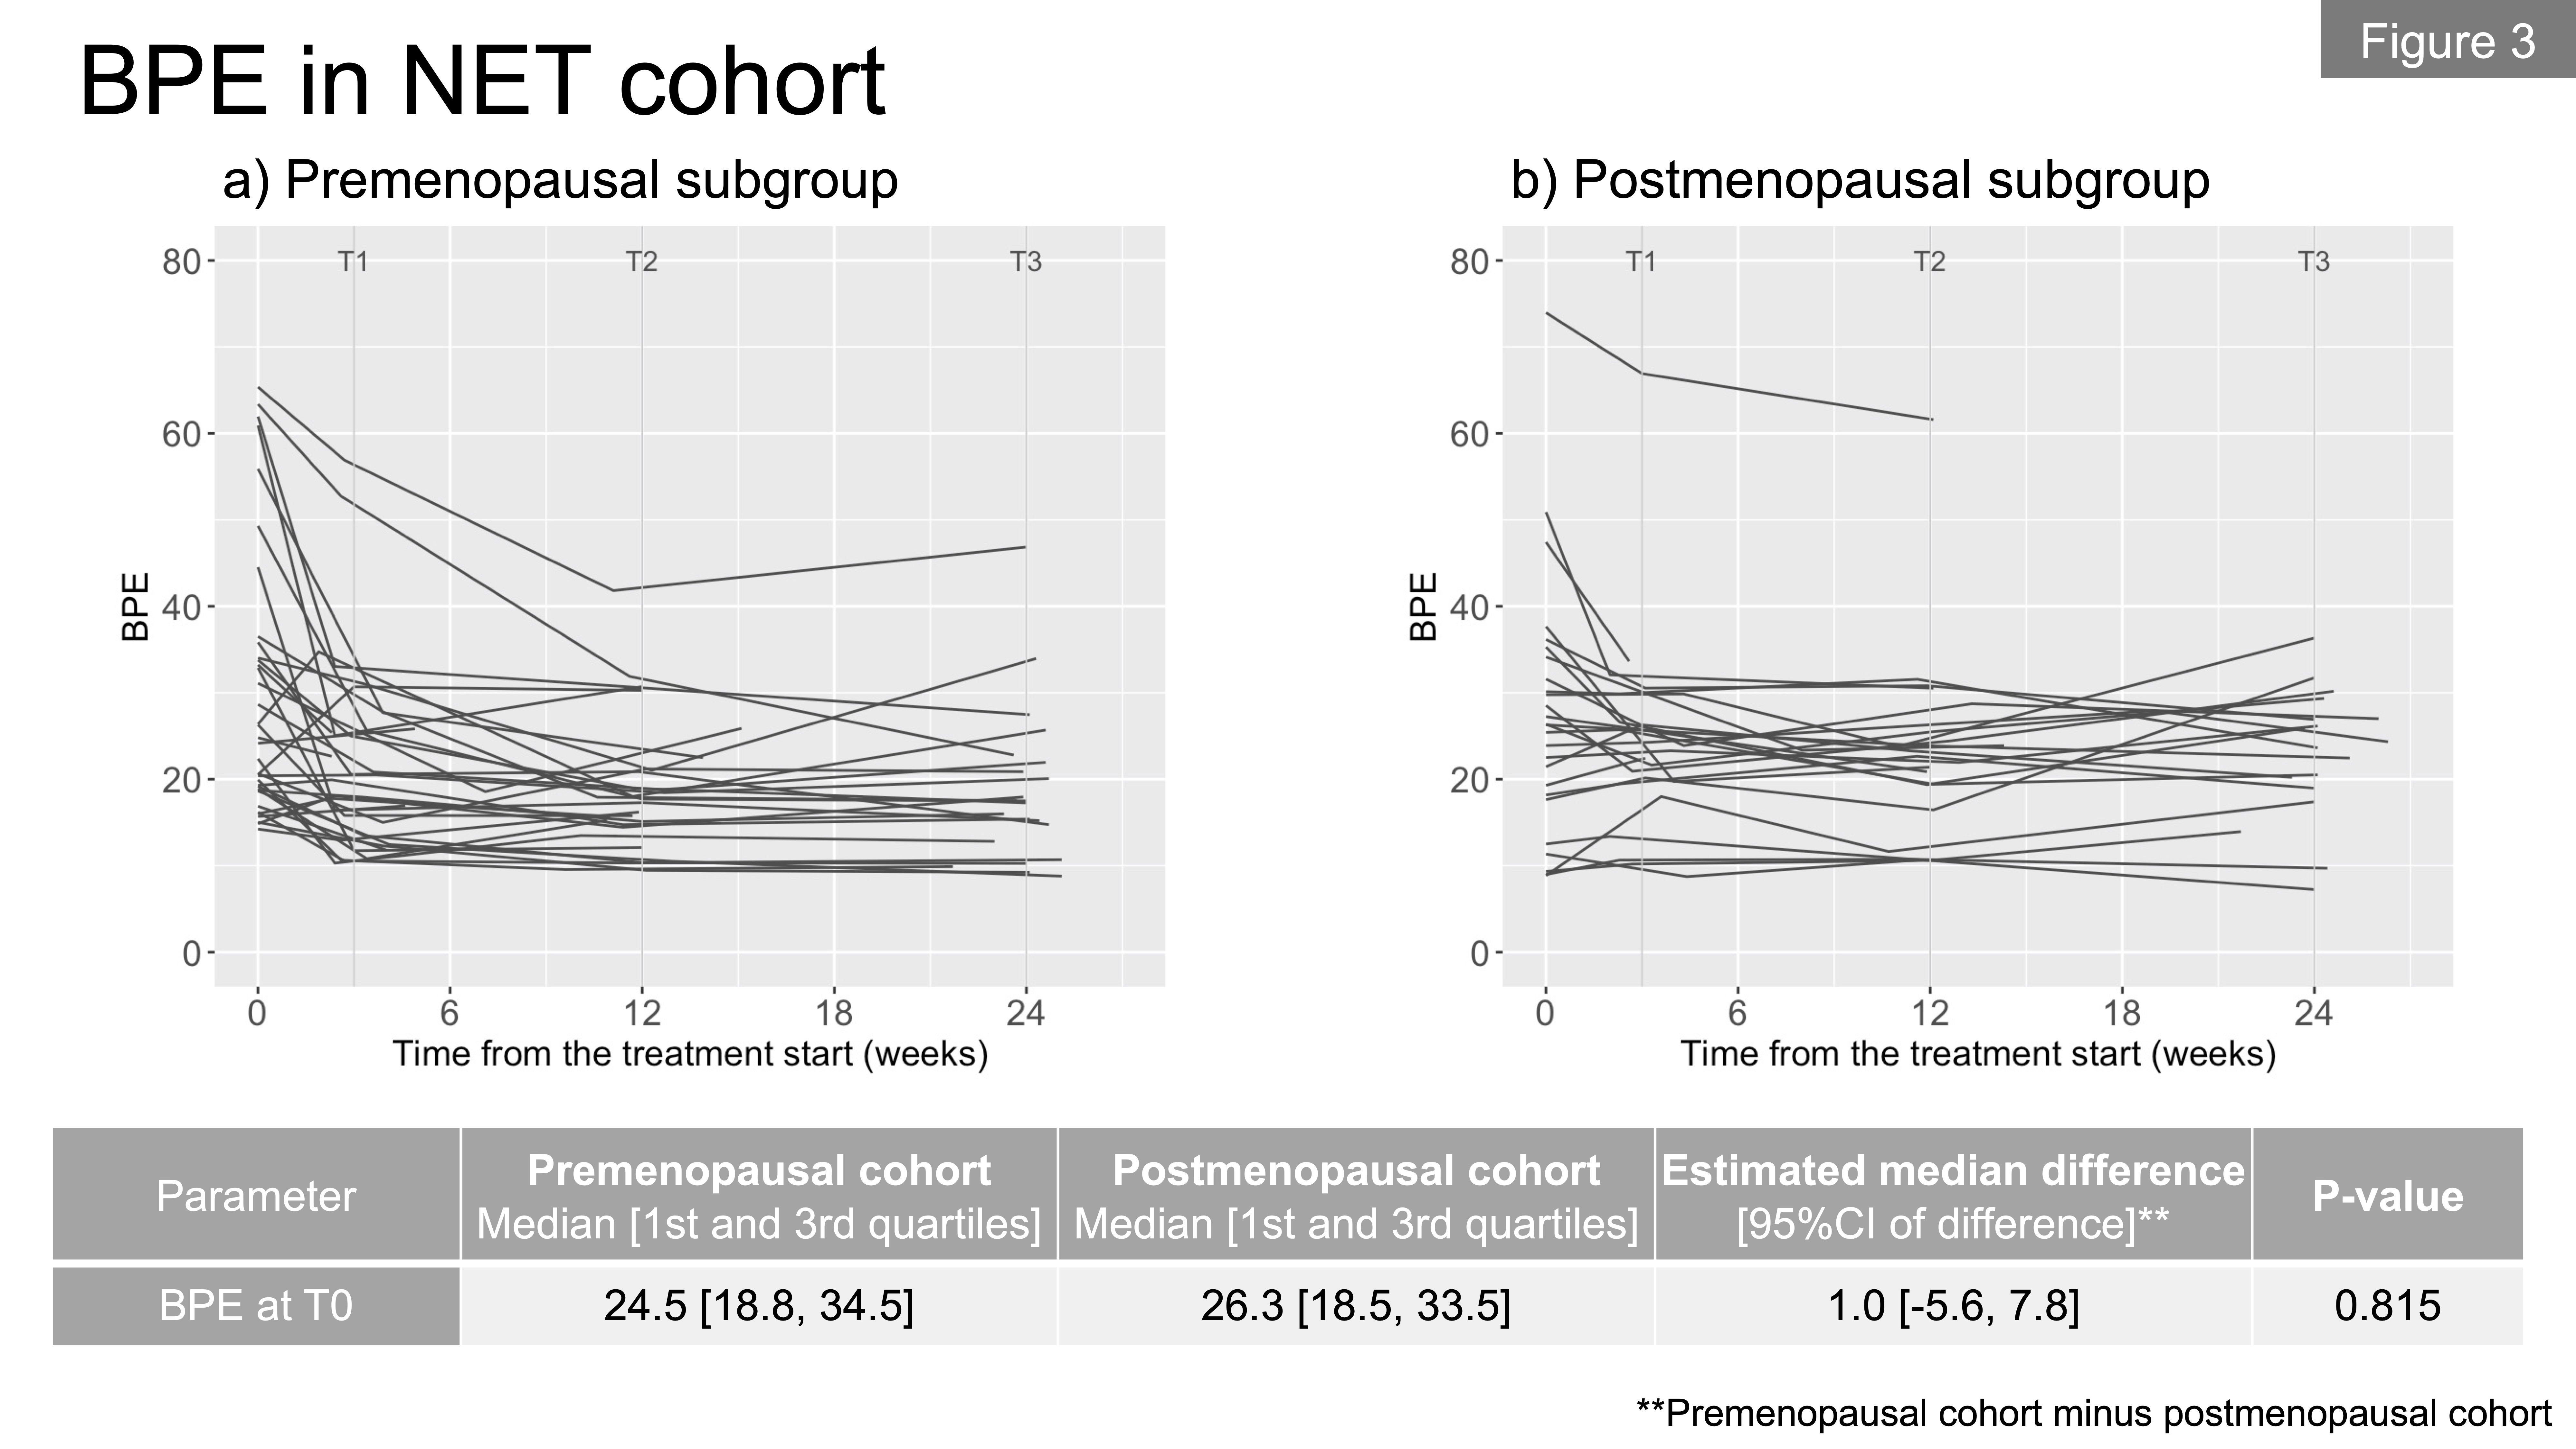
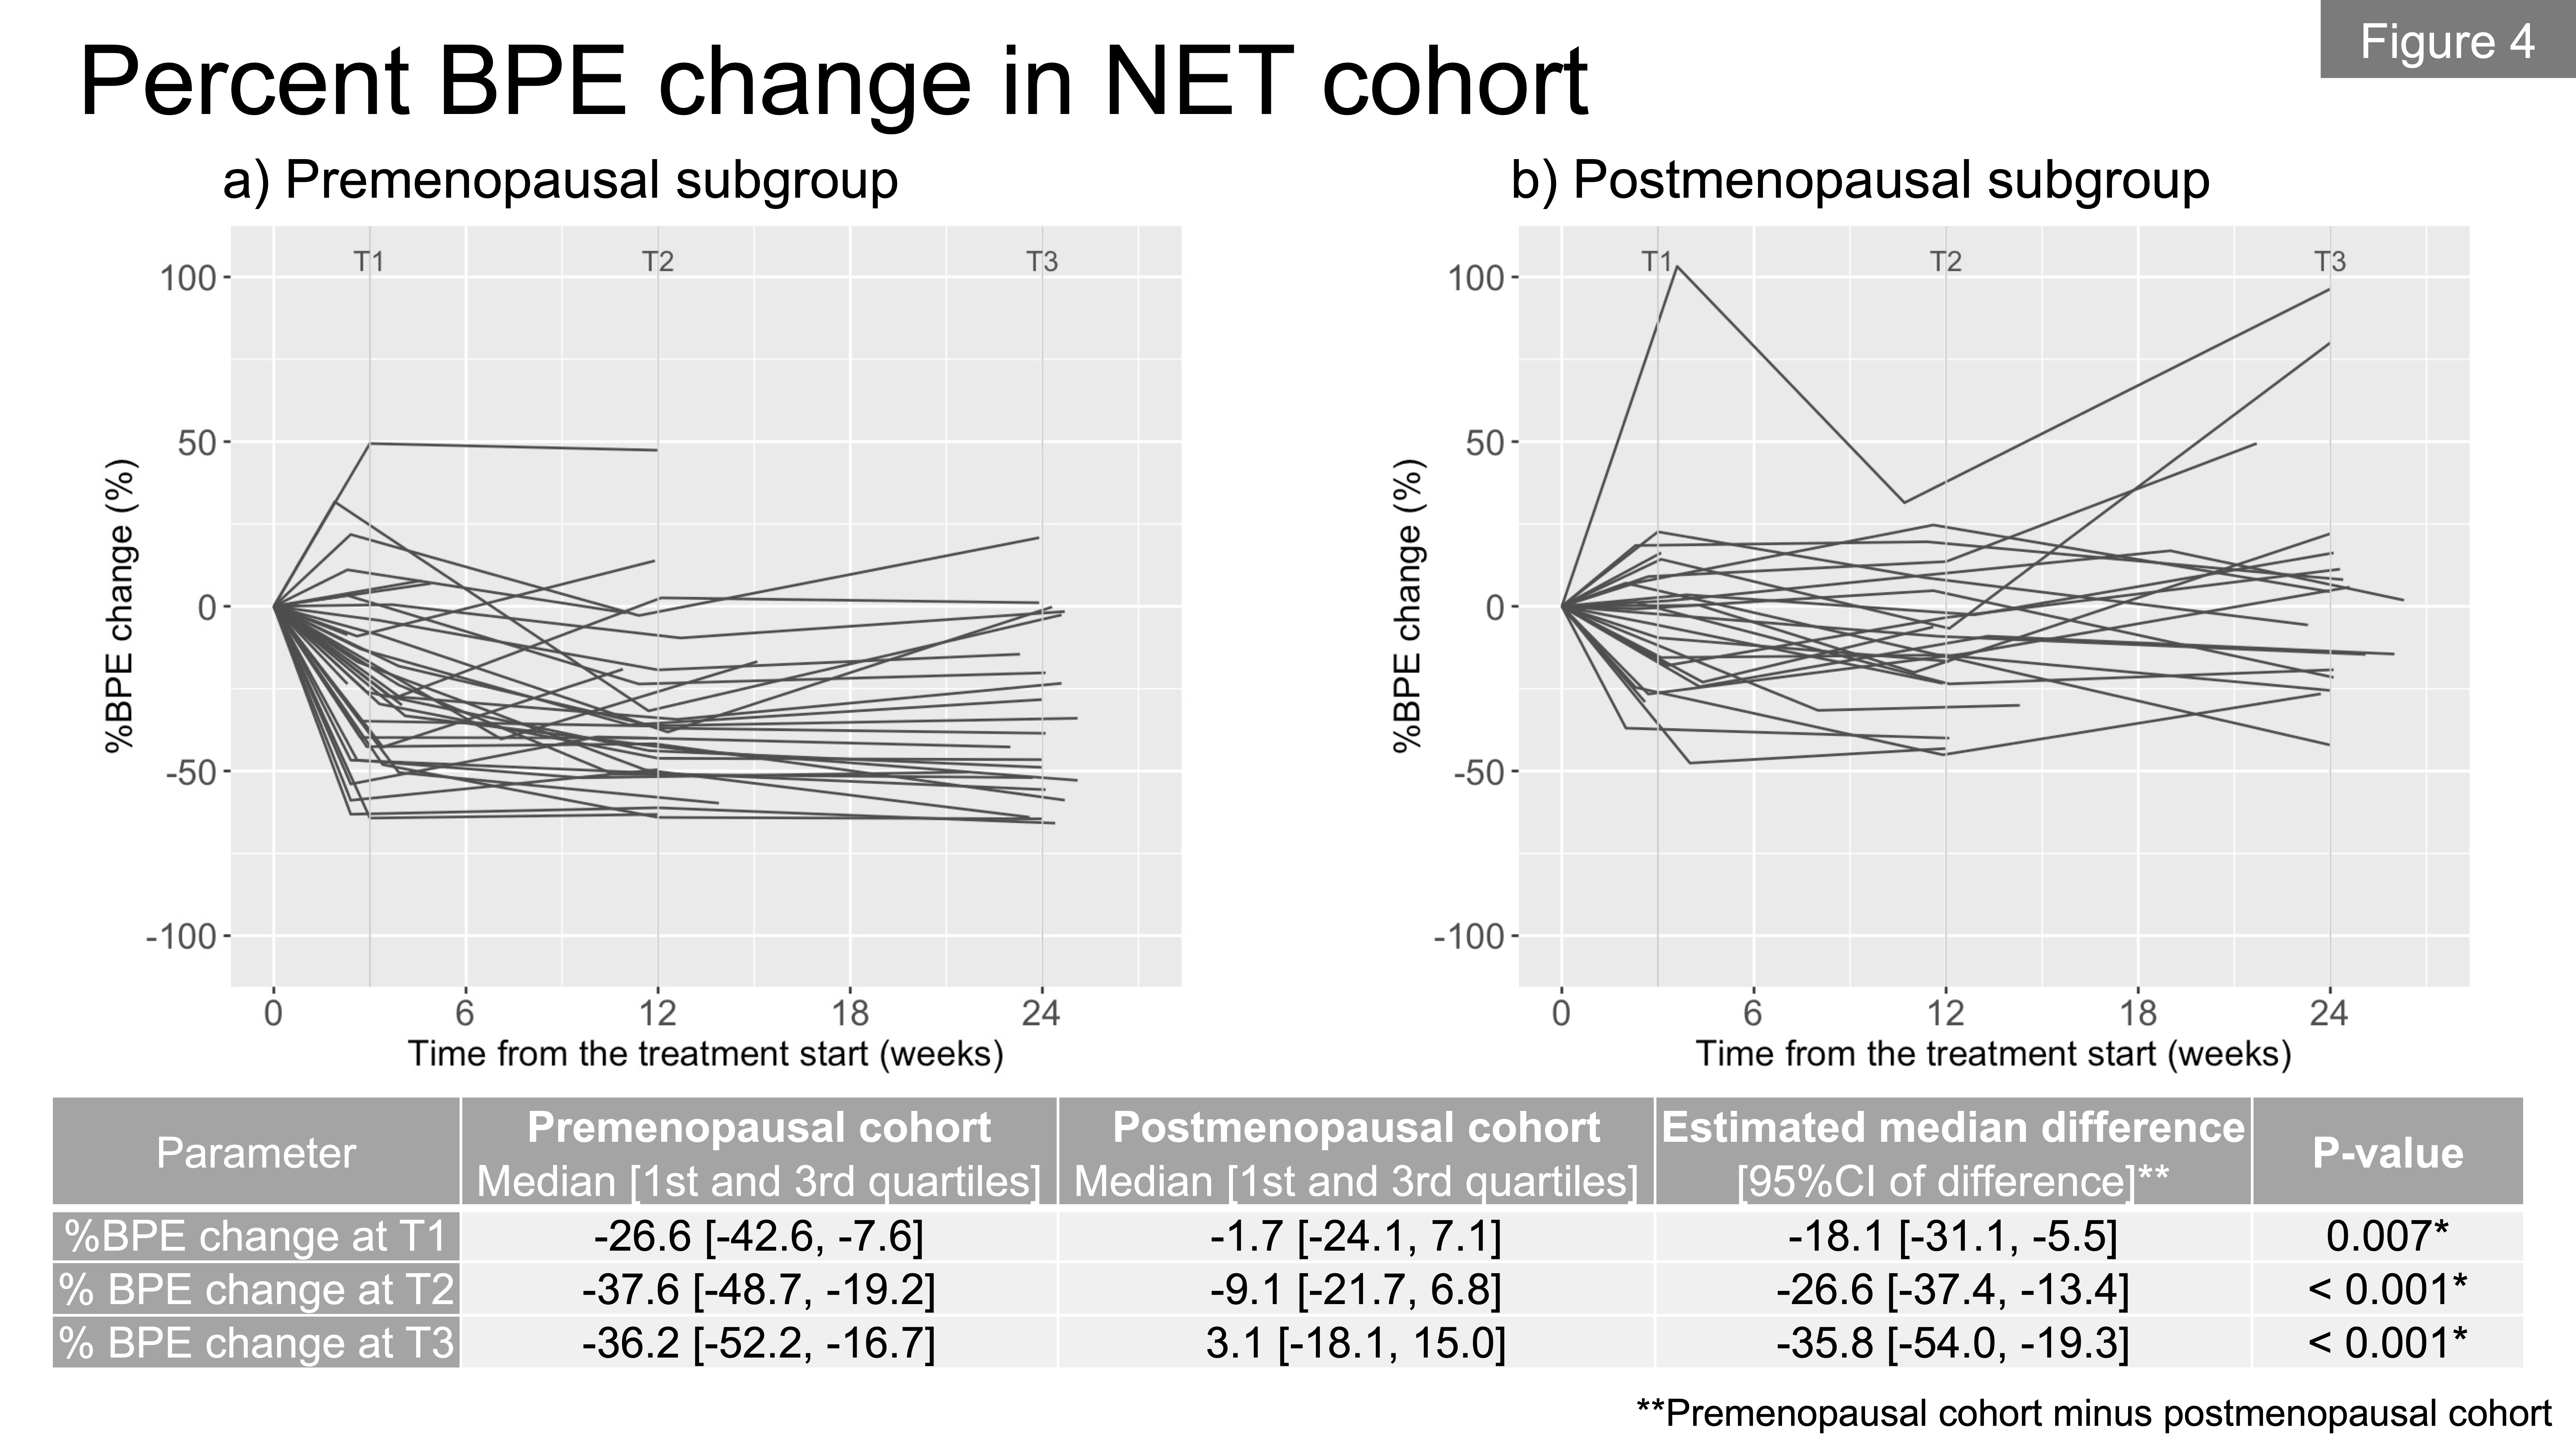
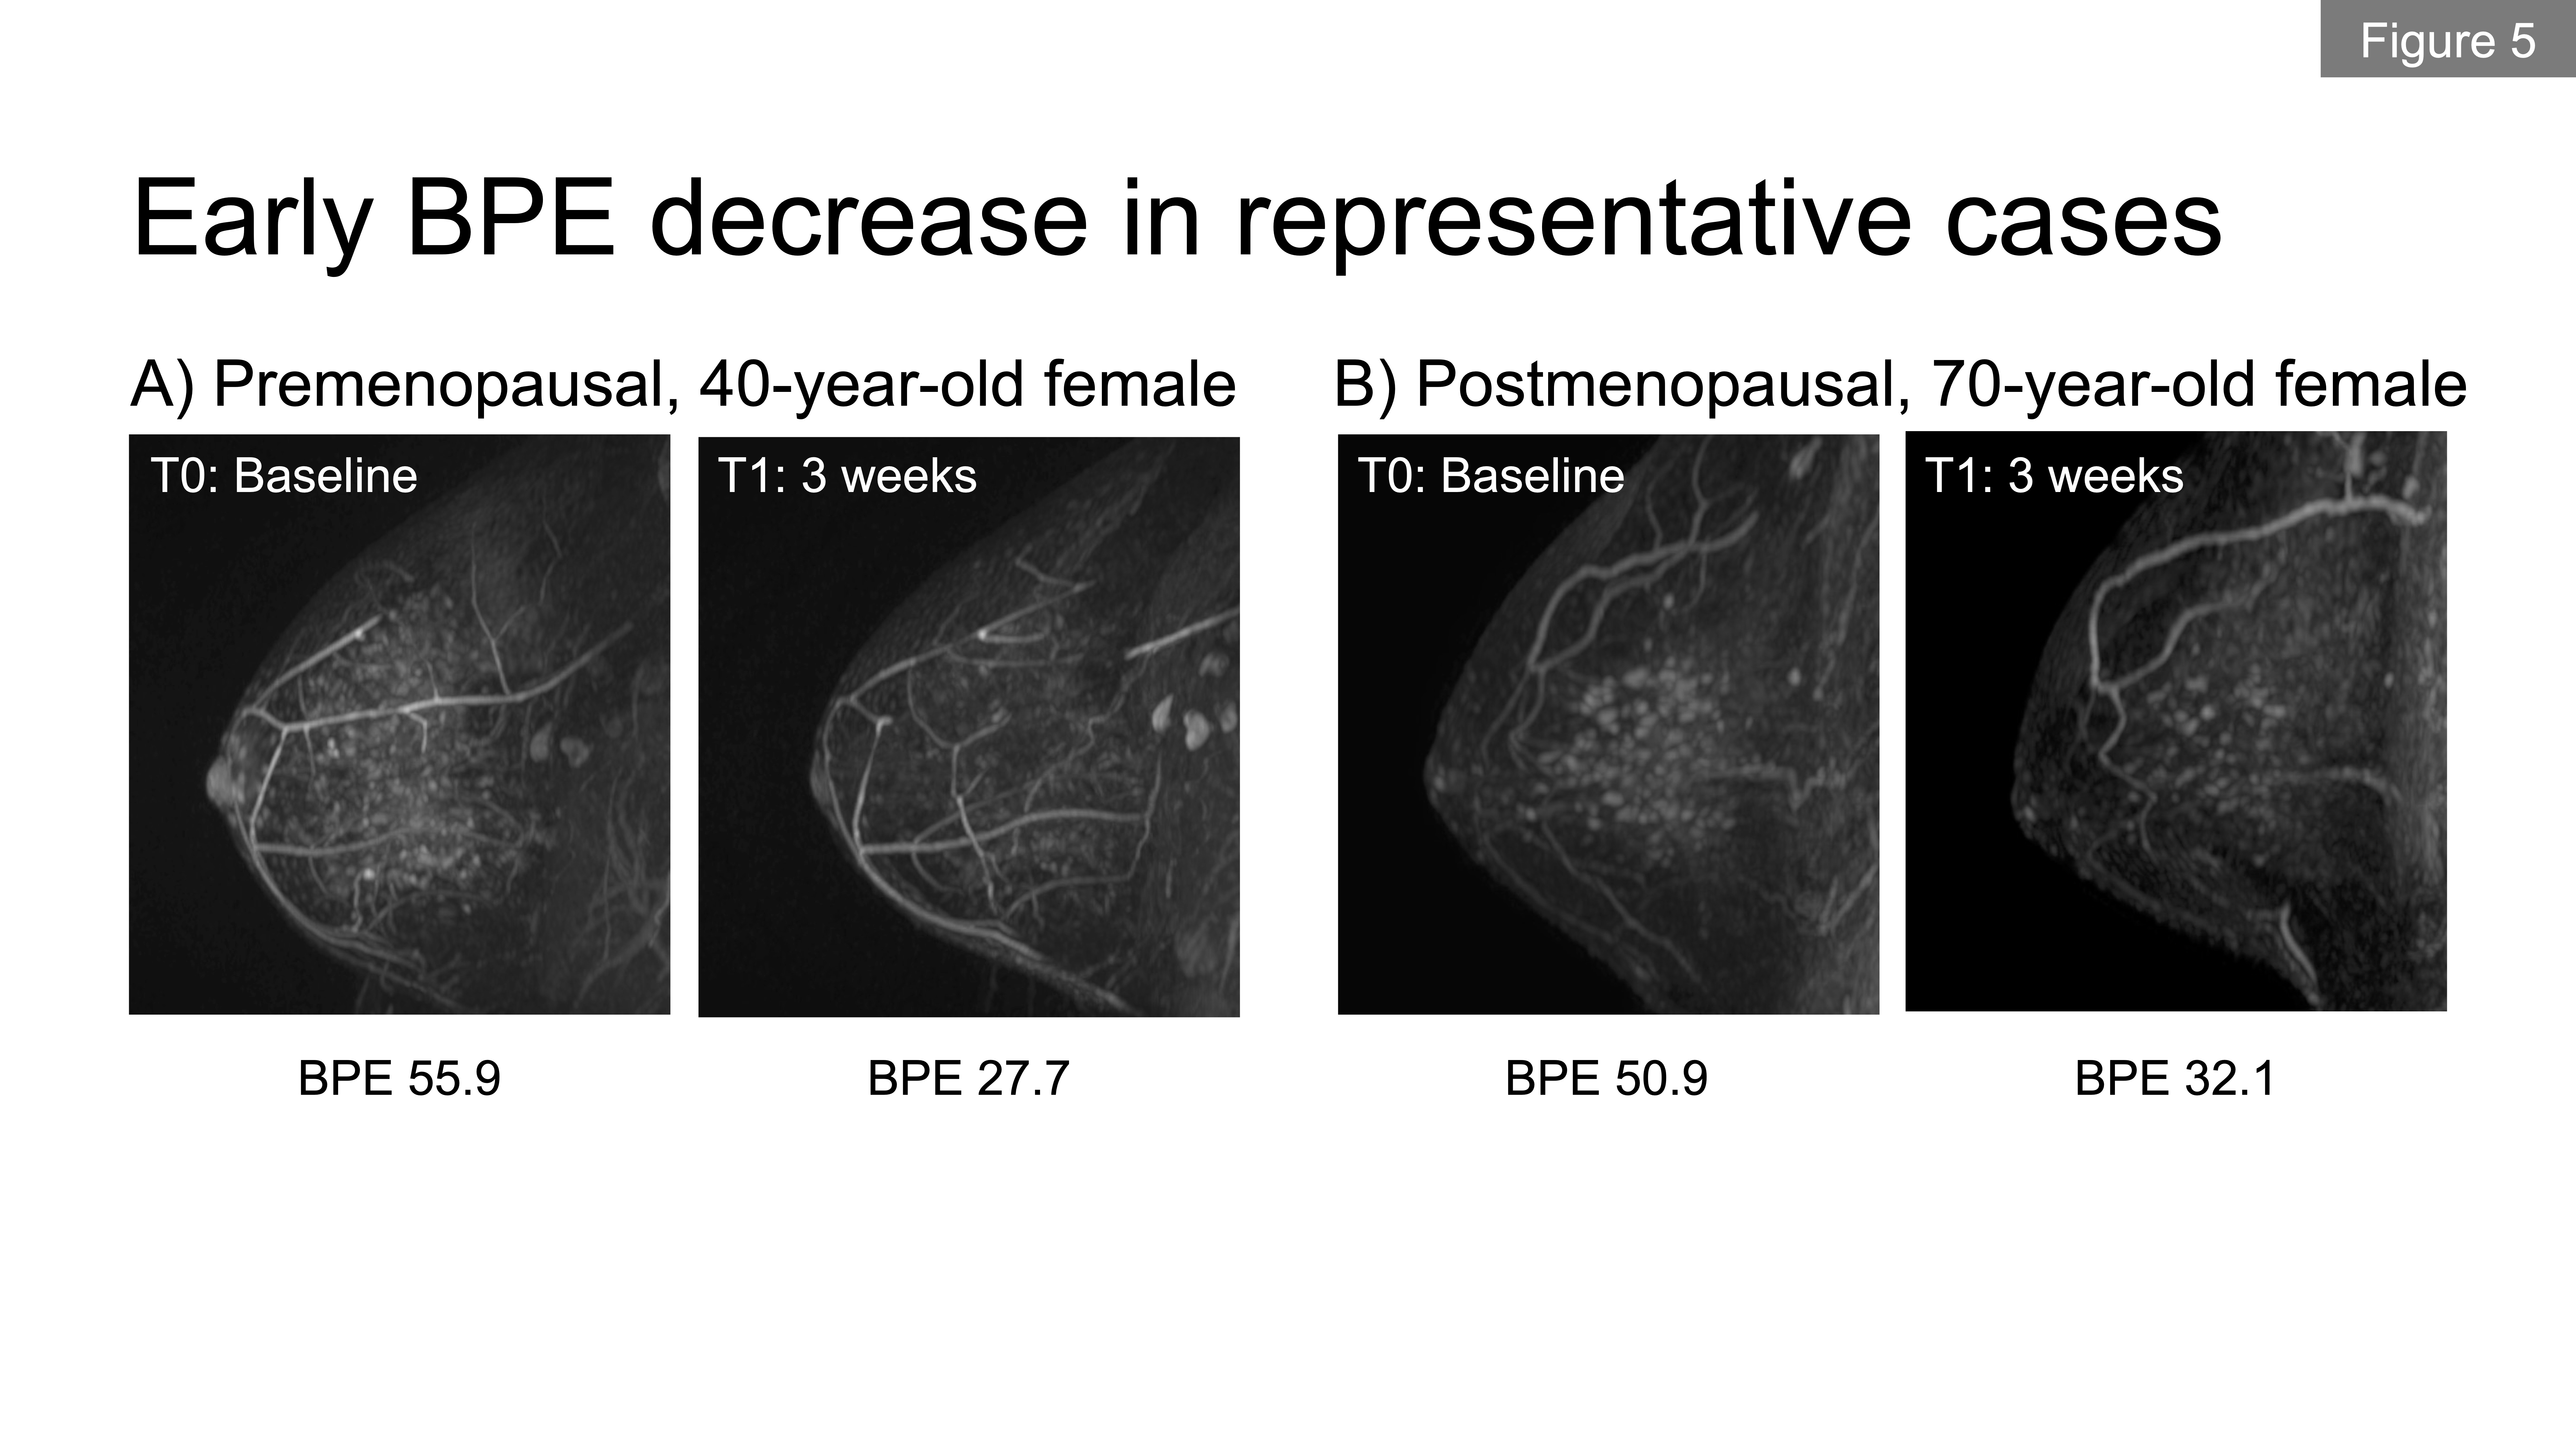
In total, we included 62 patients (premenopausal, n=36; postmenopausal, n=26) in the NET cohort and 68 patients in the NAC cohort. Figures 1a and 1b show the longitudinal percent change in FTV for each cohort. At T1, median FTV change was similar in the NET and NAC cohorts. At T2 and T3, a more gradual response was observed for the NET cohort compared to the NAC cohort. Figures 2a and 2b show the longitudinal percent change in BPE for each cohort. In both cohorts, the majority of patients showed decrease in BPE over time. Both cohorts tended to show decrease in BPE at T1, followed by a relatively more modest change in BPE at T2 and T3.Figures 3a and 3b show the longitudinal BPE in the premenopausal and postmenopausal subgroups of the NET cohort. The median [1st and 3rd quartile] of baseline BPE was 24.5 [18.8, 34.5] for the premenopausal cohort and 26.3 [18.5, 33.5] for the postmenopausal cohort. There was no statistically significant difference in baseline BPE between the two cohorts (P = 0.815). In the premenopausal subgroup, patients with higher baseline BPE tended to show early BPE decrease at T1, followed by a modest change at T2 and T3. In the comparison of percent BPE change between pre- and postmenopausal subgroups (Figure 4a and 4b), the premenopausal subgroup showed statistically significantly larger decrease in BPE than the postmenopausal subgroup for all time points: T1, -26.6% vs. -1.7% (P = 0.01); T2, -37.6% vs. -9.1% (P <0.001); T3, -36.2% vs. 3.1% (P <0.001). Early BPE decreases in representative patients are shown in Figure 5.
Discussion & Conclusion
We investigated longitudinal FTV and BPE changes during NET. Similar to the NAC cohort, the NET cohort showed early change in FTV and BPE as early as three weeks of treatment. In the NET cohort, early BPE decrease was prominent especially for patients with higher baseline BPE. Premenopausal patients showed larger decrease in BPE than postmenopausal patients. Our results illustrate the potential of FTV and BPE as imaging biomarkers for NET. The results highlight the importance of analyzing the longitudinal change in BPE during NET by menopausal status. Future work will investigate the potential of MRI-based imaging biomarkers for use in treatment redirection strategies utilizing NET.Acknowledgements
This work was supported by NIH U01 CA225427, NIH R01 CA132870, and NIH P01 CA210961.References
1. Spring LM, Gupta A, Reynolds KL, et al. Neoadjuvant Endocrine Therapy for Estrogen Receptor-Positive Breast Cancer: A Systematic Review and Meta-analysis. JAMA Oncol 2016; 2: 1477–86.
2. Korde LA, Somerfield MR, Carey LA, et al. Neoadjuvant chemotherapy, endocrine therapy, and targeted therapy for breast cancer: ASCO guideline. J Clin Oncol 2021; 39: 1485–505.
3. Hylton NM, Blume JD, Bernreuter WK, et al. Locally advanced breast cancer: MR imaging for prediction of response to neoadjuvant chemotherapy--results from ACRIN 6657/I-SPY TRIAL. Radiology 2012; 263: 663–72.
4. Hylton NM, Gatsonis CA, Rosen MA, et al. Neoadjuvant Chemotherapy for Breast Cancer: Functional Tumor Volume by MR Imaging Predicts Recurrence-free Survival-Results from the ACRIN 6657/CALGB 150007 I-SPY 1 TRIAL. Radiology 2016; 279: 44–55.
5. Li W, Newitt DC, Gibbs J, et al. Predicting breast cancer response to neoadjuvant treatment using multi-feature MRI: results from the I-SPY 2 TRIAL. NPJ Breast Cancer 2020; 6: 63.
6. Onishi N, Li W, Newitt DC, et al. Breast MRI during Neoadjuvant Chemotherapy: Lack of Background Parenchymal Enhancement Suppression and Inferior Treatment Response. Radiology 2021; 301: 295–308.
7. Giess CS, Yeh ED, Raza S, Birdwell RL. Background parenchymal enhancement at breast MR imaging: normal patterns, diagnostic challenges, and potential for false-positive and false-negative interpretation. Radiographics 2014; 34: 234–47.
8. King V, Goldfarb SB, Brooks JD, et al. Effect of aromatase inhibitors on background parenchymal enhancement and amount of fibroglandular tissue at breast MR imaging. Radiology 2012; 264: 670–8.
9. King V, Kaplan J, Pike MC, et al. Impact of tamoxifen on amount of fibroglandular tissue, background parenchymal enhancement, and cysts on breast magnetic resonance imaging. Breast J 2012; 18: 527–34.
10. Schrading S, Schild H, Kühr M, Kuhl C. Effects of tamoxifen and aromatase inhibitors on breast tissue enhancement in dynamic contrast-enhanced breast MR imaging: a longitudinal intraindividual cohort study. Radiology 2014; 271: 45–55.
11. Esserman LJ. Personalization of treatment is the way forward in care and trials. Clin Cancer Res 2020; published online April 7. DOI:10.1158/1078-0432.CCR-20-0604.
Figures