3454
The diagnostic value of synthetic MRI in ovarian epithelial cell neoplasms and its correlation with Ki-67 expression: a preliminary study1Department of Radiology, the third affiliated Hospital of Zhengzhou University, Zhengzhou, China, 2Office of Scientific Research, the third affiliated Hospital of Zhengzhou University, Zhengzhou, China, 3MR Research China, GE Healthcare, Beijing, China
Synopsis
Keywords: Pelvis, Quantitative Imaging
This study aimed to evaluate the diagnostic value of synthetic MRI in ovarian epithelial cell neoplasms and to explore the correlation between the quantitative parameters like T1, T2, and proton density derived from synthetic MRI and Ki-67 expression. Our preliminary study shows that the values of these quantitative parameters were significantly lower in the malignant group than in the benign group, and the parameters were negatively correlated with Ki-67 expression, which can indirectly reflect the degree of tumor invasion.
Background
Ovarian epithelial cell neoplasms are the most common ovarian tumors, which can be classified into benign, borderline, and malignant tumors according to histological manifestations [1]. The typical malignant type such as ovarian cystadenocarcinoma (OCAC) has a poor prognosis and low survival rate, whereas typical benign type such as ovarian cystadenoma (OCA) are usually with a good prognosis. Early detection of OCAC is the key to reduce morbidity and mortality of ovarian cancer, and preoperative identification of ovarian tumor aggressiveness is crucial for the choice of treatment and the improvement of prognosis [2]. In clinical practice, Ki-67 is mainly used to label cells in the proliferation cycle and used as a reliable marker of the proliferation activity of tumor cells. As a new MRI inspection technique in recent years, synthetic MRI (syMRI), based on a multiple-delay multiple-echo (MDME) sequence, can be used to obtain quantitative T1, T2, and PD maps at one scan, as well as different weighted images with preferable reproducibility. The present study aimed to investigate the difference of quantitative values between OCAC patients and OCA patients based on syMRI technology, and the correlation between quantitative values and Ki-67 expression.Methods
The institutional ethics committee approved this study. In this study, borderline lesions were regarded as the malignant [3]. If bilateral adnexal tumors were present, lesions on each side were all included in the analysis. Finally,30patients (mean age,43.70±15.94years; age range,14-80 years) with 33 lesions were included in this study. All the images were obtained on a 3.0 Tesla MRI system (SIGNA Pioneer, GE Healthcare, Waukesha, WI, USA) with a 18-channel body phased array coil in the supine position. The acquisition of syMRI sequence was performed both before and after administration of a contrast agent. The scan parameters were as follows: TR = 4000 ms, dual TE = 16.1 ms / 88.8 ms, layer thickness = 5 mm, FOV = 36 cm × 36 cm, echo-train length = 16 ms, bandwidth = 236.8 Hz/pixel, and scanning time = 5min. The values of T1, T2 and PD in the delineated region of interest (ROI)s were measured and expressed as T1pre, T2pre, PDpre, T1post, T2post, and PDpost, respectively.The independent sample t-test, Mann-Whitney U test, Pearson’s chi-square test, Fisher’s exact test, Spearman or Pearson’s correlation and receiver operating characteristic (ROC) were used for statistical analyses.
Results
According to univariate analysis, the T1pre, T2pre, PDpre, T1post, T2post, and PDpost in the OCA group were significantly higher than those in the OCAC group (p < 0.05), as shown in Figure 1.Parameter T1pre, T1post, T2pre, T2post and PDpost were all negatively correlated with Ki-67 proliferation index (r = -0.3721,-0.7154,-0.6662,-0.6872,-0.4169, respectively, p < 0.05), while there was no significant correlation between PDpre and Ki-67 proliferation index (r = -0.3157, p > 0.05), as shown in Figure.2.The ROC analysis showed that areas under the curve (AUC)s of these quantitative parameter ranged from 0.754 to 0.915 in differentiing OCA and OCAC. And T2post had the highest AUC of 0.915 and the best accuracy in distinguishing the two groups, as shown in Figure 3.
Conclusions
In conclusion, our study demonstrated that syMRI can assist in the differentiation diagnosis of OCAC and OCA, and there was significant negative correlations between quantitative parameters and Ki-67 expression. The quantitative T1, T2 and PD mapping have the potential to be reliable imaging markers in reflecting Ki-67 expression of ovarian tumors and provides information for preoperative prediction of ovarian tumor invasiveness.Acknowledgements
We would like to extend the gratitude and acknowledgements to all study participants.
References
[1] Taylor E C, Irshaid L, Mathur M. Multimodality imaging approach to ovarian neoplasms with pathologic correlation. Radiographics,2021:289-315.
[2] Li H, Lu J, Deng L, et al. Diffusion‐Weighted Magnetic Resonance Imaging and Morphological Characteristics Evaluation for Outcome Prediction of Primary Debulking Surgery for Advanced High‐Grade Serous Ovarian Carcinoma. J Magn Reson Imaging,2022.
[3] Wengert G, Dabi Y, Kermarrec E, et al. O-RADS MRI Classification of Indeterminate Adnexal Lesions: Time-Intensity Curve Analysis Is Better Than Visual Assessment. Radiology,2022;303:567-575.
Figures
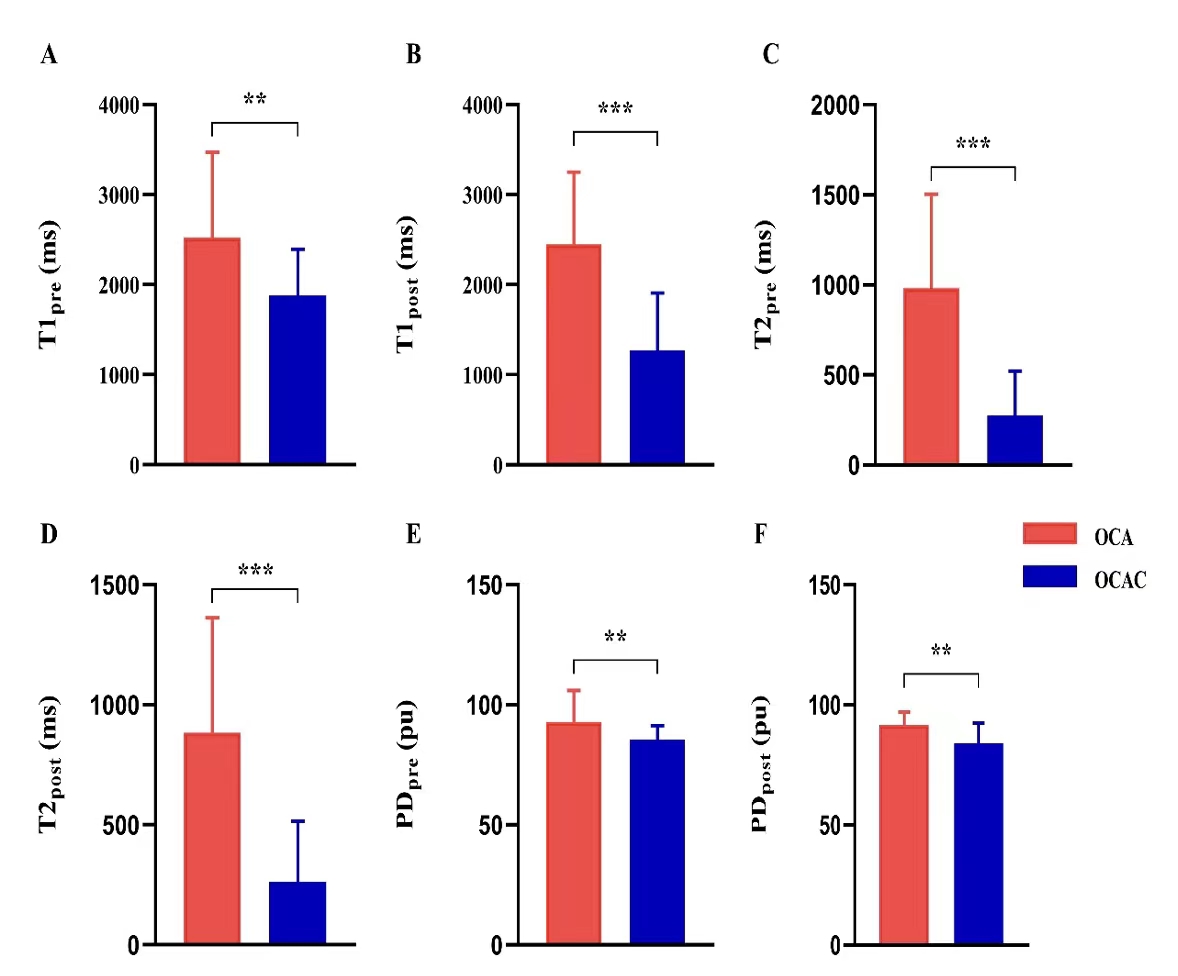
Figure 1. Comparison of the values of quantitative parameters derived from syMRI between OCA (n=14, red bar) and OCAC (n=16, blue bar) group. (A) T1pre values ; (B) T1post values ; (C) T2pre values ; (D) T2post values ; (E) PDpre values ; (F) PDpost values .** : P values < 0.05 ; *** : P values < 0.001. Longitudinal relaxation time, T1; Transverse relaxation time, T2; Proton density, PD; pre, pre-contrast; post, post-contrast. OCA, ovarian cystadenoma; OCAC, ovarian cystadenocarcinoma.
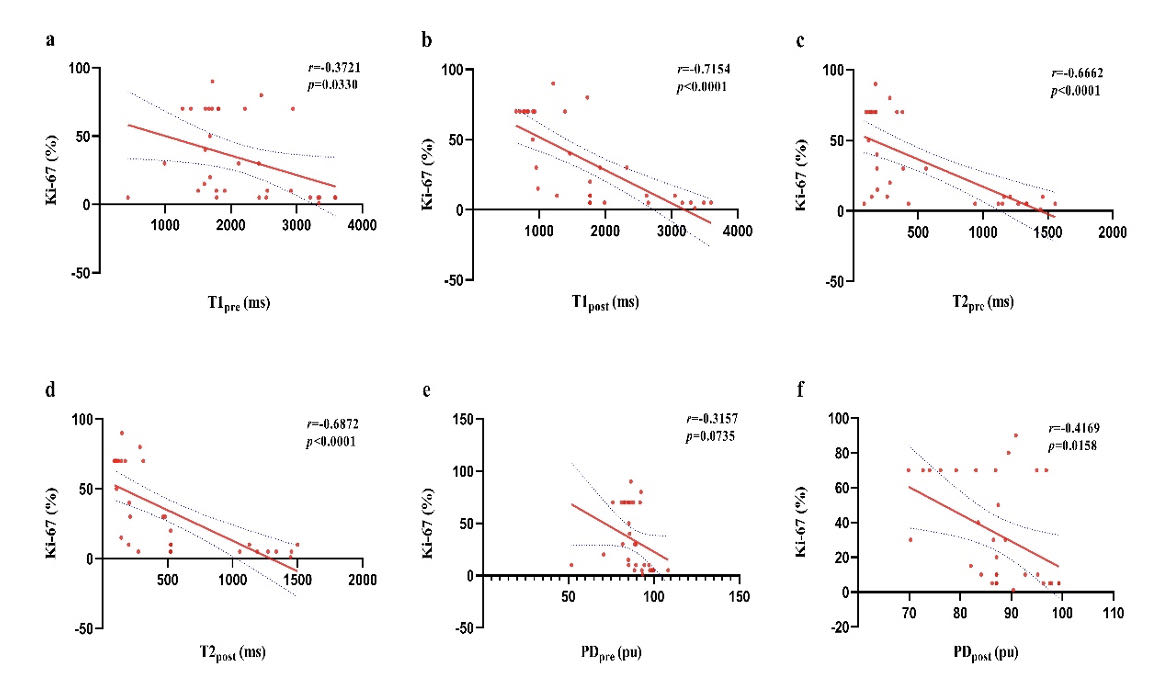
Figure 2. Scatter plot shows the correlation between the quantitative parameters derived from syMRI and Ki-67 proliferation index in ovarian cystadenocarcinoma and ovarian cystadenoma diseases. (a) T1pre values ; (b) T1post values ; (c) T2pre values ; (d) T2post values ; (e) PDpre values ; (f) PDpost values . Longitudinal relaxation time, T1; Transverse relaxation time, T2; Proton density, PD; pre, pre-contrast; post, post-contrast; r, correlation coefficient; p values < 0.05 were considered statistically significant.

Figure 3. ROC analyses of the quantitative parameters T1pre, T1post, T2pre, T2post, PDpre, PDpost in differentiating between ovarian cystadenocarcinoma and ovarian cystadenoma. pre, pre-contrast; post, post-contrast.