3452
Preliminary Application performance of synthetic MRI quantitative imaging in stage I endometrial cancer1Medical Imaging, Affiliated Hospital of Jiangnan University, Wuxi, China, 2GE Healthcare, Beijing, China
Synopsis
Keywords: Pelvis, Cancer
The purpose of this study was to investigate the feasibility of using synthetic MRI to identify and differentiate stage I endometrial cancer. A total of 51 patients with endometrial carcinoma were recruited. Quantitative MRI, including T1, T2 and PD mapping were used. The endometrial carcinoma had significantly different T1, T2 and PD values compared to normal uterus tissue, therefore quantitative MRI is an effective method for detection of endometrial cancer. There was no statistical difference of synthetic MRI in differentiation grades or risk stratification, which needs to be further verified.
Abstract category
bodyKeyword
Endometrial carcinoma, synthetic MRI, quantitative imagingAbstract
IntroductionEndometrial cancer is the most common malignant tumor in the female reproductive system in developed countries, and the second most common malignant tumor in the female reproductive system in China [1]. Since endometrial cancer is mainly treated by operation, therefore accurate preoperative detection and staging are crucial when determining a treatment plan.
The International Federation of Gynecology and Obstetrics (FIGO) states that MRI is the most accurate medical imaging examination method for clinical staging and prognosis evaluation of endometrial cancer patients[2].
Synthetic MRI is more widely used in the central nervous system[3-4] and other solid tumors[5-7], and showed quite important clinical applications from different dimensions. We assumed that it might have the potential to diagnose endometrial carcinoma.
Therefore, this study aimed to investigate the feasibility of synthetic MRI quantitative imaging in detecting and differentiating stage I endometrial cancer by measuring relaxation properties.
Materials and Methods
Subjects
A total of 51 patients (mean age 52 years ranging from 28 to 80) with clinically suspected endometrial cancer were recruited in the study. According to postoperative pathological results, the patients were divided into confirmed stage IA (41 cases) (Figure1) and stage IB (10 cases) groups; also, 17 cases, 27 cases, and 7 cases were divided into the high-, medium- and poorly-differentiated groups, respectively, and 34 cases in the low-risk, 6 cases in the medium-risk, and 11 cases in the high-risk groups, respectively. Patients were also divided into menopausal and non-menopausal groups.
MRI imaging
A 3.0T MR scanner (GE Medical Systems, SIGNA Architect) with 16-channel phased-array body coil was used for all subjects. Patients were given enemas before the examination to clean their intestines, and Racanisodamine (Hangzhou, Minsheng Pharmaceutical Co. LTD) 10 mg intramuscular injection was routinely administered before the scan. Magnetic resonance imaging compilation (MAGIC) sequence was used for T1,T2 and PD mapping measurements. Other scan parameters are presented in Table 1.
Data analysis
All MRI data were post-processed using vendor-provided software on GE ADW4.7 workstation. The image quality and lesions display of synthetic T2WI were compared with that of high resolution T2WI (HR DWI) by two observers. The corresponding T1, T2 and PD values of the lesion, endometrium, superficial myometrium, deep myometrium, and cervical stroma were obtained for each patient. The mean value of each metric was obtained for further analysis.
Statistical analysis
SPSS 18.0 and Medcalc 20.0 softwares were used for statistical analysis. The Kendall’s tau-b correlation coefficient test was used for inter-observer consistency. The T1, T2 and PD values of the tumor were compared with those of the endometrium, superficial myometrium, deep myometrium, and cervical stroma using ANOVA; The Mann-Whitney U test was used to compare T1, T2 and PD values among high, medium and low differentiation groups, and to measure T1, T2 and PD values between the low-risk and medium-high risk groups. The ROC curve was drawn, and the appropriate critical value was calculated. The paired sample t-test was used to evaluate the image quality between observers on synthetic T2WI. The chi-squared test was applied to compare the detection and staging of lesions on HR T2WI and synthetic T2WI images. The T1, T2 and PD values of the postmenopausal and non-postmenopausal groups were compared using unpaired samples t-test.
Results
The T1, T2, PD values of the tumor, endometrium, superficial myometrium, deep myometrium, and cervical stroma were 1456.45 ms, 2180.60 ms, 1008.83 ms, 1207.38 ms, and 907.80 ms; 96.35 ms, 164.50 ms, 60.99 ms, 74.14 ms, 53.18ms; 80.76ms, 89.06ms, 65.76ms, 72.19ms, 72.19ms, respectively[1] (Figure2). There was significant differences between the T1, T2 and PD values of the tumor, and those of the endometrium, superficial myometrium, deep myometrium, and cervical stroma (all P values < 0.05) (Table2). The difference between endometrial cancer and cervical stroma showed the highest efficacy in diagnosing endometrial cancer, with the area under the curve (AUC) of T1, T2 and PD values being 0.9627, 0.9894, and 0.9368, respectively (Figure 3). Two observers showed obvious correlation on image quality scores (K=0.651 and 0.621, P values were < 0.001) and lesion display between synthetic T2WI and HR T2WI (K= 0.660 and 0.521, P values were < 0.001), respectively. There was no significant difference in T1, T2 and PD values among high, medium, and low differentiation groups, between low risk and medium-high risk groups, and between IA and IB groups (all P values > 0.05). For the menopausal and non-menopausal groups, there was a statistically significant difference between the T2 value of the tumor (P=0.045). The T1 and PD values of the tumor, along with the T1, T2 and PD values of the normal endometrium, superficial myometrium, deep myometrium, and cervical stroma all showed no statistically significant difference.
Discussion and Conclusions
This study demonstrates the feasibility of the application of synthetic MRI quantitative technique in endometrial cancer cases, with the cervical stroma as the reference standard, producing the highest diagnostic efficacy. The value of synthetic MRI in grade and risk stratification must be further verified.
Acknowledgements
No acknowledgement found.References
[1]Amant F, Moerman P, Neven P, Timmerman, D, Van Limbergen, E, and Vergote, I. Endometrial cancer. Lancet, 2005;366:491–505.
[2] Bhatla N, Denny L.FIGO Cancer Report 2018. Int J Gynaecol Obstet, 2018;143(Suppl 2):2-3.
European Radiology, 2019;29(2):792-805.https:// doi.org/10.1007/s00330-018-5515-y.
[3] Krauss WF, Gunnarsson M, Nilsson M, Warntjes M, Kamagata K, Fukunaga I, Goto M, Takuya H, Takasu K, Andica C, Maekawa T, Takemura MY, Irie R, Wada A, Suzuki M, Aok S. Conventional and synthetic MRI in multiple sclerosis: a comparative study. Eur Radiol ,2018;28(4):1692–1700.
[4] Fujita S, Hagiwara A, Hori M, et al.3D Quantitative Synthetic MRI-Derived Cortical Thickness and Subcortical Brain Volumes: Scan–Rescan Repeatability and Comparison With Conventional T1-Weighted Images. J Magn Reson Imaging. 2019;50(6):1834–1842.
[5] Meng TB, He N, He HQ,Liu KY, Ke LR, Liu HM, Zhong LC, Huang CH, Yang AL, Zhou CY, Qian L, Xie CM. The diagnostic performance of quantitative mapping in breast cancer patients: a preliminary study using synthetic MRI. Cancer Imaging ,2020; 20:88.https://doi.org/10.1186/s40644-020-00365-4.
[6] Matsuda M, Tsuda T, Rui E, Toshimori W, Takeda S, Okada K,Nakasuka K, Shiraishi Y, Suekuni H, Kamei Y, Kurata M, Kitazawa R, Mochizuki T, Kido T. Enhanced Masses on contrast-Enhanced Breast: Differentiation Using a Combination of Dynamic Contrast-Enhanced MRI and Quantitative Evaluation with Synthetic MRI. J Magn Reson Imaging, 2021;53(2):381–391.
[7] Cui Y, Han S, Liu M, Wu PY, Zhang W, Zhang JT, Li CM, Chen M. Diagnosis and Grading of Prostate Cancer by Relaxation Maps From Synthetic MRI. J Magn Reson Imaging, 2020;52(2):552-64.
Figures
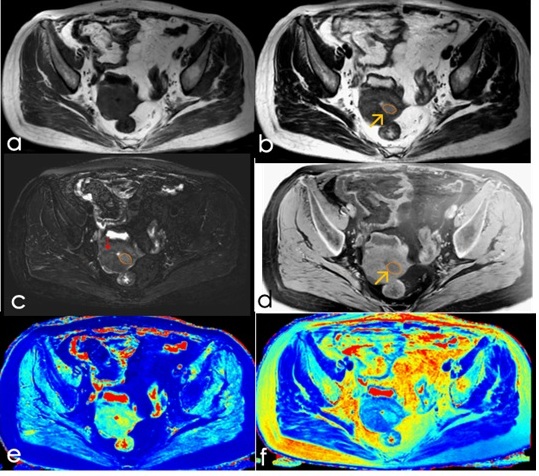
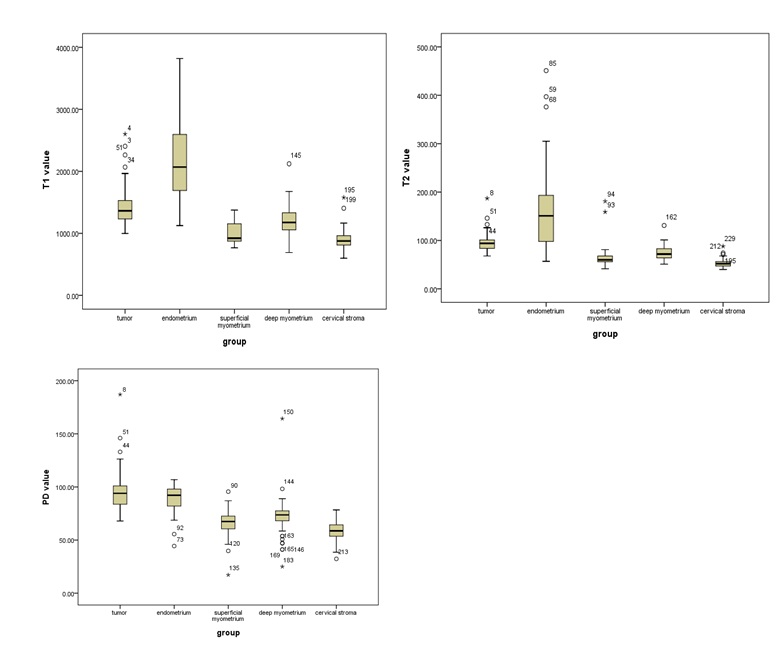
Figure2: Box plot of T1,T2 and PD value of tumor, endometrium, superfical myometrium, deep myometrium and cervical stroma.
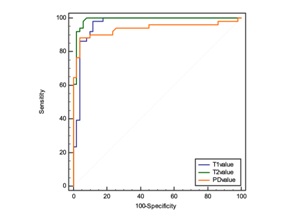
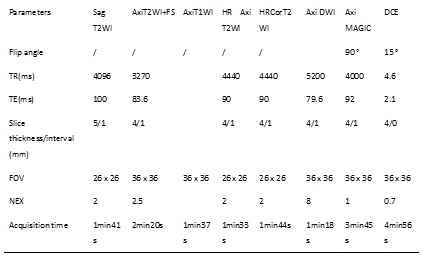
Table1: scan parameters used in the study.
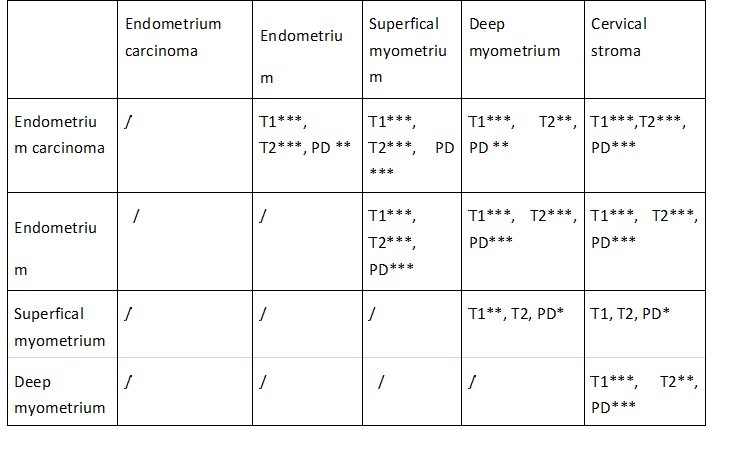
Table 2: Multiple comparisons of T1,T2,PD values using the LSD method between endometrium carcinoma and Endometrium, Supertical myometrium, Deep myometrium and Cervical stroma, * p<0.05, **p<0.01, *** p<0.001.