3448
A Multicenter Study of Cervical Cancer using Dynamic Contrast-Enhanced MRI: Are Measurements of Quantitative Imaging Reproducible in Clinic?
Xue Wang1, Shujian Li2, Zhijun Ye3, Tang-San Koh4, Zujun Hou5, Zhihan Yan1, and Lu Han6
1The Second Affiliated Hospital and Yuying Children′s Hospital of Wenzhou Medical University, Wenzhou, China, 2The First Affiliated Hospital of Zhengzhou University, Zhengzhou, China, 3The Second Affiliated Hospital of Sichuan University, Chengdu, China, 4National Cancer Center, Singapore, Singapore, Singapore, 5Suzhou Institute of Biomedical Engineering and Technology, Chinese Academy of Sciences, Suzhou, China, 6Philips Healthcare, Shanghai, Shanghai, China
1The Second Affiliated Hospital and Yuying Children′s Hospital of Wenzhou Medical University, Wenzhou, China, 2The First Affiliated Hospital of Zhengzhou University, Zhengzhou, China, 3The Second Affiliated Hospital of Sichuan University, Chengdu, China, 4National Cancer Center, Singapore, Singapore, Singapore, 5Suzhou Institute of Biomedical Engineering and Technology, Chinese Academy of Sciences, Suzhou, China, 6Philips Healthcare, Shanghai, Shanghai, China
Synopsis
Keywords: Uterus, Reproductive, Dynamic Contrast-Enhanced Imaging
By comparing the distributions of measured DCE kinetic parameters in cervical cancer tissue by three MRI scanners in different clinical centers. It was demonstrated that (i) Each of the three scanners consistently showed similar findings on the characterization of cervical cancer microenvironment. (ii) The difference in MRI3 stemmed from keyhole imaging in the DCE protocol which could lead to underestimation of concentration of contrast media in viable tumor region. (iii) The close distribution between MRI1 and MRI2 indicated that consistent DCE quantitative metrics could be attained in scanners from different vendors if imaging protocol and data postprocessing could be standardized.Introduction
As an imaging method to measure changes in tissue microvascular properties, dynamic contrast-enhanced magnetic resonance imaging (DCE-MRI) has been widely used in clinical research or clinical trials for noninvasive assessment of disease activity and therapeutic response in tumor, arthritis, and other disease 1-2. However, there was considerable variation on the findings among centers 3-4 or measured values of tissue vascularity among methods 5-6. Reproducibility of quantitative metrics in DCE between different scanners has rarely been addressed. This study attempted to verify the consistency of measured DCE-MRI perfusion parameters in cervical cancer patients using scanners from different vendors in a multicenter clinical setting.Methods
DCE data of 161 cervical cancer patients formed the study cohort, which was acquired using one of the following MRI scanners: a 3T General Electric scanner (Discovery 750, GE Healthcare, Waukesha, WI, USA), a 3T Siemens scanner (Skyra, Siemens AG, Erlangen, Germany), or a 1.5T Philips scanner (Achieva, Philips Healthcare, The Netherlands); as denoted by MR1, MR2, and MR3, respectively. The detailed protocol information was listed in Table 1. DCE images were analyzed by a computer-aided software for automated DCE data analytics (MItalytics, FITPU Healthcare). AIF was sampled in each patient from a voxel that clearly resided within the iliac artery with the highest peak value in the concentration-time curve. The data was centralized and processed using the distributed parameter (DP) model [7], yielding the following parameters: blood flow (F), permeability-surface area product (PS), fractional volume of plasma space (Vp), and fractional volume of extravascular extracellular space (Ve). The difference of parameters between cervical cancer and normal cervix tissue was assessed. Receiver operating characteristic (ROC) analysis was performed to examine the ability of each parameter in discriminating cervix tumor and normal tissue. Two-sample Kolmogorov-Smirnov test was conducted to determine whether the measurements in different scanners were sampled from the same distribution.Results
Patient characteristics were summarized in Table 2. The tissue concentration and the parameter maps of one slice of cervix cancer generated using DP method are shown in Figure 1. In each center, Ve in normal cervix tissue was significantly larger than that in cervical cancer tissue (p<0.01 for all MRI1, MRI2, and MRI3) and attained the highest performance in differential diagnosis of cervical cancer and normal cervix tissue (AUC=0.89, 0.88 and 0.74 for MRI1, MRI2, and MRI3 respectively) (Figure 2). Parameters derived from MRI3 was statistically significantly different from those of MRI1 and MRI2 in cervical cancer tissue (p<0.001 for all parameters). As shown in Table 2, the data in different centers presents variation in patient demography, and the microenvironmental features of cervical cancer tissue vary with cancer grade. Thus, for a further comparison, this subsection compared MRI1 and MRI2 using data in both centers with similar cancer grade, where there were 23 Grade II cervical cancer patient data acquired using MRI1 and 26 Grade II cervical cancer patient data acquired using MRI2. Using data of Grade II cervical cancer showed that the distributions of DCE kinetic parameters derived from MRI1 and MRI2 were not statistically significantly different in cervical cancer tissue (p>0.05 for all parameters). (Figure 3).Discussion
Multicenter studies with focus on reproducibility of DCE quantitative metrics have rarely been reported in the literature and this study compared the measured DCE kinetic parameters in cervical cancer tissue by three MRI scanners in different clinical centers. By comparing the distributions of measured DCE kinetic parameters between scanners, it was found that parameters derived from MRI3 was statistically significantly different from those of MRI1 and MRI2. Further comparison between MRI1 and MRI2 using data of Grade II cervical cancer showed that the distributions of DCE kinetic parameters derived from these two scanners were highly similar. The close distribution between MRI1 and MRI2 suggested the potential of reproducible DCE quantitative parameters using scanners from different vendors. In this multicenter study, it was found that the measured DCE metrics by MRI3 were significantly different from those by MRI1 and MRI2. The difference could be due to field strength; however, this could be addressed in the calculation of contrast media concentration. More probably, it could be attributable to the keyhole imaging technique, a special technique to accelerate the scan speed, used in the eTHRIVE sequence by MRI3. Performing keyhole imaging technique could compromise these high frequency signal content, leading to signal smoothing in the viable tumor region and possibly underestimation of tracer concentration in the corresponding voxels. Among the DCE protocols of three scanners in this study, MRI3 was the only scanner using the keyhole imaging, which could contribute largely to the marked difference with respect to other two scanners. Our future study will include to design the DCE protocol in Philips scanners without the use of keyhole imaging and investigate the reproducibility of DCE metrics with scanners from other vendors.Conclusion
The difference in MRI3 stemmed from keyhole imaging in the DCE protocol which could lead to underestimation of concentration of contrast media in viable tumor region. The close distribution between MRI1 and MRI2 demonstrated that consistent DCE quantitative metrics could be attained in scanners from different vendors if imaging protocol and data postprocessing could be standardized.Acknowledgements
The authors thank Dr Shijie Chen of MeiraGTx for his advice on statistical analysis.References
1. O’Connor JPB, Jackson A, Parker GJM, et al. Dynamic contrast-enhanced MRI in clinical trials of antivascular therapies. Nat Rev Clin Oncol 2012; 9: 167–177. doi: 10.1038/nrclinonc.2012.22. Cimmino MA, Parodi M, Barbieri F, et al. Dynamic contrast-enhanced MRI confirms rapid and sustained improvement of rheumatoid rrthritis induced by tocilizumab treatment: an Italian multicentre study. Biologics: Targets and Therapy 2020:14 13–21. doi: 10.2147/BTT.S2098733. Park YW, Ahn SS, Park CJ, et al. Diffusion and perfusion MRI may predict EGFR amplification and the TERT promoter mutation status of IDH-wildtype lower-grade gliomas. European Radiology 2020; 30: 6475–6484. doi: 10.1007/s00330-020-07090-34. Anzalone N, Castellano A, Cadioli M, et al. Brain gliomas: multicenter standardized assessment of dynamic contrast enhanced and dynamic susceptibility contrast MR images. Radiology 2018; 287:933-943. doi: 10.1148/radiol.20171703625. Koh TS, Ng QS, Thng CH, et al. Primary colorectal cancer: use of kinetic modeling of dynamic contrast-enhanced CT data to predict clinical outcome. Radiology 2013; 267: 145-154. doi: 10.1148/radiol.121201866. Heye T, Davenport MS, Horvath JJ, et al. Reproducibility of dynamic contrast enhanced MR imaging Part I: perfusion characteristics in the female pelvis by using multiple computer-aided diagnosis perfusion analysis solutions. Radiology 2013; 266: 801–811. doi: 10.1148/radiol.121202787. Koh TS, Bisdas S, Koh DM, Thng CH. Fundamentals of tracer kinetics for dynamic contrast-enhanced MRI. Journal of Magnetic Resonance Imaging 2011; 34:1262-1276. doi: 10.1002/jmri.22795Figures
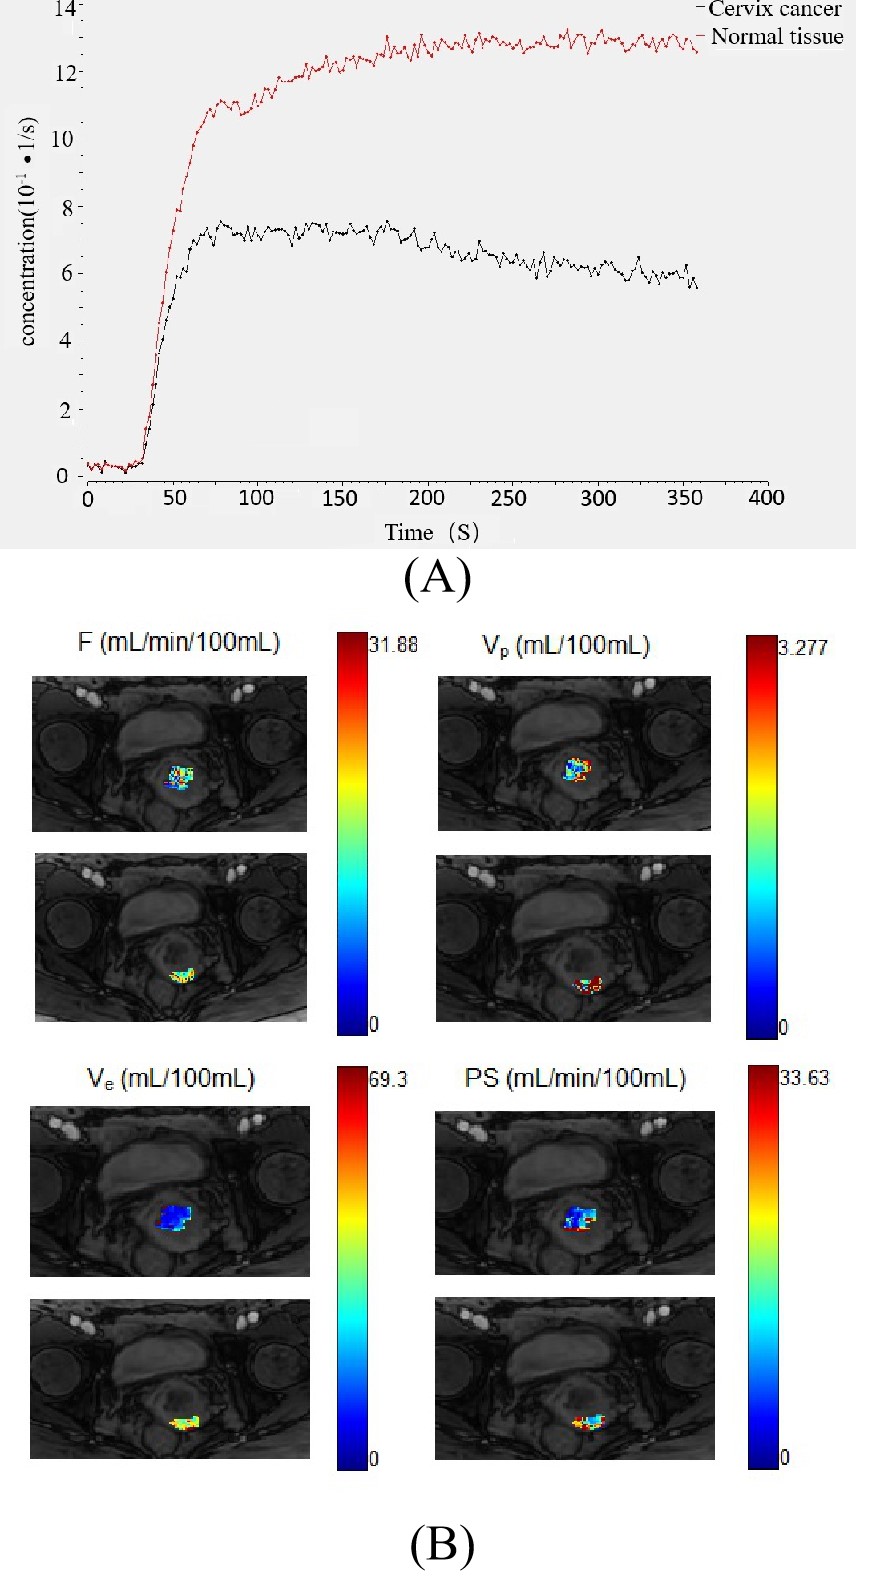
Figure 1 (A) The concentration-time curve of cervix cancer ROI and the normal tissue. (B) Parameter maps generated using the DP model for cancer and the normal tissue ROIs by MRI1(GE 750).
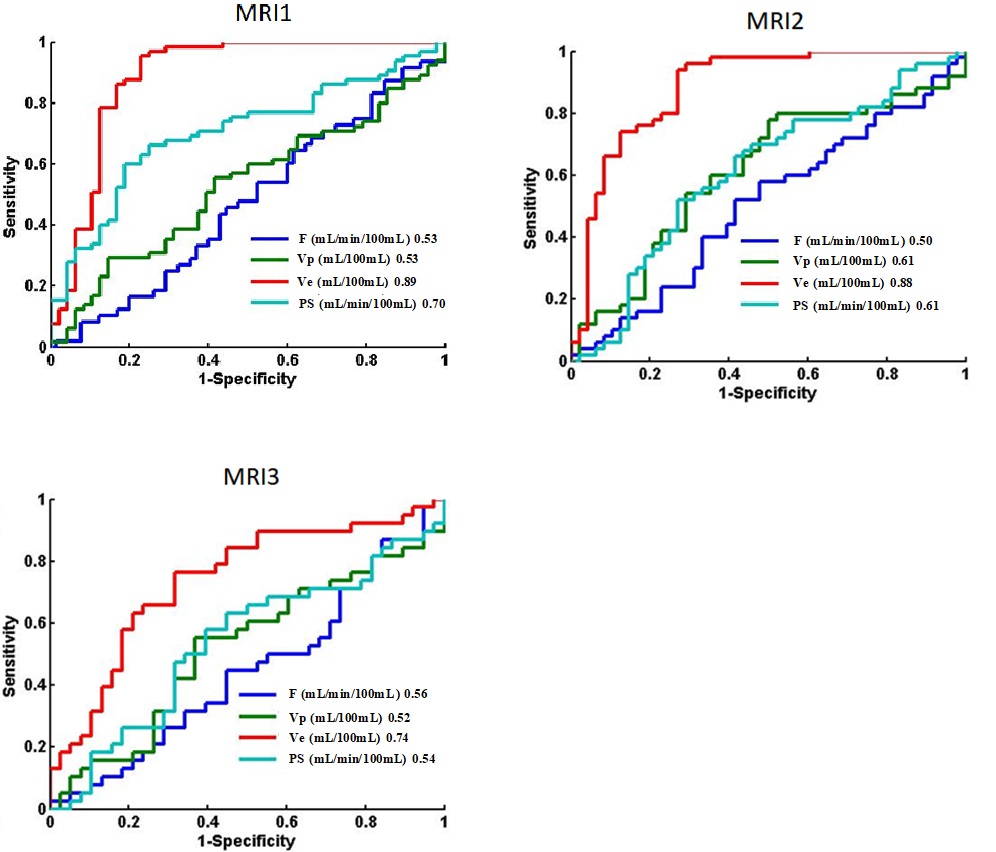
Figure 2 ROC plots of kinetic parameters derived by distributed parameter model in differentiating cervical carcinoma tissue from normal cervix tissue using data acquired by three MRI scanners (MRI1: GE 750; MRI2: Siemens Skyra; MRI3: Philips Achieva) in the respective centers.
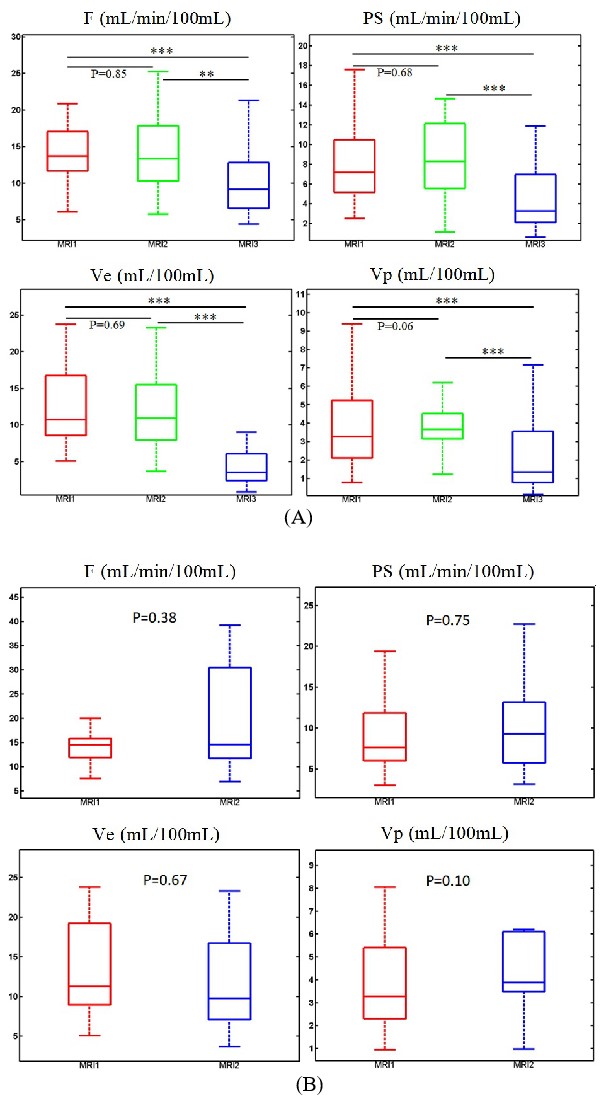
Figure 3 (A) Comparison on the distributions of DCE kinetic parameter measurements of cervical carcinoma tissue using three MRI scanners. (B) Comparison on the distributions of DCE kinetic parameter measurements of cervical carcinoma tissue with G2 using two MRI scanners (MR1, MR2). P-values of pairwise comparison using two-sample Kolmogorov-Smirnov test were indicated, with * standing for p<0.05, ** for p<0.01, *** for p<0.001.
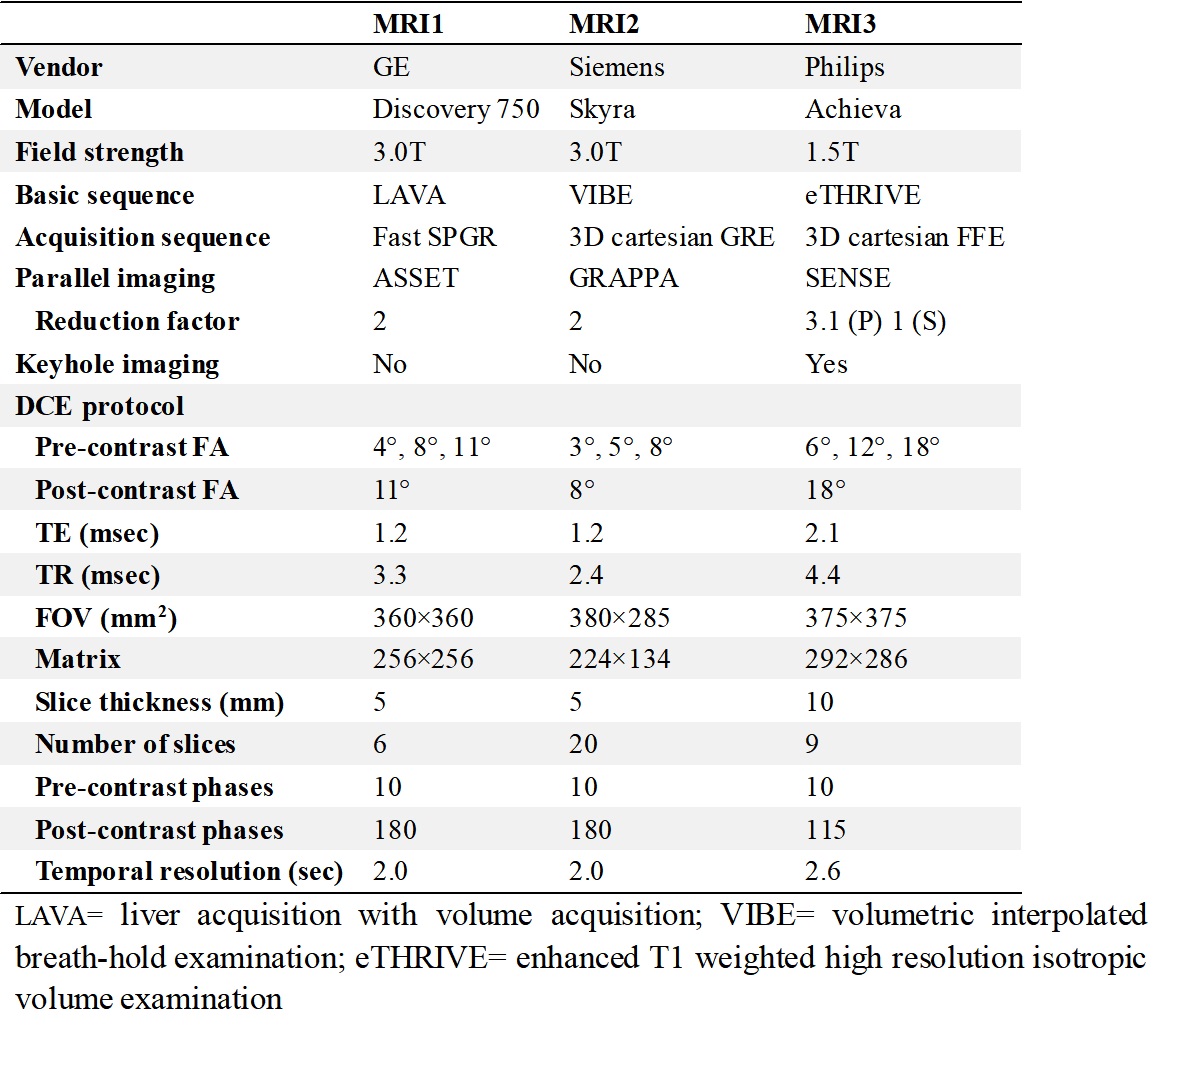
Table 1. Parameters of DCE MRI acquisition protocol
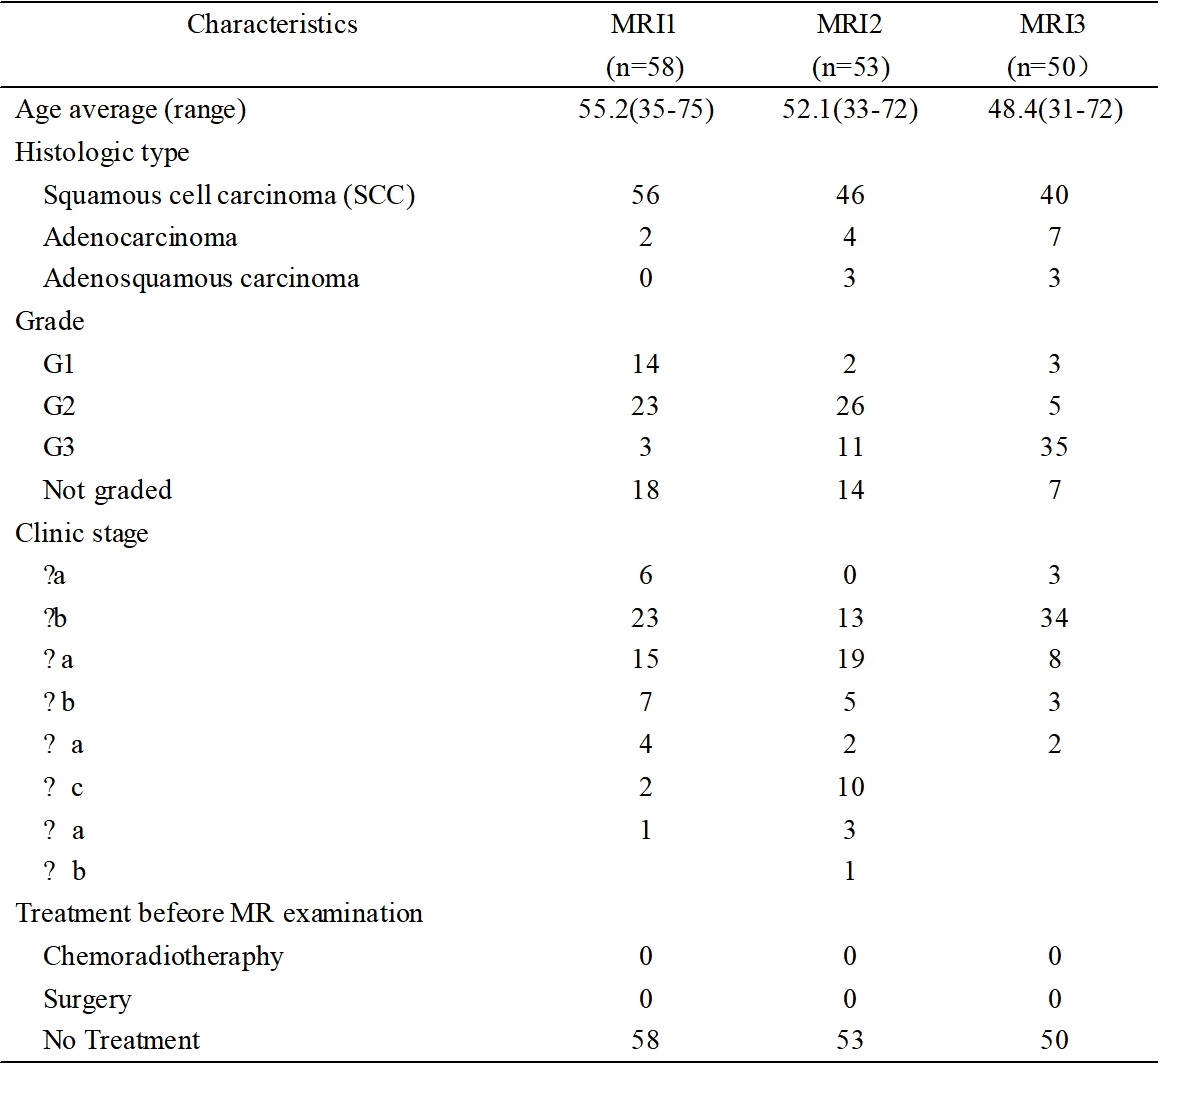
Table 2. Patient demography of this study
DOI: https://doi.org/10.58530/2023/3448