3446
Theoretical justification for fluid-suppressed APTw imaging based on spillover correction principles1Institut of Neuroradiology, University Clinic Erlangen, Friedrich-Alexander Universität Erlangen-Nürnberg, Erlangen, Germany, 2Department of R&D Advanced Applications, Olea Medical, La Ciotat, France, 3Siemens Healthcare GmbH, Erlangen, Germany, 4Lysholm Department of Neuroradiology, University College of London Hospitals NHS Foundation Trust, London, United Kingdom, 5Institute of Neurology UCL, London, United Kingdom
Synopsis
Keywords: Tumors, CEST & MT
Fluid suppression has an inestimable value in improving the readability of Amide Proton Transfer weighted imaging in the neuro-oncological field, by removing contamination effects in the fluid compartments. With this work we wanted to justify the derivation of this metric and to show different clinical examples. Our new fluid-suppressed APTw metric for 3T MR imaging, based on the principles of Spillover Correction for CEST imaging, can be then derived through the Bloch McConnell Equations.Introduction
Amide Proton Transfer weighted MRI is a molecular imaging technique nowadays available on 3 Tesla MRI scanner1. Despite its valuable clinical added value, especially in neuro-oncology field2,3, its signal is known to be contaminated by different effects such as T1,T2 and Magnetic Transfer Contrast (MTC) signal. This contamination is high in the fluid compartments (such as necrosis, cyst, hemorrhage) leading to false positives in reading the APTw images4, generating a real problem of clinical interpretation of the results. Early on, so-called spillover corrections5 were suggested to improve CEST imaging based on multi-Lorentzian-pools at 7T and 3T fields 6,7, but still not used for APTw imaging based on Magnetic Transfer Ratio Asymmetry1 metrics at 3T. The most likely reason for this was that the spillover correction changed the value scaling and thus the colormap limits of APTw imaging, making it difficult to compare APTw maps before and after this correction. Recently, so-called fluid suppression approaches for APTw imaging were suggested4,8,that also could suppress highlights in areas of long T1/T2 and low MTC (typical characteristics in fluid compartments), but had the benefit that the tissue APTw values (solid compartments) were almost unchanged and the same colorbar limits could be used. However the fluid-suppression formulas were heuristic and could never be properly derived from Bloch-McConnell (BMC) equations. Herein we show that fluid suppression can actually be understood as spillover correction, and we provide an adjusted version that can be properly derived, and used with the same colormap for the traditional APTw imaging.Methods
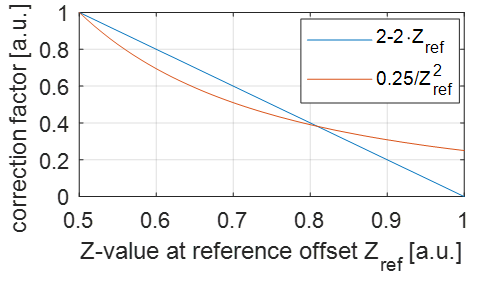
Formula derivation: The fluid-suppression that was proposed in4 introduced an additional weighting factor following the heuristic condition:(i) this factor must be 1 for tissue to keep the same colormap, (ii) and close to 0 for liquid tissue. Assuming that the vales for Z-Spectrum-Reference at Δω=-3.5ppm (Zref) and Z-Spectrum-Label at Δω=3.5ppm (Zlab) in tissue are typically ≈0.5, and in liquids ≈1, the factor (2-Zref-Zlab) fulfills this condition.FSheuristic-MTRasym=(Zref−Zlab)⋅(2−Zref−Zlab)=MTRasym⋅(2−Zref−Zlab) [1]
If we compare this to a spillover corrected metric, it does not fulfill conditions (i+ii),but regions with high Z-Spectrum values will be upscaled using the formula from1
MTRRex=1/(Zlab−Zref)=(Zref+Zlab)/(Zref∙Zlab)=MTRasym/(Zref∙Zlab) [2]
To achieve the same conditions (i+ii) we can transform this equation back to standard tissue with Zref = Zlab=0.5 generating a spillover corrected fluid suppression (FS).
FS-MTRasym=(0.5⋅0.5) ⋅MTRasym/(Zref∙Zlab) [3]
Now, condition (i) is directly fulfilled, and the factor of condition (ii) is not 0 but 0.25/1. Eq.[3] thus has similar features as Eq.[1], but is based on the BMC equations and thus theoretically justified.
Magnetic Resonance Imaging Acquisitions and post-Processing: APTw/MRI data were acquired in 3 glioblastoma patients on a 3T MRI scanner (MAGNETOM Prisma, Siemens, Erlangen, Germany) with a 64-channel head and neck coil. The APTw protocol (C2P-MPI04, 3 min, 2x2x5mm3, 12 slices) was performed with a 3D snapshot-GRE sequence9, setting a B1 root mean of square of 2μT and a Duty Cycle of 90%. The WASAB1 protocol10 (C2P-MPI04, 2 min) was performed for simultaneous B0-B1 mapping. T1w sequences after contrast injection were also acquired. Olea Sphere 3.0 software (Olea Medical, La Ciotat, France) was used to post-process APTw maps.
Results
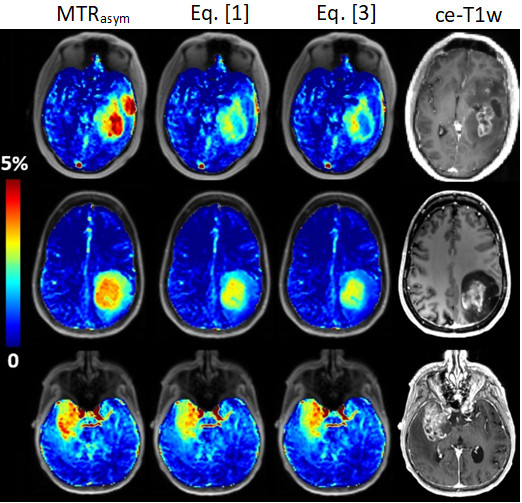
Figure 1 shows that the heuristic fluid-suppression factor, and the spillover-correction-based fluid-suppression factor have similar course plotted over Zref, which explains their similar effect on the data and on (liquid) regions with high Z-values. The property of Eq. [1] to kill all effects at Zref=1 is clinically unrealistic to achieve, while the depletion to only 25% by Eq. [3] is both theoretical correct and clinically plausible. Figure 2 shows differences of the original and newly proposed fluid-suppressed APTw method in tumor case at 3T: (first-row) cyst and liquefied necrosis hotspots are suppressed by Eq. [1] and even more by Eq. [3]; (second-row) both metrics suppress the signal from microfluid environment of an IDH mutant tumor; (third-row) only the hotspot in the liquefied necrotic part is removed by fluid-suppression.Discussion
Spillover correction is asking ‘how high would CEST effects in tissue be without spillover dilution’. On the other hand, fluid-suppression is asking ‘how low would CEST effects in liquid areas be if we transform them to similar conditions as in tissue’. Thus, both make CEST effects of tissue and liquefied tissue comparable. The novelty here, to bring the spillover correction back to tissue values, allows to use the same colormap and makes MTRasym-based metrics and spillover-corrected/fluid-suppressed- based metrics for APTw directly comparable on the same colormap. In tumor cases with clearly identified liquid regions, the new fluid-suppressed metric shows similar (and even improved) features as the previous heuristic one, and clearly removes hotspots of liquid areas, such as cysts, necrosis and microfluid environments. If this liquid-artifact or spillover-artifact is removed, the generated contrast might be better correlated to the actual exchange effects and has potentially higher diagnostic value, as first studies indicate11,12.Conclusion
Fluid suppression has an inestimable value in improving the readability of APTw maps in the neuro-oncological field. With this work we wanted to justify the derivation of this metric from a theoretical point of view, to reassure the scientific and medical field about its use.Acknowledgements
Department of Health’s NHR-funded Biomedical Research Centre at University College London. German Research Foundation DFG ZA 814/5-1References
1- Zhou J, Payen JF, Wilson DA, Traystman RJ, van Zijl P. Using the amide proton signals of intracellular proteins and peptides to detect pH effects in MRI. Nature medicine. 2003 Aug;9(8):1085-90.
2- Bisdas S, Demetriou E, Topriceanu CC, Zakrzewska Z. The role of APT imaging in gliomas grading: a systematic review and meta-analysis. European Journal of Radiology. 2020 Dec 1;133:109353.
3- Nichelli L, Casagranda S. Current emerging MRI tools for radionecrosis and pseudoprogression diagnosis. Current Opinion in Oncology. 2021 Nov;33(6):597.
4- Togao O., Keupp J., 2018. Magnetization Transfer Ratio based Metric for APTw or CESTw MRI Suppressing Signal from Fluid Compartments - Initial Application to Glioblastoma Assessment. Abstract for ISMRM 2018.
5- Zaiss M, Xu J, Goerke S, Khan IS, Singer RJ, Gore JC, Gochberg DF, Bachert P. Inverse Z‐spectrum analysis for spillover‐, MT‐, and T1‐corrected steady‐state pulsed CEST‐MRI–application to pH‐weighted MRI of acute stroke. NMR in biomedicine. 2014 Mar;27(3):240-52.
6- Zaiss M, Windschuh J, Goerke S, Paech D, Meissner JE, Burth S, Kickingereder P, Wick W, Bendszus M, Schlemmer HP, Ladd ME. Downfield‐NOE‐suppressed amide‐CEST‐MRI at 7 Tesla provides a unique contrast in human glioblastoma. Magnetic resonance in medicine. 2017 Jan;77(1):196-208.
7- Goerke S, Soehngen Y, Deshmane A, Zaiss M, Breitling J, Boyd PS, Herz K, Zimmermann F, Klika KD, Schlemmer HP, Paech D. Relaxation‐compensated APT and rNOE CEST‐MRI of human brain tumors at 3 T. Magnetic resonance in medicine. 2019 Aug;82(2):622-32.
8- Casagranda S, Mancini L, Gautier G, Peter P, Lopez B, Brandner S, de Vita E, Golay X, Bisdas S. Fluid suppression in CEST imaging affects predominantly IDH-mutant 1p/19q retained gliomas with T2-FLAIR mismatch. Abstract #0500 In ISMRM 29th Annual Meeting 2020.
9- Liebig P, Sedykh M, Herz K, Fabian MS, Mennecke A, Weinmüller S, Schmidt M, Dörfler A, Zaiss M. snapshot CEST++: the next snapshot CEST for fast whole-brain APTw imaging at 3T. arXiv preprint arXiv:2207.00261. 2022 Jul 1.
10- Schuenke P, Windschuh J, Roeloffs V, Ladd ME, Bachert P, Zaiss M. Simultaneous mapping of water shift and B1 (WASABI)—application to field‐inhomogeneity correction of CEST MRI data. Magnetic resonance in medicine. 2017 Feb;77(2):571-80.
11- Mancini L, Casagranda S, Gautier G, Peter P, Lopez B, Thorne L, McEvoy A, Miserocchi A, Samandouras G, Kitchen N, Brandner S. CEST MRI provides amide/amine surrogate biomarkers for treatment-naive glioma sub-typing. European journal of nuclear medicine and molecular imaging. 2022 Jan 14:1-5.
12- Nichelli L, Jacob J, Leclerq D, Benbelkacem F, Lehéricy S, and Casagranda S. Predicting radionecrosis and recurrent disease through Amide Proton Transfer weighted imaging in brain metastases. Abstract #7682 In ISMRM 31th Annual Meeting 2022.
Figures