3445
Grading and assessment of intra-tumor heterogeneity of gliomas using 3D CEST imaging with compressed sensing and sensitivity encoding1Division of Radiology, Department of Medical Technology, Kyushu university hospital, Fukuoka, Japan, 2Department of Health Sciences, Graduate school of Medical Sciences, Kyushu University, Fukuoka, Japan, 3Department of Molecular Imaging & Diagnosis, Graduate School of Medical Sciences, Kyushu University, Fukuoka, Japan, 4Department of Clinical Radiology, Graduate School of Medical Sciences, Kyushu University, Fukuoka, Japan, 5Department of Radiology Informatics & Network, Graduate School of Medical Sciences, Kyushu University, Fukuoka, Japan, 6Philips Japan, Tokyo, Japan, 7Department of Health Sciences, Faculty of Medical Sciences, Kyushu University, Fukuoka, Japan
Synopsis
Keywords: Tumors, CEST & MT
Glioma grading using chemical exchange saturation transfer (CEST) imaging is often performed in a single cross-section. However, CEST imaging of multiple cross-sections is desirable for intra-tumor heterogeneity. Compressed sensing and sensitivity encoding (CS-SENSE) was applied to CEST imaging to obtain multi-slice CEST imaging in a clinically appropriate scan time. The diagnostic performance of three-dimensional (3D) CEST imaging was comparable to that of a two-dimensional CEST imaging. The evaluation of the entire tumors by multi-slice CEST imaging was important in the gliomas' grading because the signal intensities differed among the tumor slices.Introduction
Amide proton transfer (APT) imaging is a type of endogenous chemical exchange saturation transfer (CEST) imaging that reflects amide protons with a resonance frequency at +3.5 ppm from bulk water (1). Differentiating low-grade glioma (LGG) from high-grade glioma (HGG) with the use of single-slice two-dimensional (2D) CEST imaging has been described (2-4); because CEST imaging requires longer acquisition time due to its use of saturating pulses at multiple frequencies. However, considering the heterogeneity within tumors (5-7), the signal values of APT-weighted imaging may differ depending on the imaging cross-section. We evaluated the usefulness of three-dimensional (3D) CEST imaging with compressed sensing and sensitivity encoding (CS-SENSE) for differentiating LGGs from HGGs and for assessing intratumoral heterogeneity.Materials and methods
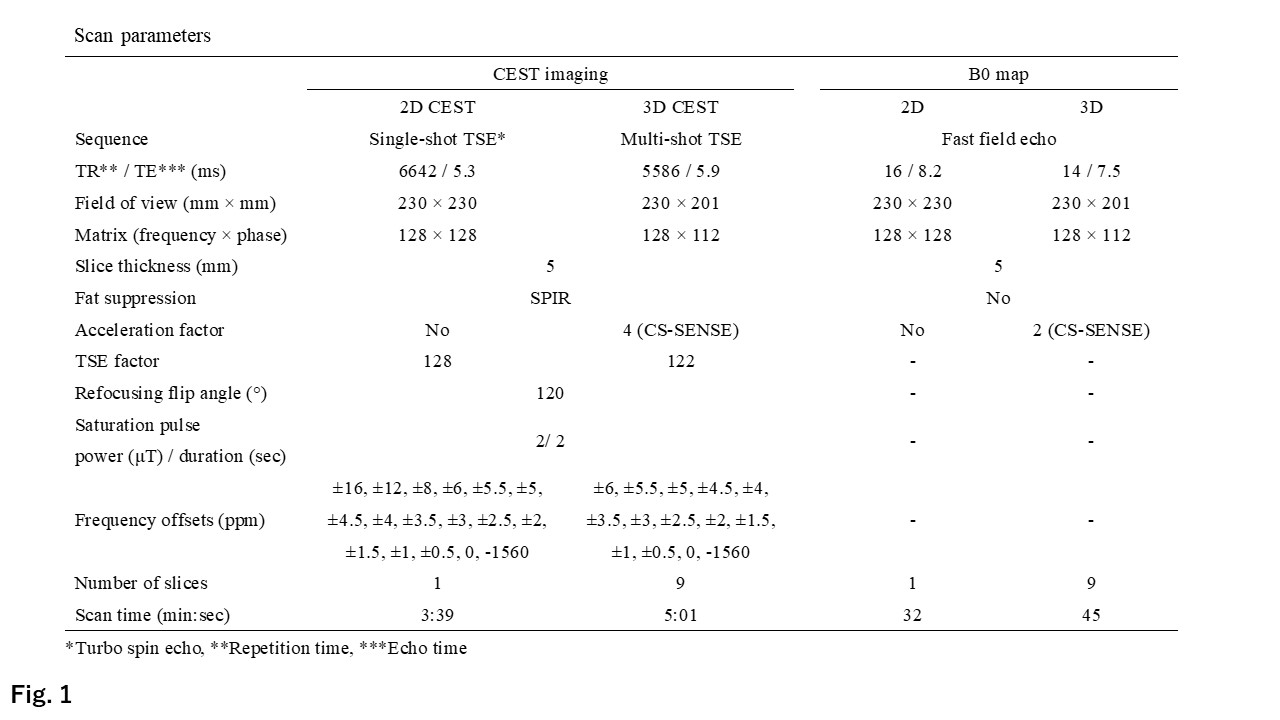
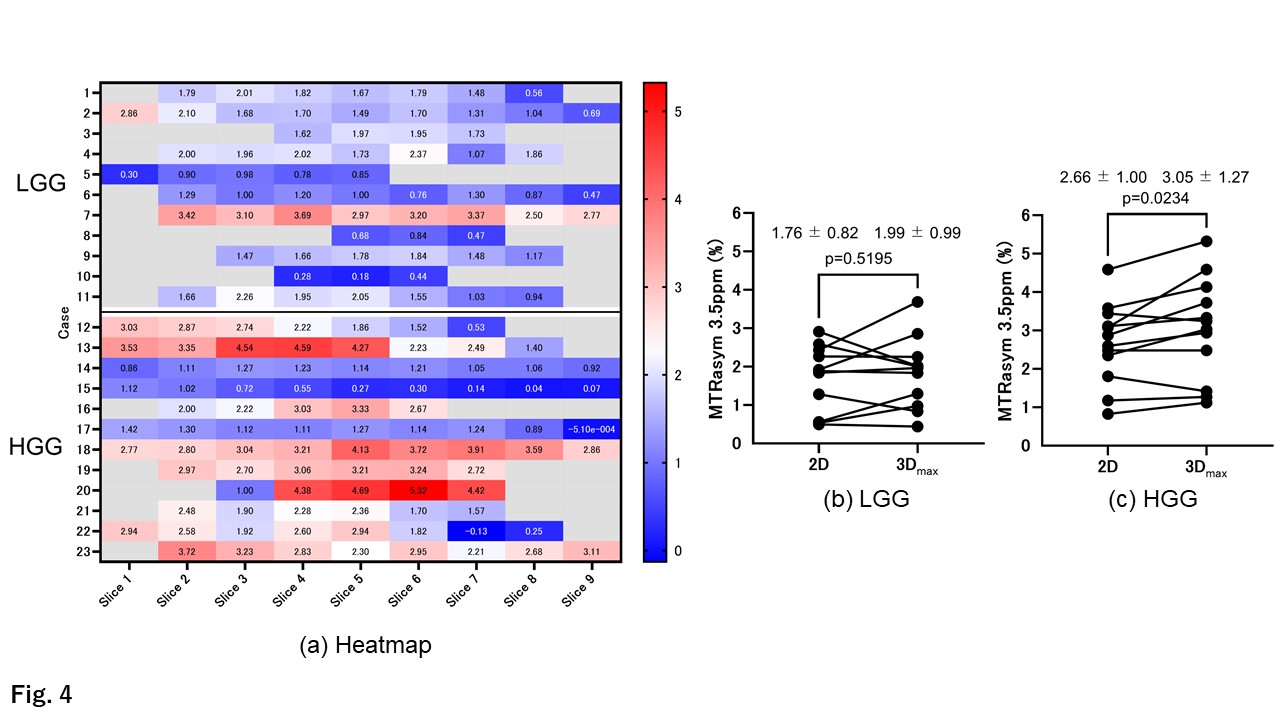
We analyzed 23 patients with glioma (mean age 52.3±12.9 years, 11 males and 12 females) who underwent a subsequent surgical resection. Eleven patients with LGGs (World Health Organization [WHO] grade 2), and 12 patients with HGGs (WHO grades 3 and 4) were identified. The histological diagnosis was determined based on WHO classification of central nervous system tumors 5th edition. MR imaging was performed on a 3-T MR scanner; 2D and 3D CEST imagings and B0 maps were acquired (Fig 1.). All image data were analyzed using the software program ImageJ (ver. 1.52a; U.S. National Institutes of Health, Bethesda, MD). A dedicated plug-in was created to assess the magnetization transfer ratio asymmetry (MTRasym) and was equipped with a correction function for B0 inhomogeneity. The MTRasym was defined as:MTRasym={Ssat(-Δppm)-Ssat(+Δppm)}/S-1560ppm, where Ssat(-Δppm) is the signal intensities at a target frequency. Regions of interest (ROIs) were drawn around the gadolinium (Gd) enhancement areas, and in cases of no Gd-enhancement, the high signal intensity areas on the fluid-attenuated inversion recovery image were surrounded. We defined MTRasym at 3.5 ppm in tumors among (i) single-slice 2D CEST imaging ("2D"), (ii) all tumor slices of 3D CEST imaging (3Dall), and (iii) a representative tumor slice of 3D CEST imaging (maximum signal intensity; 3Dmax). The mean values of MTRasym at 3.5 ppm in all three methods were compared between the LGG and HGG groups by the unpaired t-test. Receiver operating characteristic (ROC) and area under the curve (AUC) analyses were performed to evaluate the diagnostic performance of the parameters for differentiating LGGs from HGGs. The heat map of the mean values of MTRasym at 3.5 ppm for all slices with ROIs drawn on 3D CEST imaging in all patients was created. The mean values of MTRasym at 3.5 ppm in both the LGGs and the HGGs were compared between the 2D and 3Dmax by paired t-test. P-values <0.05 were considered significant in all analyses.Results
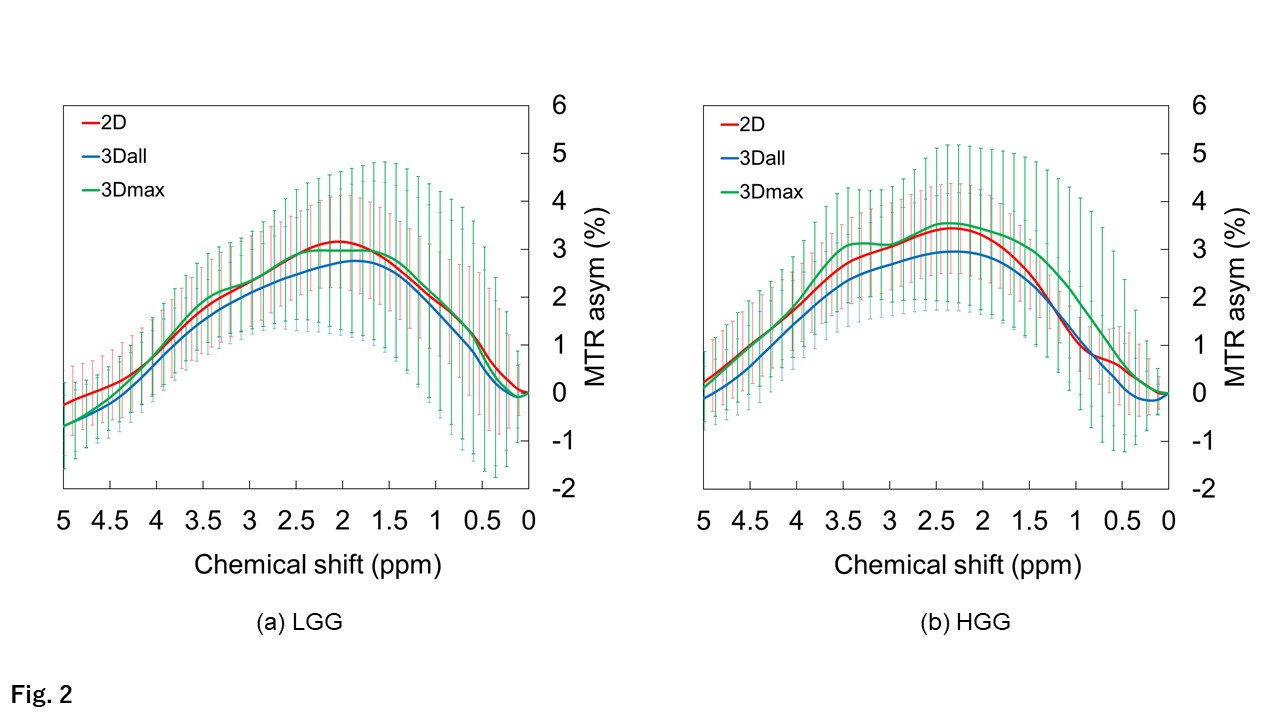
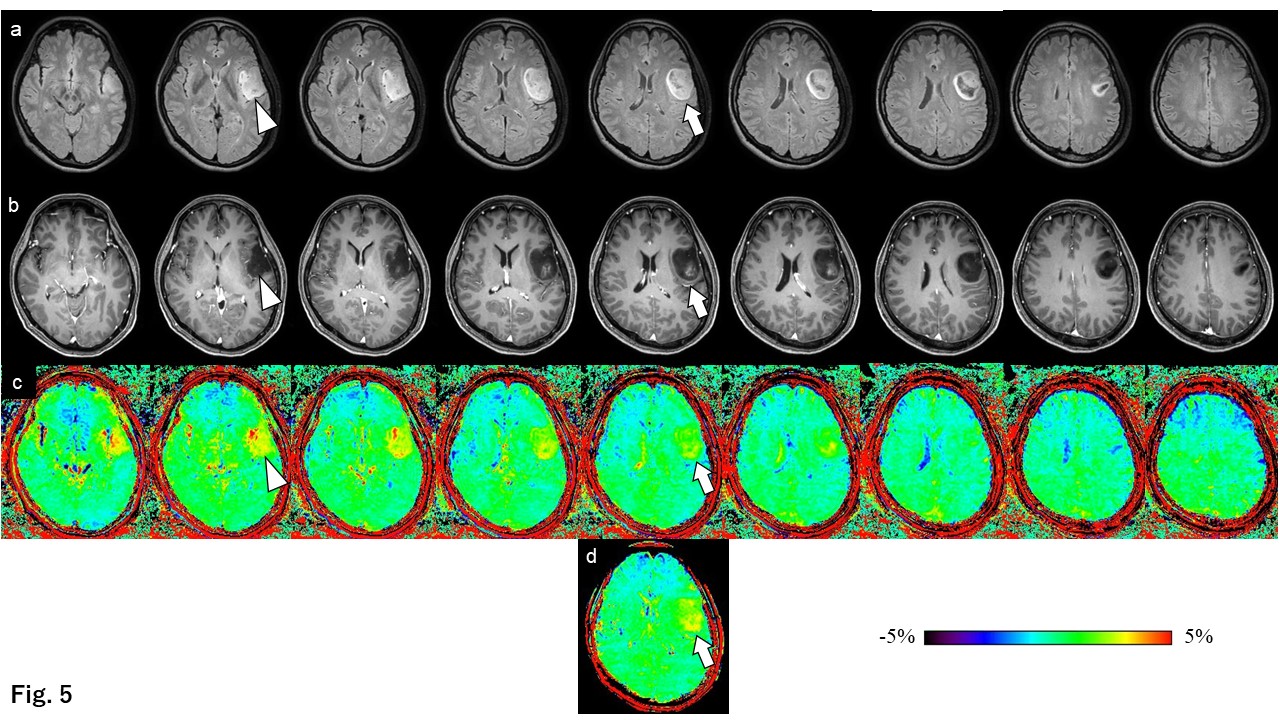
The MTRasym spectra of LGG and HGG for each method are shown in Figure 2. The maximum peak of the MTRasym spectra in the LGGs and HGGs for all methods were observed at around 2.0 ppm and at 2.5 ppm, respectively. The MTRasym spectra of the HGGs were gradually decreased with a maximum peak at 2.5 ppm in 2D and in 3Dall, but another peak was observed at 3.5 ppm in 3Dmax.The mean values of MTRasym at 3.5 ppm were significantly larger in the HGG group compared to the LGG group in all three methods (Fig. 3a-c). Figure 3d concern the diagnostic performance of the methods as determined by the ROC analyses for differentiating LGGs from HGGs. Equivalent AUCs were obtained in all three methods. The MTRasym at 3.5 ppm measured within the ROI on each slice for each patient is shown in Figure 4a. No significant difference was observed between the 2D and the 3Dmax for the MTRasym at 3.5 ppm in the LGG group (Fig. 4b). The MTRasym at 3.5 ppm obtained by the 3Dmax was significantly larger than that of the 2D in the HGG group (Fig. 4c). Figures 5 images from a representative case of astrocytoma, IDH-mutant, CNS WHO grade 3. The signal intensity varied depending on the slice position (Fig. 5c). The image from the 2D MTRasym at 3.5 ppm (Fig. 5d) was not the same slice position for the 3Dmax in the grade 3 tumor (Fig. 5c, arrowhead).Discussion
Our analyses revealed that the AUCs of both the 3Dall and 3Dmax methods were similar to those of conventional 2D CEST imaging. A 3D CEST imaging protocol with CS-SENSE can thus be used for glioma grading, like 2D CEST imaging. In the present study, there was no significant difference between the 2D MTRasym at 3.5 ppm and the 3Dmax MTRasym at 3.5 ppm in the group of LGGs, but the 3Dmax MTRasym at 3.5 ppm was significantly larger than the 2D MTRasym at 3.5 ppm in the group of HGGs. This is due to the heterogeneity of tumor cells in HGGs rather than LGGs. Thus, 3D CEST imaging is necessary to reflect tumor cell heterogeneity.Conclusion
Since the signal intensity of gliomas varies in each imaging section, it is able to obtain CEST imaging that reflects the intra-tumor heterogeneity of gliomas by using 3D CEST imaging. A 3D CEST imaging with CS-SENSE can be used clinically for glioma grading as well as 2D CEST imaging.Acknowledgements
No acknowledgement found.References
1. Zhou J, Lal B, Wilson DA, Laterra J, van Zijl PC. Amide proton transfer (APT) contrast for imaging of brain tumors. Magn Reson Med 2003;50(6):1120-1126.
2. Zhou J, Blakeley JO, Hua J, Kim M, Laterra J, Pomper MG, van Zijl PC. Practical data acquisition method for human brain tumor amide proton transfer (APT) imaging. Magn Reson Med 2008;60(4):842-849.
3. Togao O, Yoshiura T, Keupp J, Hiwatashi A, Yamashita K, Kikuchi K, Suzuki Y, Suzuki SO, Iwaki T, Hata N, Mizoguchi M, Yoshimoto K, Sagiyama K, Takahashi M, Honda H. Amide proton transfer imaging of adult diffuse gliomas: correlation with histopathological grades. Neuro Oncol 2014;16(3):441-448.
4. Togao O, Hiwatashi A, Yamashita K, Kikuchi K, Keupp J, Yoshimoto K, Kuga D, Yoneyama M, Suzuki SO, Iwaki T, Takahashi M, Iihara K, Honda H. Grading diffuse gliomas without intense contrast enhancement by amide proton transfer MR imaging: comparisons with diffusion- and perfusion-weighted imaging. Eur Radiol 2017;27(2):578-588.
5. Hobbs SK, Shi G, Homer R, Harsh G, Atlas SW, Bednarski MD. Magnetic resonance image-guided proteomics of human glioblastoma multiforme. J Magn Reson Imaging 2003;18(5):530-536.
6. Sottoriva A, Spiteri I, Piccirillo SG, Touloumis A, Collins VP, Marioni JC, Curtis C, Watts C, Tavare S. Intratumor heterogeneity in human glioblastoma reflects cancer evolutionary dynamics. Proc Natl Acad Sci U S A 2013;110(10):4009-4014.
7. Aum DJ, Kim DH, Beaumont TL, Leuthardt EC, Dunn GP, Kim AH. Molecular and cellular heterogeneity: the hallmark of glioblastoma. Neurosurg Focus 2014;37(6):E11.
Figures