3442
Analysis of short-TE STEAM data at 7T: Effects of a macromolecular basis set and baseline parameters on GABA, glutamate and their ratio.
Tomohisa Okada1, Hideto Kuribayashi2, Yuta Urushibata2, Thai Akasaka1, Ravi Teja Seethamraju3, Sinyeob Ahn3, and Tadashi Isa1
1Human Brain Research Center, Kyoto University, Kyoto, Japan, 2Siemens Healthcare, Japan, Tokyo, Japan, 3Siemens Medical Solutions, Malvern, PA, United States
1Human Brain Research Center, Kyoto University, Kyoto, Japan, 2Siemens Healthcare, Japan, Tokyo, Japan, 3Siemens Medical Solutions, Malvern, PA, United States
Synopsis
Keywords: Data Analysis, Spectroscopy
The effect of baseline flexibility LCModel parameter DKNTMN (0.15, 0.3, 0.6 and 1) on a 7T short-TE STEAM MRS measurement of GABA, glutamate and excitatory-inhibitory ratio (EIR) was investigated using both simulated and measured macromolecular basis sets. Mean (SD) of GABA/tCr was highest, 0.23 (0.02), using simulated MM basis. Using measured MM basis, the ratios decreased from 0.18 (0.04) to 0.12 (0.03) by the increase of DKNTMN values. The GABA/tCr ratio and EIR of a former multi-center study was 0.19 and 8.2 after T2 decay correction. Analysis using DKNTMN of 0.3 conformed best and considered to be the choice.INTRODUCTION
Measurement of γ-aminobutyric acid (GABA), glutamate and excitatory-inhibitory ratio (EIR) is frequently conducted using proton magnetic resonance spectroscopy (MRS) at 7 Tesla (7T). Macromolecules (MMs) are known to affect precision and accuracy of metabolite quantification, especially for the short-TE MRS, and measured MM basis is gradually used in LCModel analysis combined with a spline baseline. Its stiffness is controlled by a parameter named DKNTMN, but studies on its effect is limited. This study investigated the effect of DKNTMN parameters to quantify MRS data acquired using a short-TE STEAM sequence and compared the concentration with former studies.METHODS
Twenty-six young healthy subjects (15 males, mean age 26 years, aged 20-47 years) were enrolled with written informed consent under an IRB-approved protocol. An investigational whole-body scanner (MAGNETOM 7T, Siemens Healthcare, Erlangen, Germany) with a single-transmit volume coil and a 32-channel receiver head coil (Nova Medical, MA, USA) was used. For proton MRS, a measurement voxel 20×20×20 mm3 was placed in the posterior cingulate cortex (PCC) on a mid-sagittal T1-weighted MP2RAGE image (research application; TR/TE 6000/2.9ms, TI1/TI2 800/2700ms, FA1/FA2 4°/5°, 0.7mm isotropic resolution). FASTMAP (research application) and manual shimming were conducted. A STEAM (research application; TR/TE/TM 4000/5/45ms, spectral bandwidth 6 kHz, 48 averages) were used. Water unsuppressed spectra were also acquired for eddy-current correction and quantitation. Scans were conducted twice with an off-bed interval. Analyses were conducted using the LCModel for the default analysis using the simulated MM basis (MMsimulated) with DKNTMN 0.15 and an MM basis measured inhouse (MMmeasured; Figure 1) with DKNTMN of 0.15, 0.3, 0.6 and 1. Differences among analysis conditions were evaluated for Cramér-Rao lower bound (CRLB) and concentration of GABA, glutamate and EIR in addition to MMs. Statistical analysis was conducted using repeated measurement ANOVA. Measurement stability was evaluated using coefficient of variation (CV).RESULTS
Mean (SD) of CRLB ranged from 9.23 (1.14) to 15.81 (4.41) for GABA among the different analyses, where using DKNTMN 0.15 or 0.3 showed significantly lower CRLB than that of 0.6 or 1. CRLB values of Glu were mostly 2, but they were 3 in a few cases of the 2nd scans. Mean (SD) of GABA concentration normalized by total creatine (tCr) ranged from 0.12 (0.03) to 0.23 (0.02). The concentration was significantly higher when MMsimulated was used. Using MMmeasured, GABA/tCr were significantly higher in the analyses with DKNTMN of 0.15 or 0.3 than those of 0.6 or 1 in both test and retest scans. The Glu/tCr values were 1.15 (0.07) to 1.30 (0.07) with similar tendencies to GABA/tCr. Measurement stability between the test-retest scans indicated by mean CV ranged 4.70% – 14.69% for GABA/tCr, 2.10% – 2.81% for Glu/tCr and 3.55% – 13.08% for EIR. The CV of GABA was significantly lower when analyzed with MMsimulated than MMmeasured which had no significant difference among 4 DKNTMN conditions. See Table 1 and Figure2. For MMmeasured, mean (SD) values of CRLB for macromolecule fit were reasonably low, ranging from 2.50 (0.13) to 3.19 (0.08). The concentration values (in arbitrary unit) tend to slightly decrease with the increase of DKNTMN, ranging from 4.87 (0.12) to 5.54 (0.12) (Table 2).DISCUSSION
CRLB of GABA was significantly lower using MMsimulated than MMmeasured, even when the same DKNTMN of 0.15 was used. Higher DKNTMN resulted in higher CRLB for GABA, but little difference was observed for Glu. Measured GABA/tCr was significantly higher using MMsimulated than MMmeasured, and this was considered due to incomplete removal of MMs. GABA/tCr gradually decreased by the increase of DKNTMN values. When editing was conducted at 1.5 and 1.9 ppm to delete undesirable MM contribution at 3.0 ppm that is J-coupled to MM at 1.7 ppm1, GABA concentration was reduced to 53.5% at the anterior cingulate cortex2. When this result is applied, the GABA+/tCr concentration at PCC will decrease from 0.26 - 0.273 to 0.14 for GABA/tCr, but the ratio increases to 0.18 after correcting T2 decay4. When van de Bank et al.5 conducted a multi-center 7T-MRS study measured at PCC using sLASER (TE = 30ms) and analyzed the spectra with LCModel including their measured MM basis, the mean ratio of GABA/tCr at PCC was 0.16, which increases to 0.19 after T2 decay correction to TE of 5ms. The GABA/tCr values of our study analyzed with DKNTMN of 0.15 and 0.3 are 0.17 – 0.18, and these values are almost the same to the former studies. Glu/tCr tend to decrease by the increase of DKNTMN, but the changes were smaller compared with GABA/tCr. The Glu peak is large at 2.35 ppm, and there is no apparent overlapping MM peak. EIRs in our study was lowest when the spectra were analyzed using MMsimulated, and they increased by using MMmeasured to the increase of DKNTMN. EIRs are mainly affected by GABA concentration. EIRs measured at PCC in the multi-center study was 7.235, which increases to 8.2 after T2 signal decay correction. The nearest EIR in this study, 7.64, was obtained in the LCModel analysis using DKNTMN 0.3 with MMeasured.CONCLUSION
Metabolites quantification depends on the parameters of baseline flexibility in fitting. Analysis using MMmeasured with DKNTMN of 0.3 conformed best to former studies and should be used for analysis.Acknowledgements
The authors are grateful to Profs. Takashi Hanakawa, Toshiya Murai, Nobukatsu Sawamoto and Dr. Dinh HD Thuy for their help to this study. This work was supported by The Strategic International Brain Science Research Promotion Program (Brain/ MINDS Beyond) (JP18dm0307003 and JP19dm0307102) from Japan Agency for Medical Research and Development (AMED), JSPS KAKENHI Grant Number JP21H03806 and Siemens Healthcare KK, Japan.References
1. Henry P, Dautry C, Hantraye P, Bloch G: Brain GABA editing without macromolecule contamination. Magnet Reson Med 2001; 45:517–520. 2. Aufhaus E, Weber‐Fahr W, Sack M, et al.: Absence of changes in GABA concentrations with age and gender in the human anterior cingulate cortex: A MEGA‐PRESS study with symmetric editing pulse frequencies for macromolecule suppression. Magnetic Resonance in Medicine 2013; 69:317–320. 3. Hong D, Rankouhi SR, Thielen J-W, Asten JJA van, Norris DG: A comparison of sLASER and MEGA-sLASER using simultaneous interleaved acquisition for measuring GABA in the human brain at 7T. Plos One 2019; 14:e0223702. 4. Intrapiromkul J, Zhu H, Cheng Y, Barker PB, Edden RAE: Determining the in vivo transverse relaxation time of GABA in the human brain at 7T. J Magn Reson Imaging 2013; 38:1224–1229. 5. Bank B, Emir U, Boer V, et al.: Multi‐center reproducibility of neurochemical profiles in the human brain at 7 T. NMR in Biomedicine 2015; 28:306–316.Figures
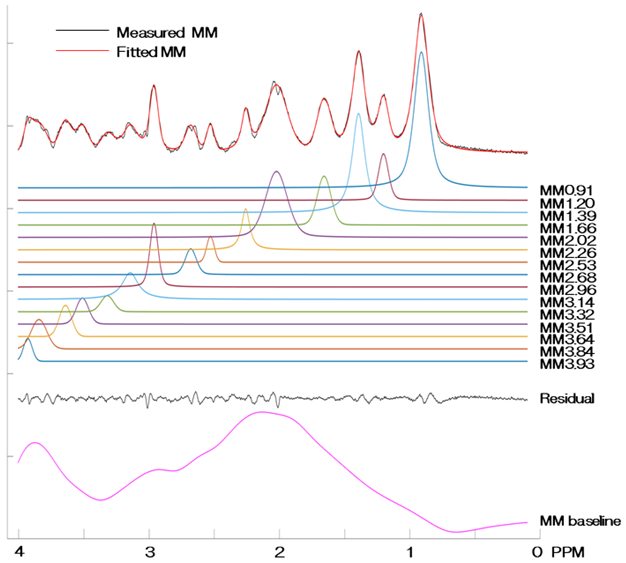
Figure 1. The measured MM
spectrum (black) and fit MM basis (red) of 17 young normal subjects used in
this study. The fits of 15 MM peaks were centered at 0.91, 1.20, 1.39, 1.66,
2.02, 2.26, 2.53, 2.68, 2.96, 3.14, 3.32, 3.51, 3.64, 3.84 and 3.93. Residual
and baseline are also presented. The vertical axis is an arbitrary unit.
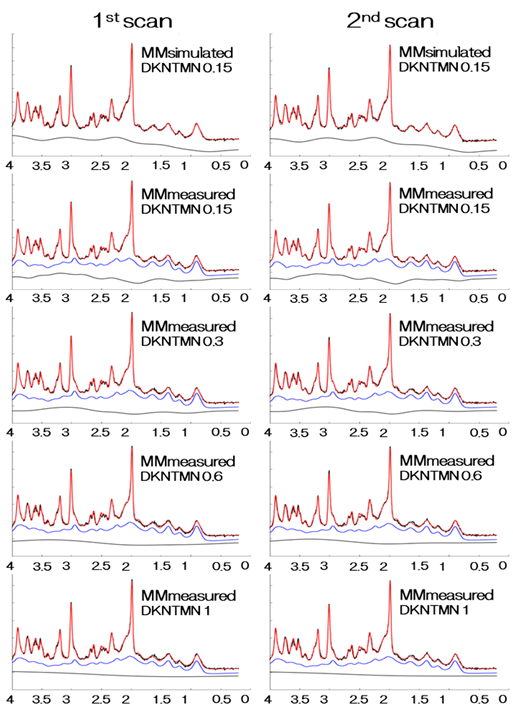
Figure 2. The
spectra and analyses of a representative 29-year-old female. The measured (black) and fit
(red) spectra, MMmeasured (blue) and baseline placed at the bottom are
presented. MMmeasured and baseline are shifted to avoid overlap. The plots are
very similar between the 1st and 2nd scans. Gradual stiffening of the baseline
is observed by the increase of DKNTMN values. The horizontal axis is in PPM,
and the vertical axis is an arbitrary unit.
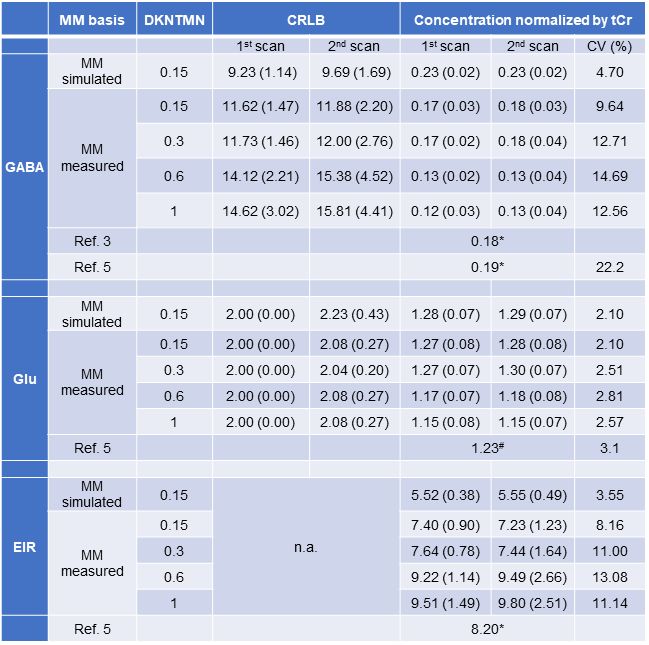
Table 1. Measurement results of GABA, Glu and EIR. The values in CRLB and concentration columns are mean (SD). Concentrations of GABA and Glu were normalized with that of total creatine (tCr). CRLB Cramér-Rao lower bound, CV coefficient of variation, EIR excitatory-inhibitory ratio, GABA γ-aminobutyric acid, Glu glutamate, MM macromolecule. *After subtraction of presumed MM signal and correction for T2 signal decay. #After correction for T2 signal decay.
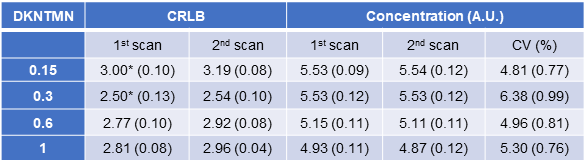
Table 2. Measurement results of macromolecules. The values in CRLB and concentration columns are mean (SD). Concentration values are presented in arbitrary unit (A.U.). CRLB Cramér-Rao lower bound, CV coefficient of variation.
DOI: https://doi.org/10.58530/2023/3442