3441
Revealing hidden phosphomonoester signals under phosphoethanolamine and phosphocholine resonances: A brain 31P MRS study at 7T1Advanced Imaging Research Center, University of Texas Southwestern Medical Center, Dallas, TX, United States, 2Department of Radiology, University of Texas Southwestern Medical Center, Dallas, TX, United States
Synopsis
Keywords: Data Analysis, Spectroscopy, brain, phosphocholine, phosphoethanolamine, phosphomonoester
It has been a common practice to quantify brain phosphomonoester (PME) 31P signals using a two-component model composed of phosphoethanolamine (PE) and phosphocholine (PC). This study demonstrates spectral evidence of the presence of a hidden broad PME (h-PME) signal underneath PE and PC resonances, characterized by a short T1 and potentially contributed by RBC 2,3-DPG in brain blood vessels, though other sources of signal contribution cannot be fully ruled out. The results have implication in using PE and PC as biomarkers of altered phospholipid metabolism in brain pathologies.INTRODUCTION
It has been a common practice to quantify brain phosphomonoester (PME) 31P signals using a two-component model composed of phosphoethanolamine (PE) and phosphocholine (PC)1-3. However, a growing body of in vivo 31P data appears to suggest a more complex PME signal composition4-6. This is because the brain PE and PC signals, despite of a large difference in chemical shift (Δδ = 0.5 ppm) and a relative narrow line width (~20 Hz at 7T), are often marginally resolved even at ultra-high fields. In contrast, the counterpart glycerophosphoethanolamine (GPE) and glycerophosphocholine (GPC) in the PDE region, with approximately equal Δδ, are typically well-resolved from the baseline level. Over the last three decades, only a few in vivo brain 31P studies have attempted to incorporate additional signals for improving lineshape fitting in PME region7-9. However, so far, there has been a lack of spectral evidence that clearly demonstrates the selective detection of the hidden PME signals (h-PME) underneath the PE and PC resonances. This study aims to address this issue and to characterize h-PME T1 relaxation time for improving accuracy in measurements of brain PE and PC.METHODS
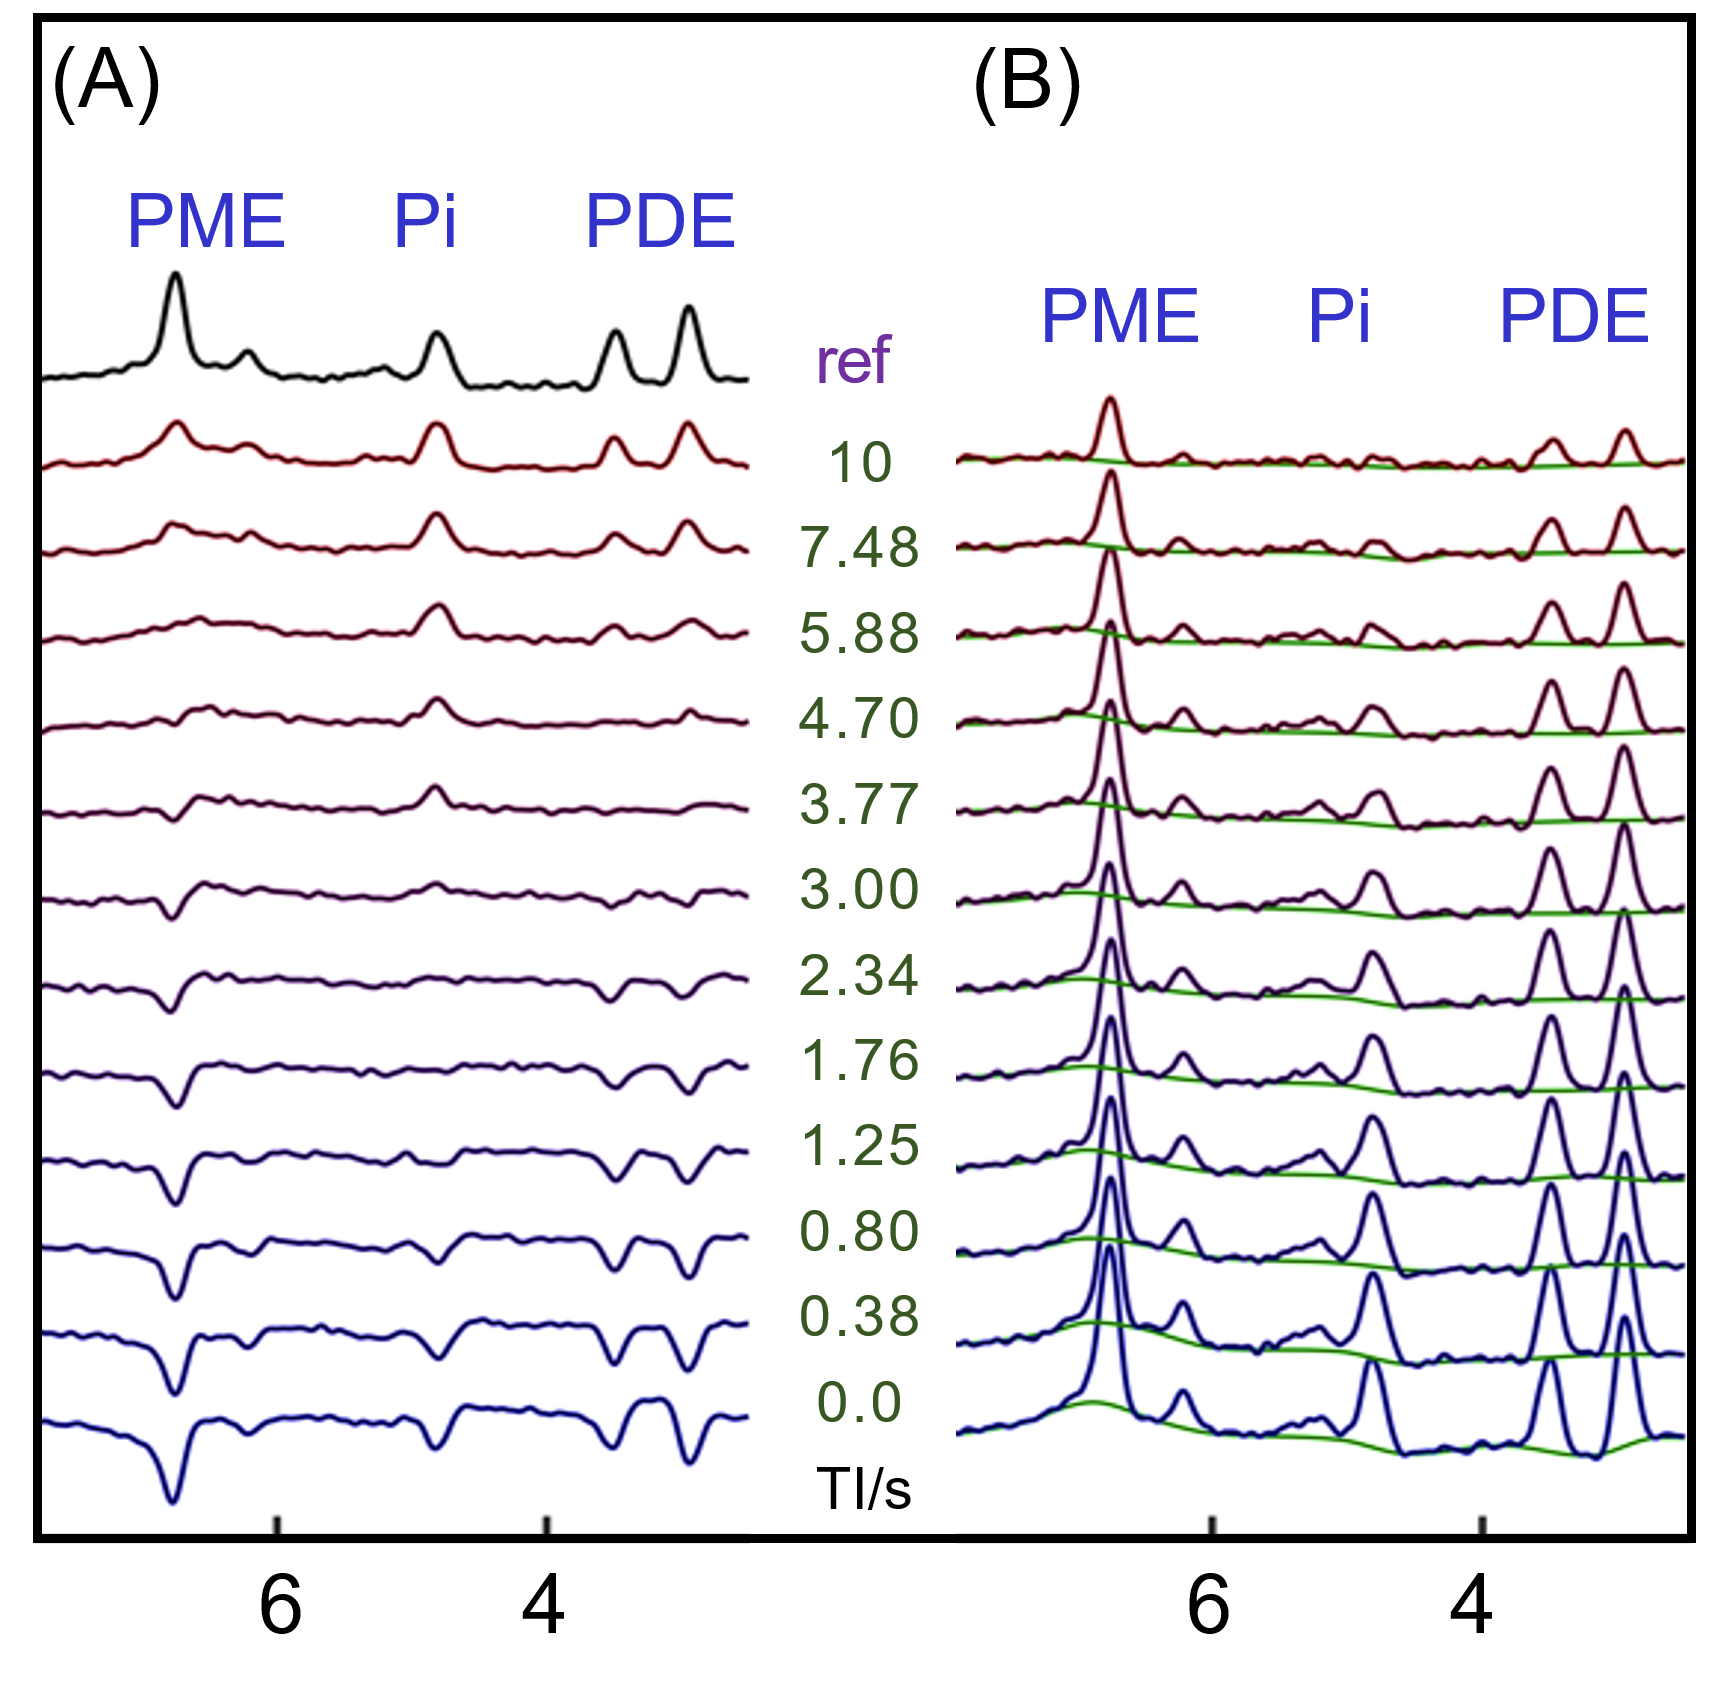
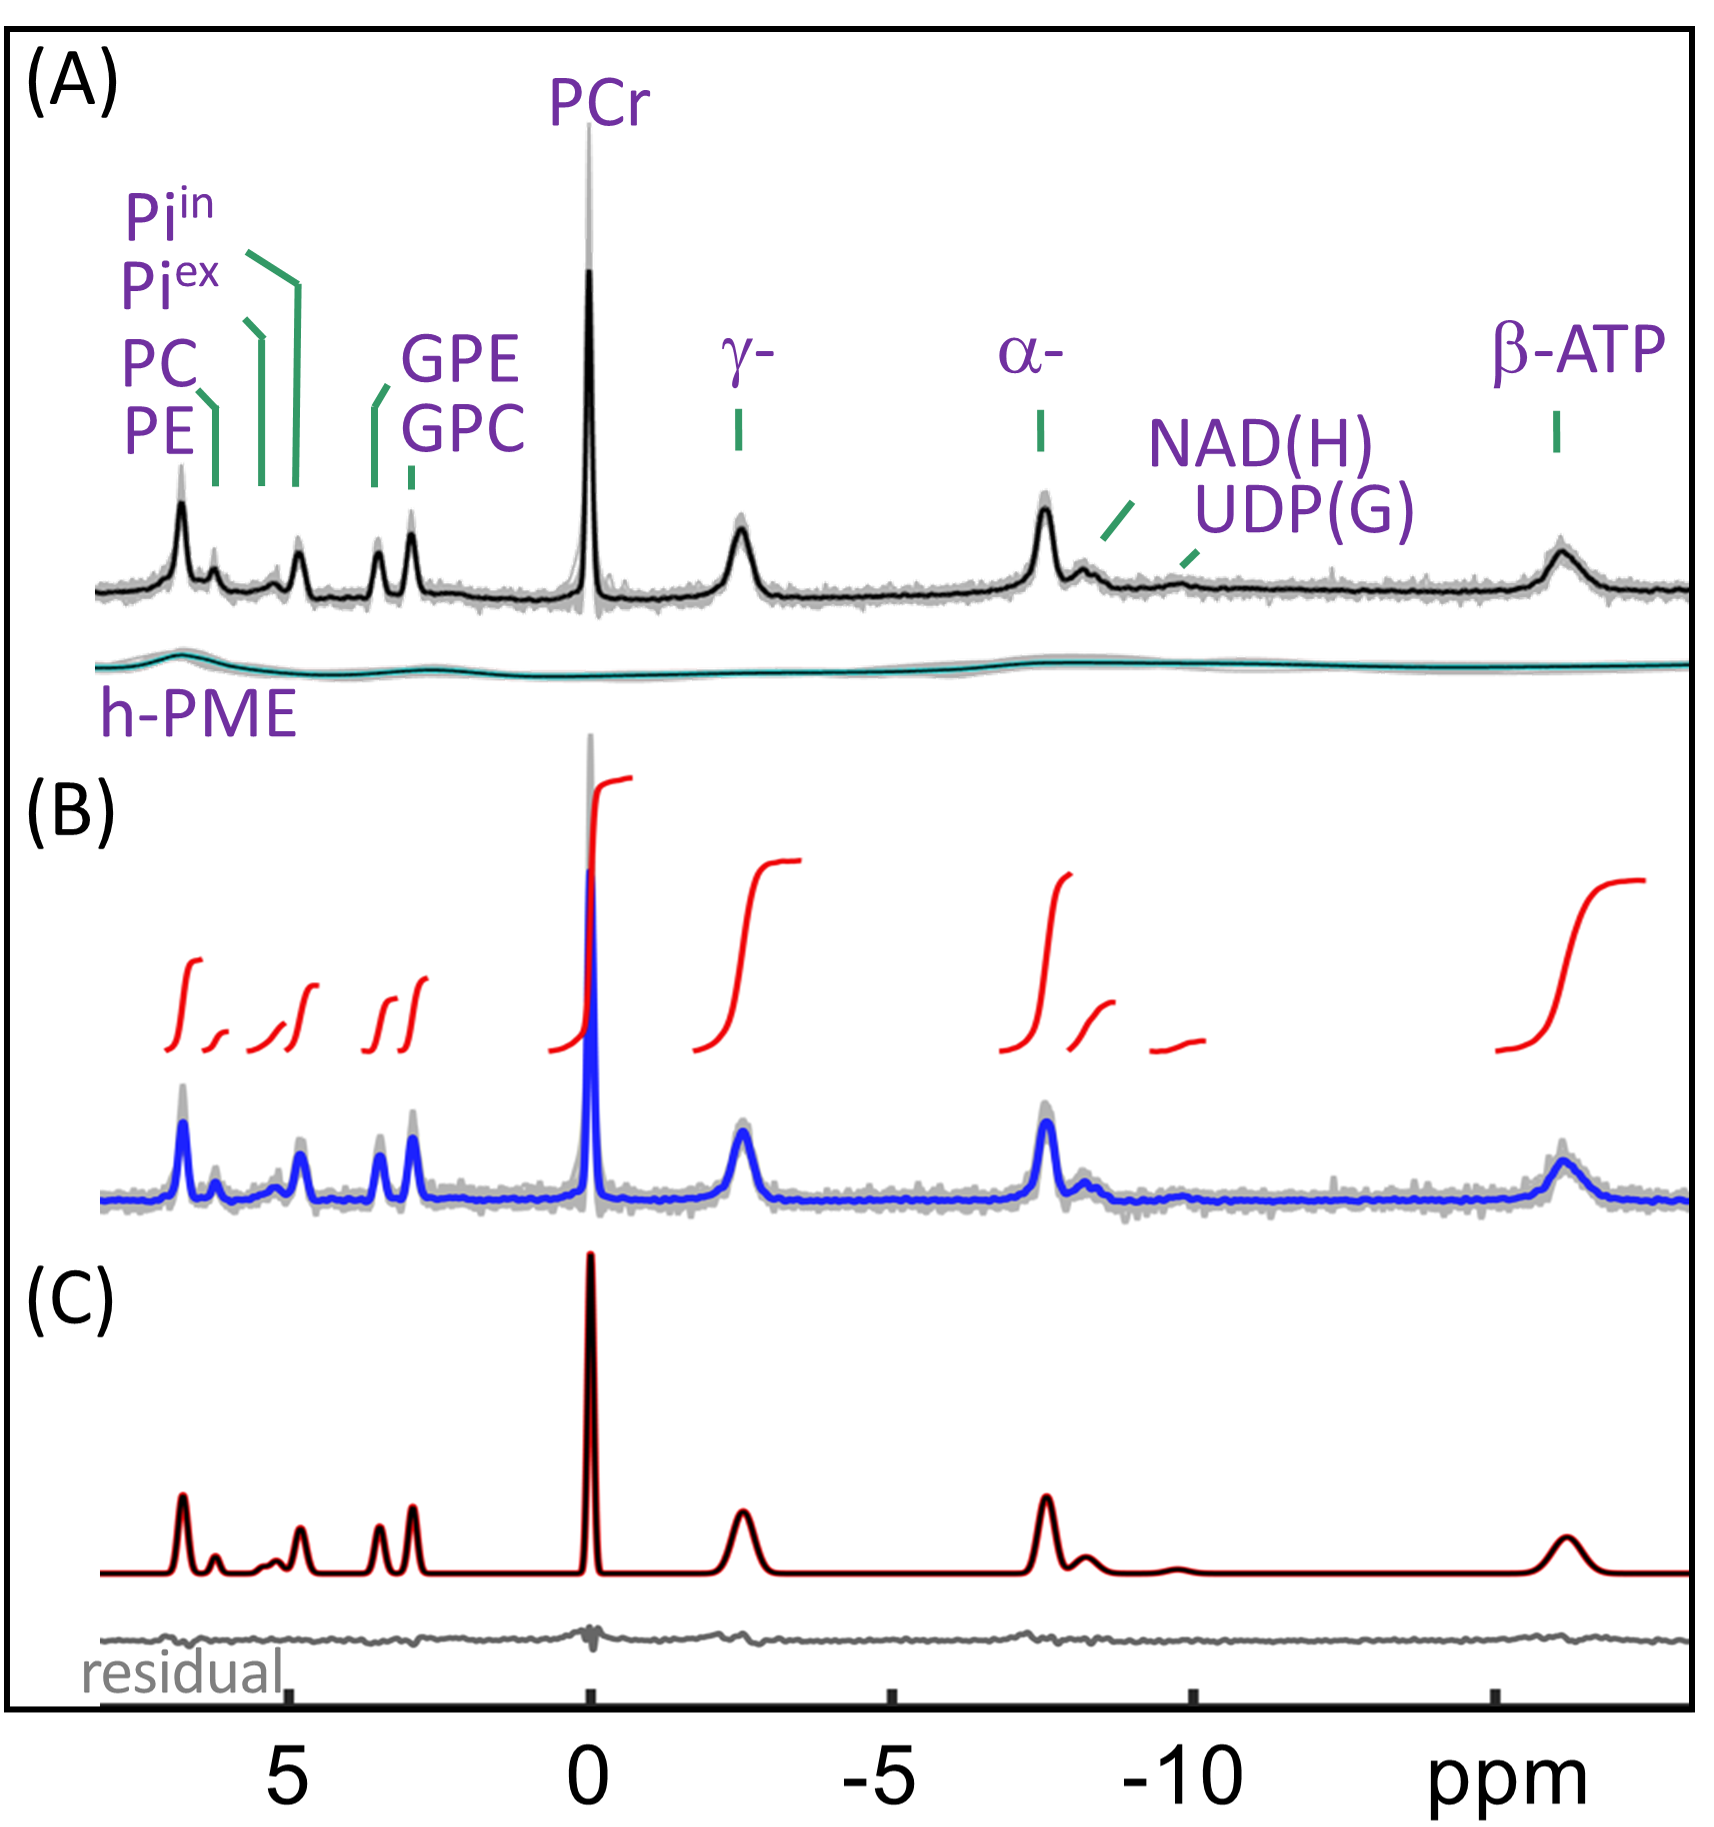
Human brain 31P MR spectra were acquired on a 7T human scanner (Achieva, Philips Healthcare, Best, the Netherlands) using a half-cylinder-shaped 1H/31P T/R RF coil (Philips Healthcare) with pulse-acquire sequence under TR = 30 s, FA = 55o and NA = 16. Inversion-recovery (IR) experiment was performed to evaluate T1 and to null PE and PC for selective detection of h-PME with optimized inversion time (TI). Spectra after h-PME correction were analyzed to obtain metabolite concentrations in a group of 16 healthy subjects. Additionally, outer-volume-suppression (OVS) and 31P MRSI were used to explore the spatial origin of h-PME signals.RESULTS AND DISCUSSION
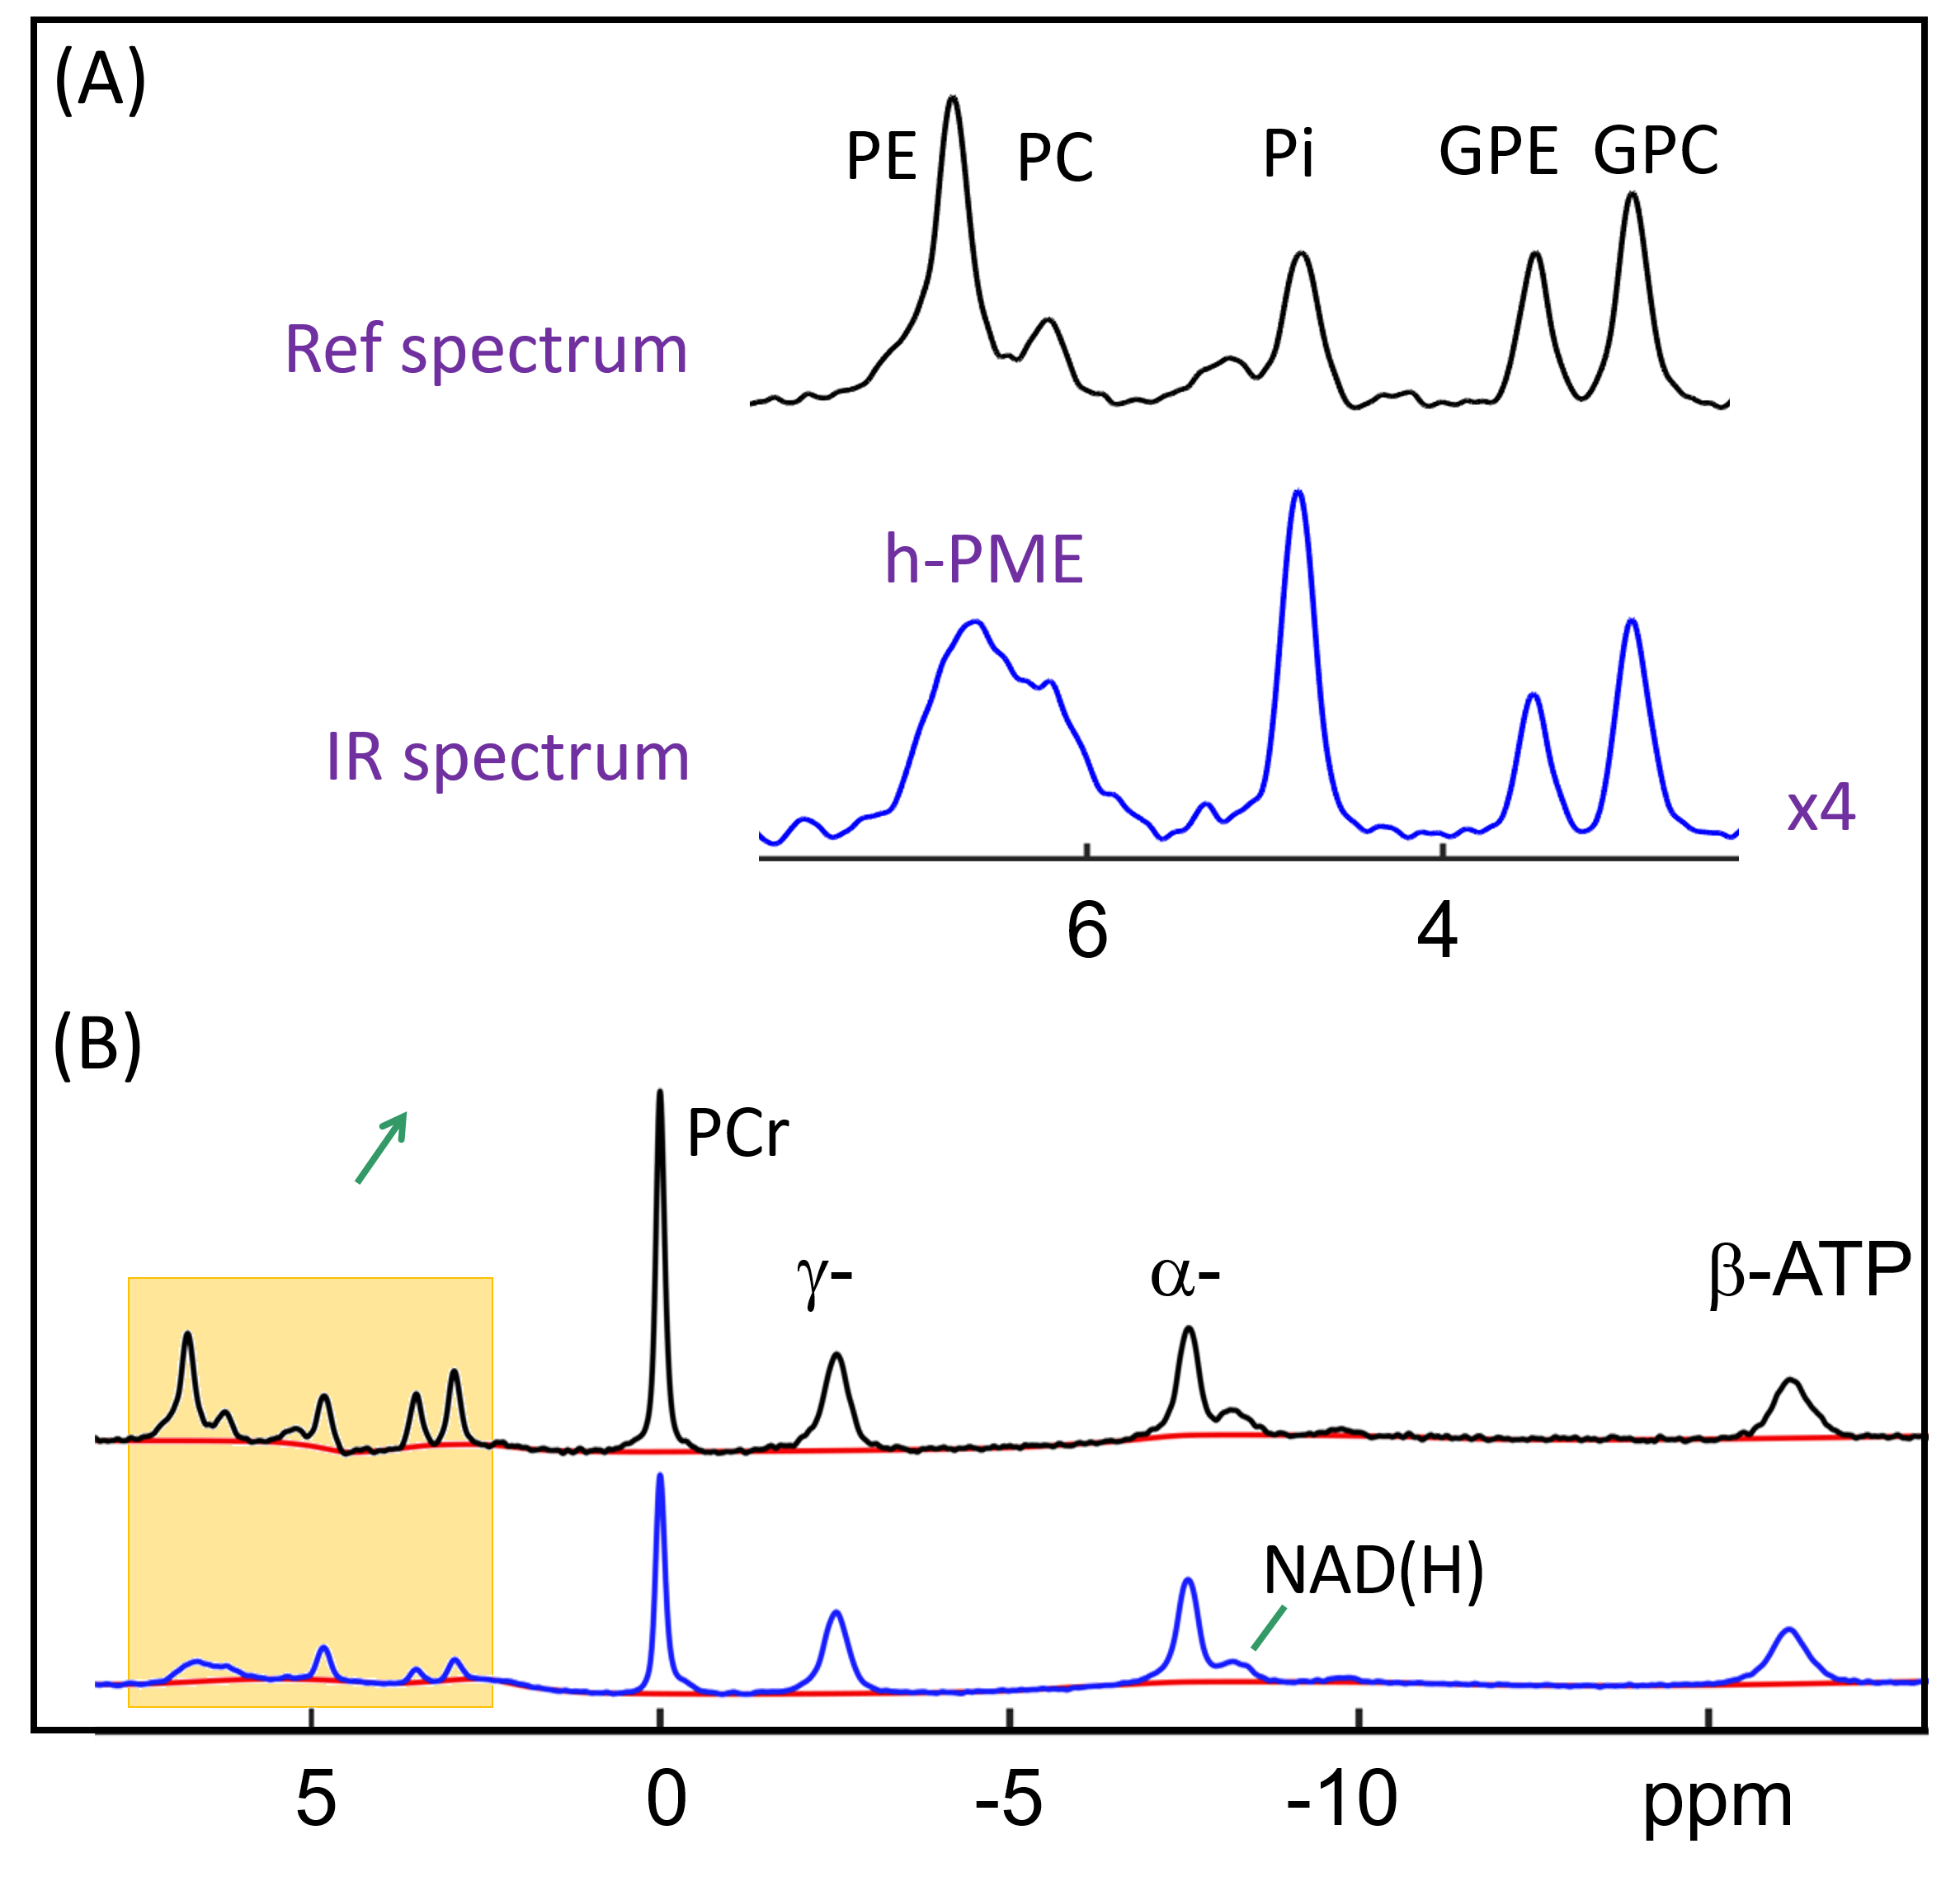
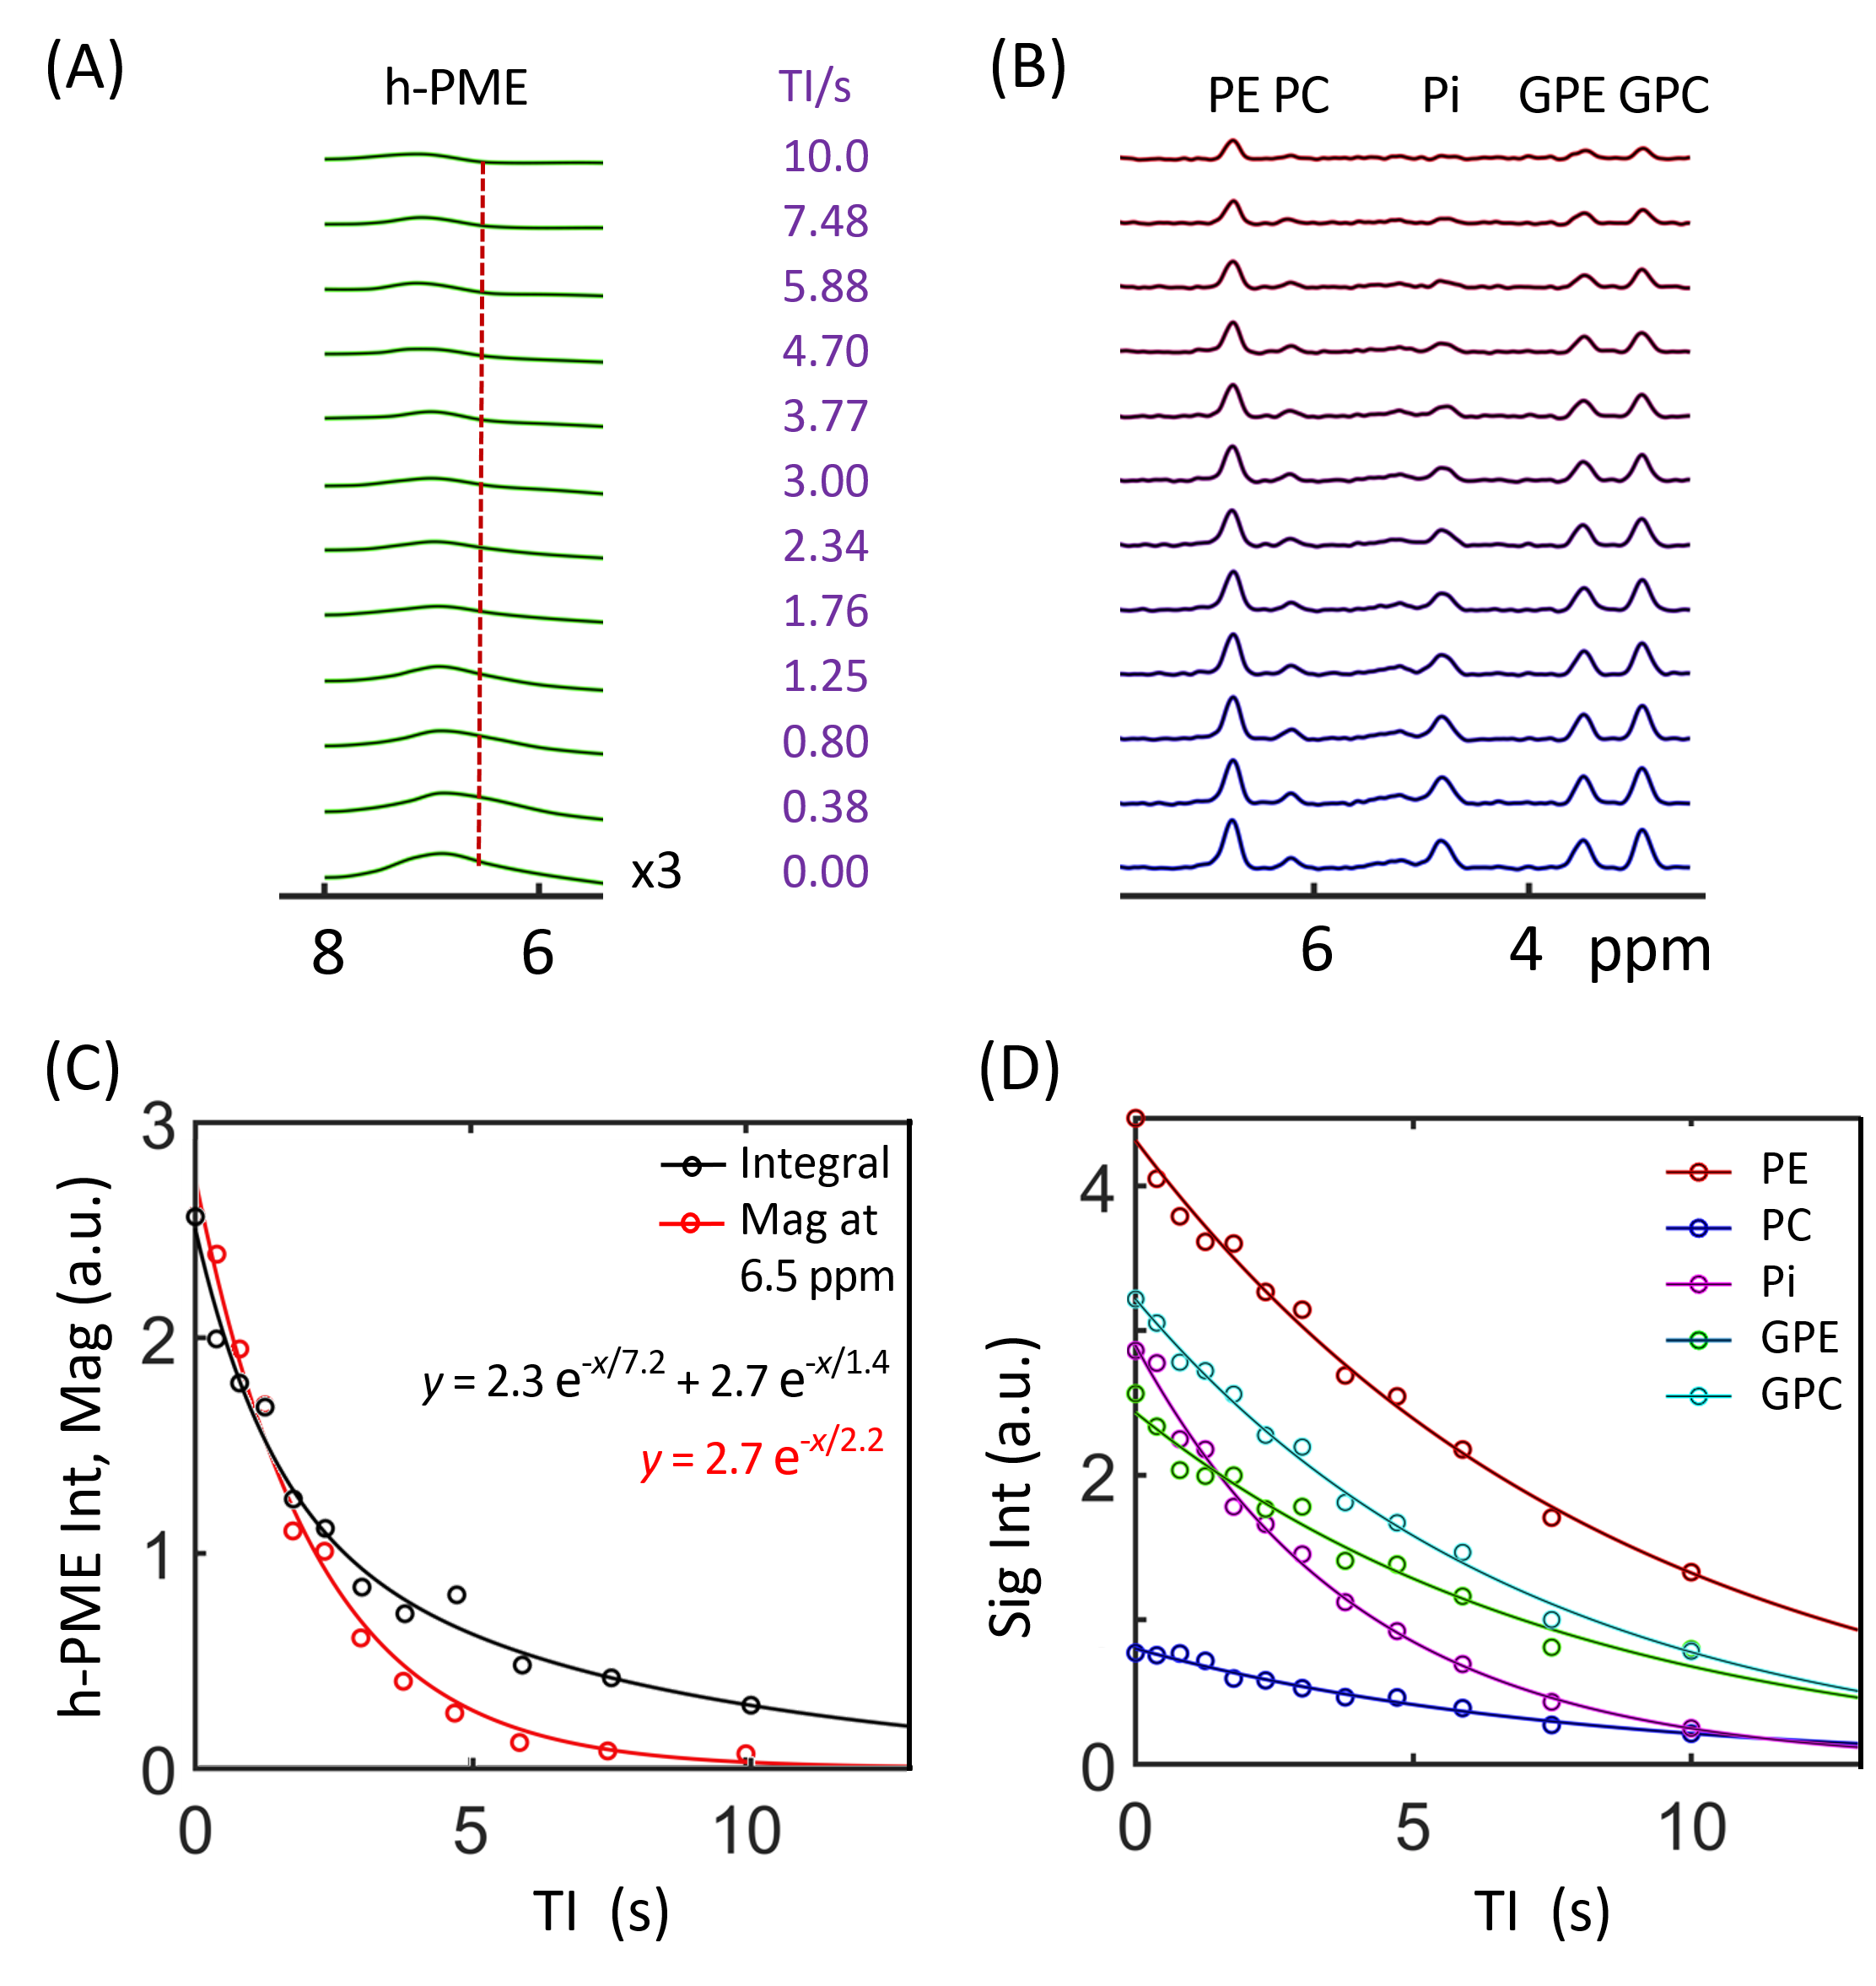
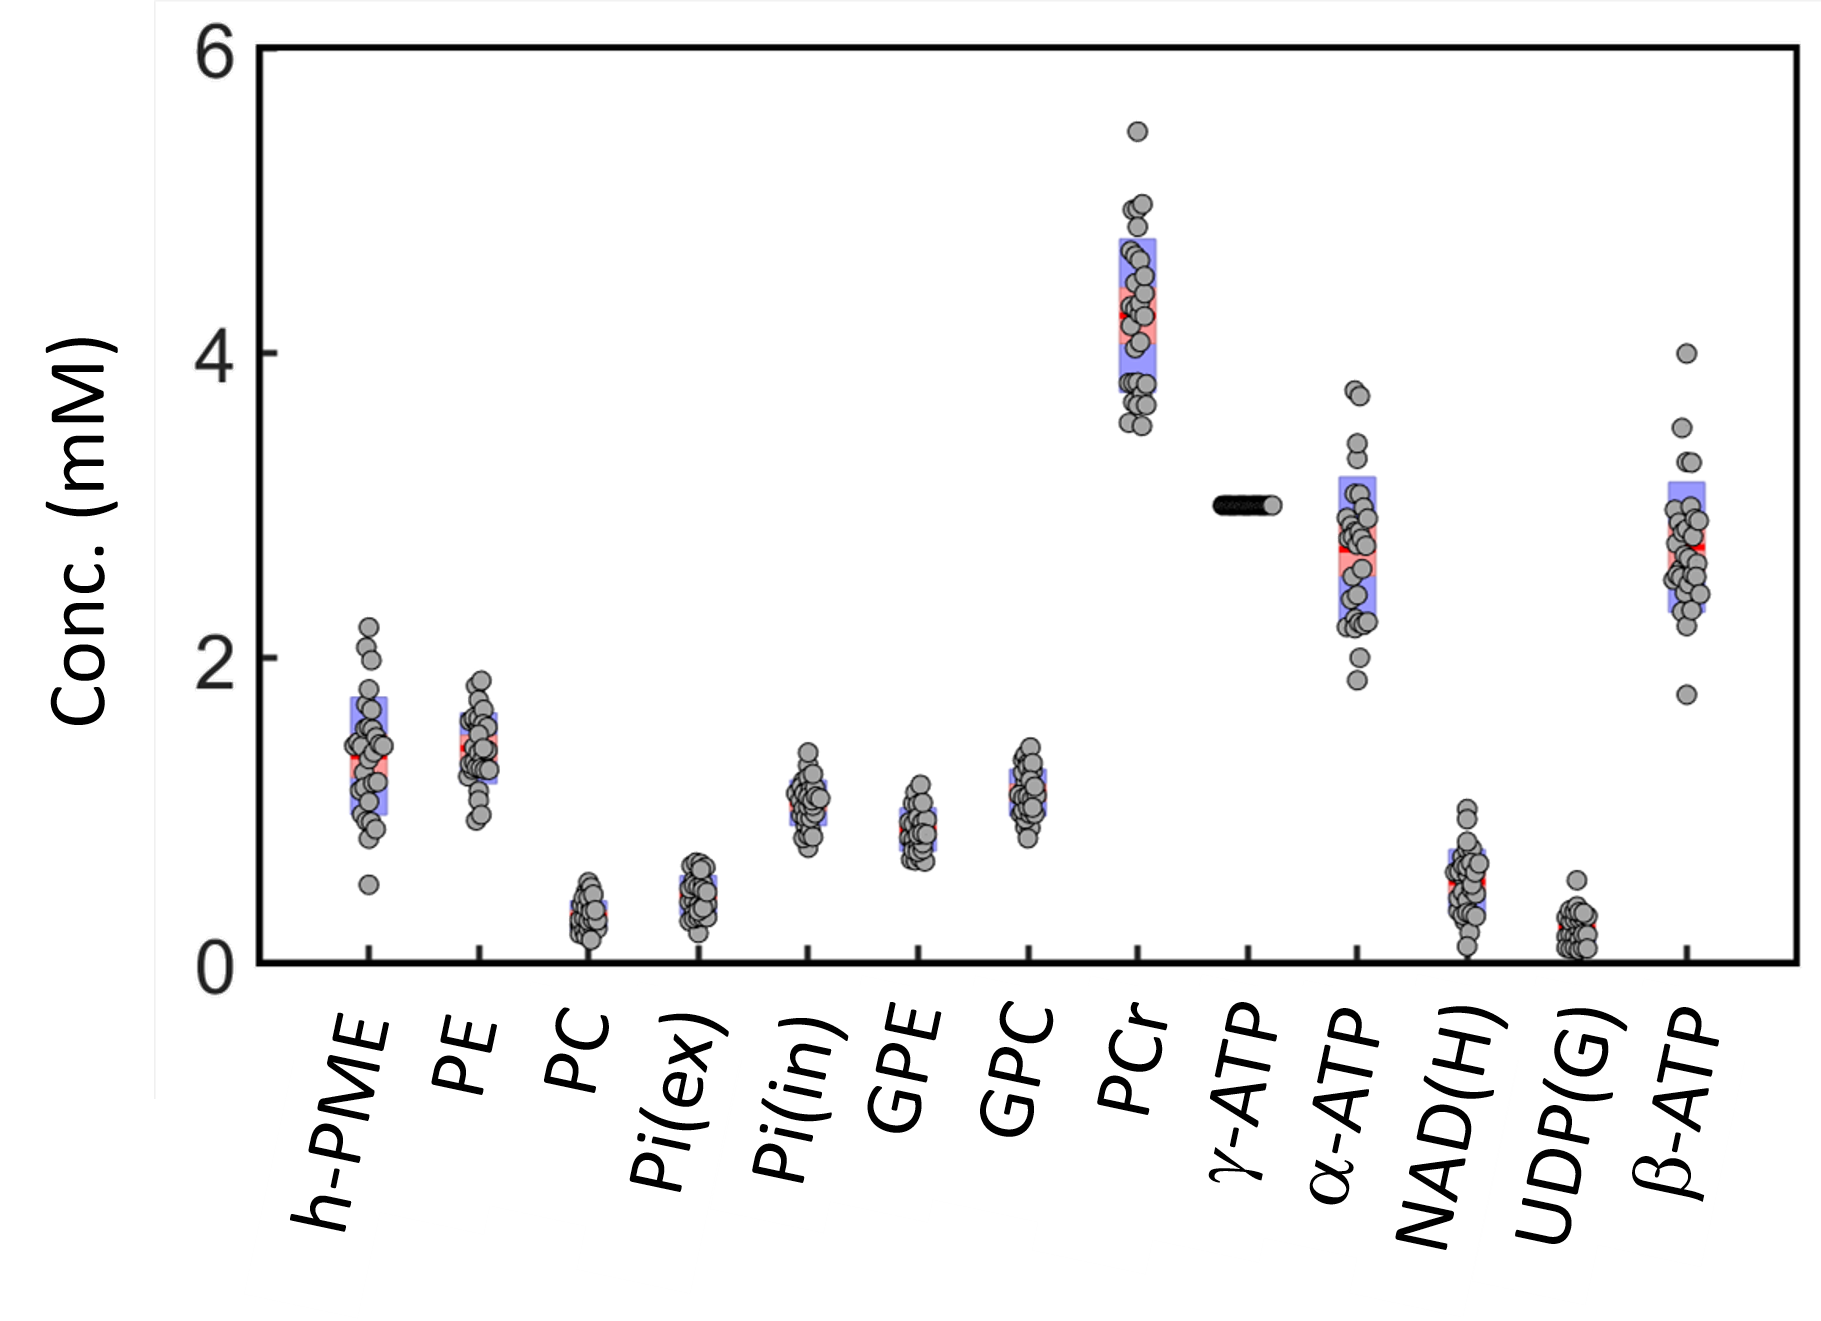
The IR 31P spectrum acquired at TI = 5.8 s clearly reveals a broad hump in PME region upon nulling of the PE and PC signals, whereas this hump, hidden in the baseline under PE and PC signals in the reference spectrum acquired without inversion, is not readily appreciable (Figure 1). The selective detection of h-PME is achieved due to the large difference in T1 between h-PME and the overriding PE and PC signals, as demonstrated in Figures 2 and 3. The h-PME signal is asymmetric, characterized by a short T1 of 2.2 s, by its magnitude at 6.5 ppm (between PE and PC). An integral analysis also reveals a long T1 (7.2 s) component, in addition to a short one (1.4 s). In comparison, the T1s of other phospholipid (PL) metabolites fall in the range of 7.0 – 8.5 s. A short T1 of 3.9 ± 0.4 s is found for the intracellular Pi. Data analysis for a group of healthy subjects (N = 16 subjects for 28 scans, Figures 4 and 5) shows that the combined concentration of PE and PC is 1.72 ± 0.29 mM, as compared to 3.07 ± 0.45 mM without h-PME correction. The h-PME signals are averaged 43.6 ± 8.8 % of total PME. Furthermore, it is found that the long-T1 h-PME component in the downfield portion of h-PME signals can be suppressed by OVS, whereas the short-T1 h-PME component is insensitive to OVS. Localized 2D and 3D MRSI data also reveal a heterogeneity in h-PME spatial distribution with h-PME more dispersed and abundant in grey-matter than in white matter tissues (data not shown). The short-T1 h-PME signals are tentatively assigned to brain blood 2,3-DPG, which is known to be abundantly present in RBCs (~ 5 mM). The chemical shift dispersion of h-PME may reflect variations in local blood pH, oxygenation level and magnetic susceptibility of anisotropic blood vessels, though other sources of signal contribution cannot be fully ruled out. Further studies are needed to test the applicability of h-PME as a biomarker of metabolic diseases.CONCLUSION
This study demonstrated the selective detection of h-PME with characterization of its T1 property. The results have implication in data analysis of PE and PC signals in brain pathologies.Acknowledgements
The author is grateful for helpful discussion with Drs. A. Dean Sherry, Craig Malloy and Anke Henning, 7T operational assistance from Corey Mozingo and Pena Sal, and technical support from Dr. Ivan Dimitrov (Philips Healthcare).References
1. Deelchand DK, Nguyen TM, Zhu XH, Mochel F, Henry PG. Quantification of in vivo ³¹P NMR brain spectra using LCModel. NMR Biomed. 2015;28(6):633-41.
2. Li S, van der Veen JW, An L, Stolinski J, Johnson C, Ferraris-Araneta M, Victorino M, Tomar JS, Shen J. Cerebral phosphoester signals measured by 31P magnetic resonance spectroscopy at 3 and 7 Tesla. PLoS One. 2021;16(3):e0248632.
3. Dorst J, Tamas Borbath T, Ruhm L, Anke Henning A. 31P Transversal Relaxation Times and Metabolite Concentrations in the Human Brain at 9.4T. NMR Biomed. 2022. DOI: 10.1002/nbm.4776.
4. Dorst J, Ruhm L, Avdievich N, Bogner W, Henning A. Comparison of four 31P single-voxel MRS sequences in the human brain at 9.4 T. Magn Reson Med. 2021;85(6):3010-3026.
5. Ren J, Shang T, Sherry AD, Malloy CR. Unveiling a hidden 31 P signal corresponding with extracellular inorganic phosphate by outer-volume-suppression and localized 31 P MRS in the human brain at 7T. Magn Reson Med. 2018;80(4):1289-1297.
6. Ren J, Yu F, Greenberg BM. ATP line splitting in association with reduced intracellular magnesium and pH: a brain 31 P MR spectroscopic imaging (MRSI) study of pediatric patients with myelin oligodendrocyte glycoprotein antibody-associated disorders (MOGADs). NMR Biomed. 2022;e4836.
7. Potwarka JJ, Drost DJ, Williamson PC. Quantifying 1H decoupled in vivo 31P brain spectra. NMR Biomed. 1999;12(1):8-14.
8. Jensen JE, Drost DJ, Menon RS, Williamson PC. In vivo brain (31)P-MRS: measuring the phospholipid resonances at 4 Tesla from small voxels. NMR Biomed. 2002;15(5):338-47.
9. Korzowski A, Weckesser N, Franke VL, Breitling J, Goerke S, Schlemmer HP, Ladd ME, Bachert P, Paech D. Mapping an Extended Metabolic Profile of Gliomas Using High-Resolution 31P MRSI at 7T. Front Neurol. 2021;12:735071.
Figures