3439
In vivo Whole-brain Phosphoethanolamine Mapping using SLOW-EPSI at 7T1Support Center for Advanced Neuroimaging (SCAN), University of Bern, Bern, Switzerland, 2Translational Imaging Center, sitem-insel, Bern, Switzerland
Synopsis
Keywords: Visualization, Spectroscopy, Spectral editing
In vivo detection of phosphoethanolamine (PE) using spectral editing has recently been shown to be feasible. This study shows whole-brain PE maps using SLOW-EPSI in a healthy subject with a nominal resolution of 4.3*4.3*10 mm. The result shows that the PE level is high in the cerebral cortex and low in the white matter.INTRODUCTION
Phosphorylethanolamine, also known as phosphoethanolamine (PE) is a compound used to construct two different groups of phospholipids namely glycerophospholipid and sphingophospholipid. As such this substance plays a central role in health as well as in pathologic tissues of the human body and has been studied since the beginning of the 1970s. Early studies reported decreased levels of PE in Alzheimer’s (AD) and Huntington’s disease (HD) [1] and changes were reported in most types of tumours [2]. Since PE contains 31P, it has been most often studied by in vivo 31P MRS(I). (e.g., [3]). Recently Hui et al. showed that PE can also be measured by MEGA-edited 1H-MRS [4], and also at UHF using SLOW-editing [5]. The advantage of the last method is that high spatially resolved 3D PE maps can be obtained. Due to the excellent implicit lipid and water suppression of SLOW-editing pulses, simple peak integration can be used to generate metabolic maps even of low-concentration metabolites like PE. The aim of the study was to investigate the feasibility of 3D whole brain PE-mapping.METHODS
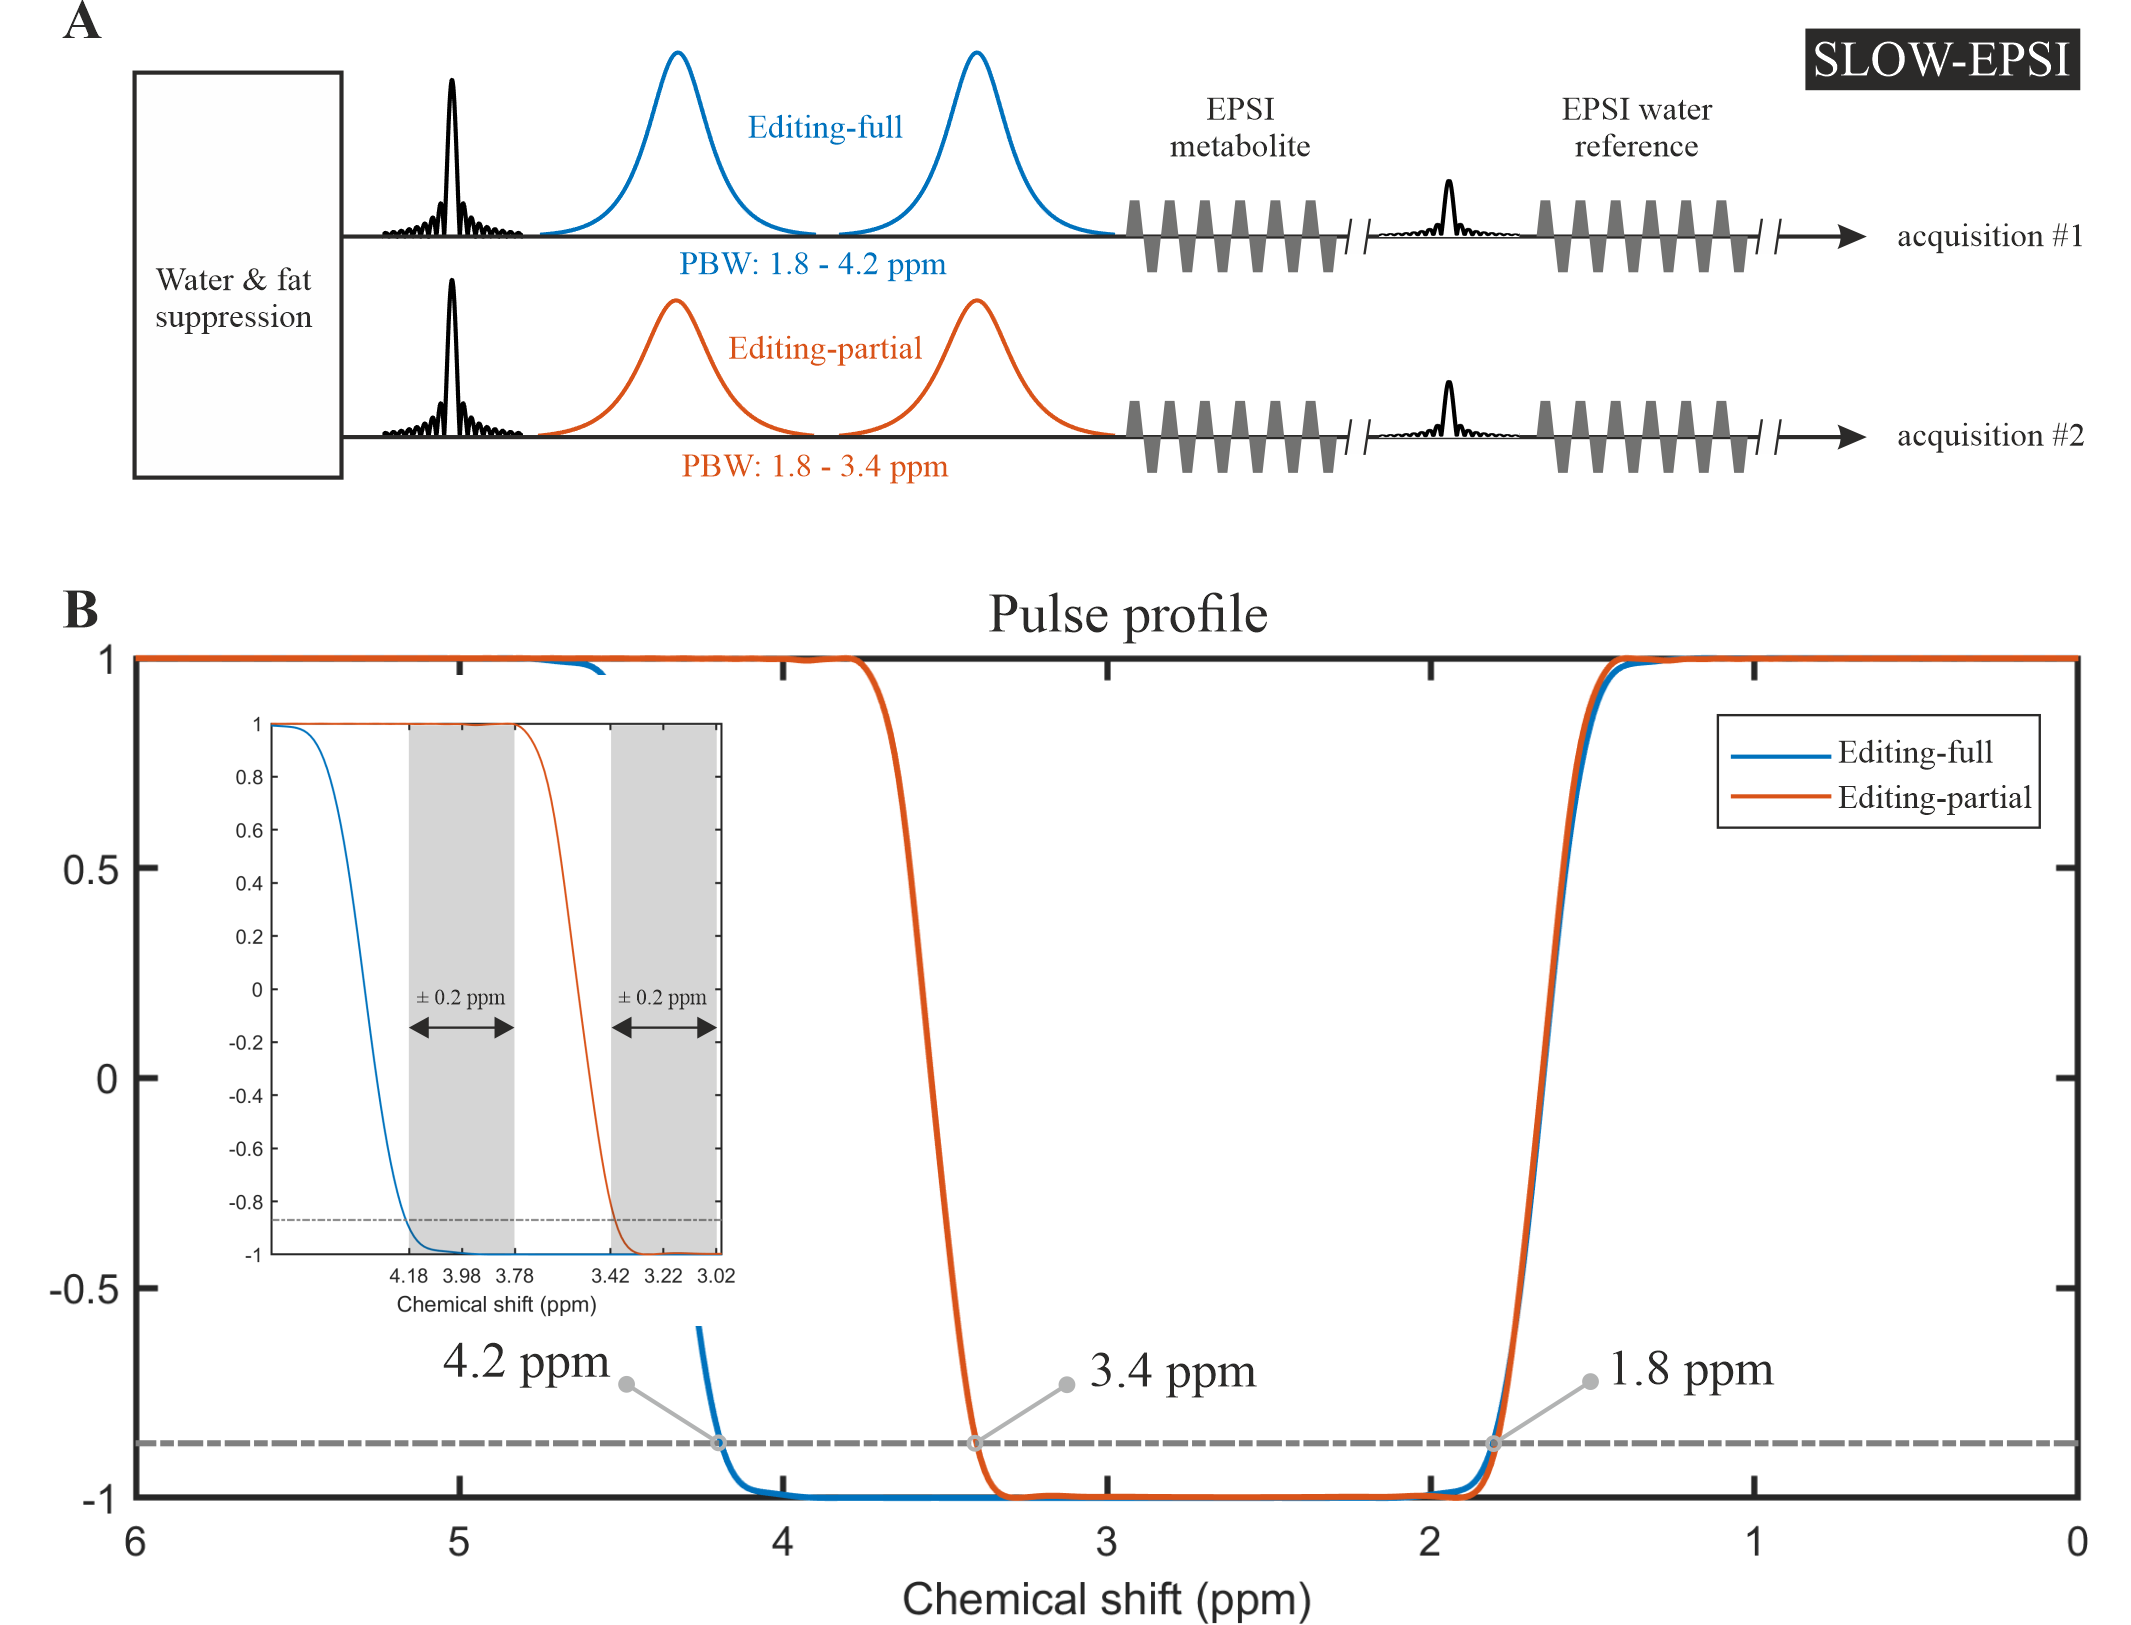
The MRSI was performed on a Siemens 7T scanner (MAGNETOM Terra, Germany) using the Nova 1Tx 32Rx head coil.The SLOW-EPSI sequence [5], [6] (Figure 1) was applied to detect PE at 3.22 ppm with the following parameters:
TE = 90 ms, TR = 1500 ms, nominal matrix = 65 × 42 × 7 (4.3 × 4.3 × 10 mm), zero filling matrix = 65 × 42 × 8 (4.3 × 4.3 × 8.8 mm), FOV = 280 × 180 × 70 mm, averages = 4, and TA = 50 min. The refocusing/editing chemical-selective adiabatic pulse (CSAP) for SLOW-editing is 35 ms duration. The bandwidth (full width at 87% maximum) of editing-full and editing-partial ranges from 1.8 – 4.2 ppm and 1.8 – 3.4 ppm, respectively (Figure 1B). The editing result was obtained by the subtraction of editing-full (acquisition #1) and editing-partial (acquisition #2). In SLOW-editing, the 2π- CSAP acts at the same time as both a refocusing and an editing pulse.
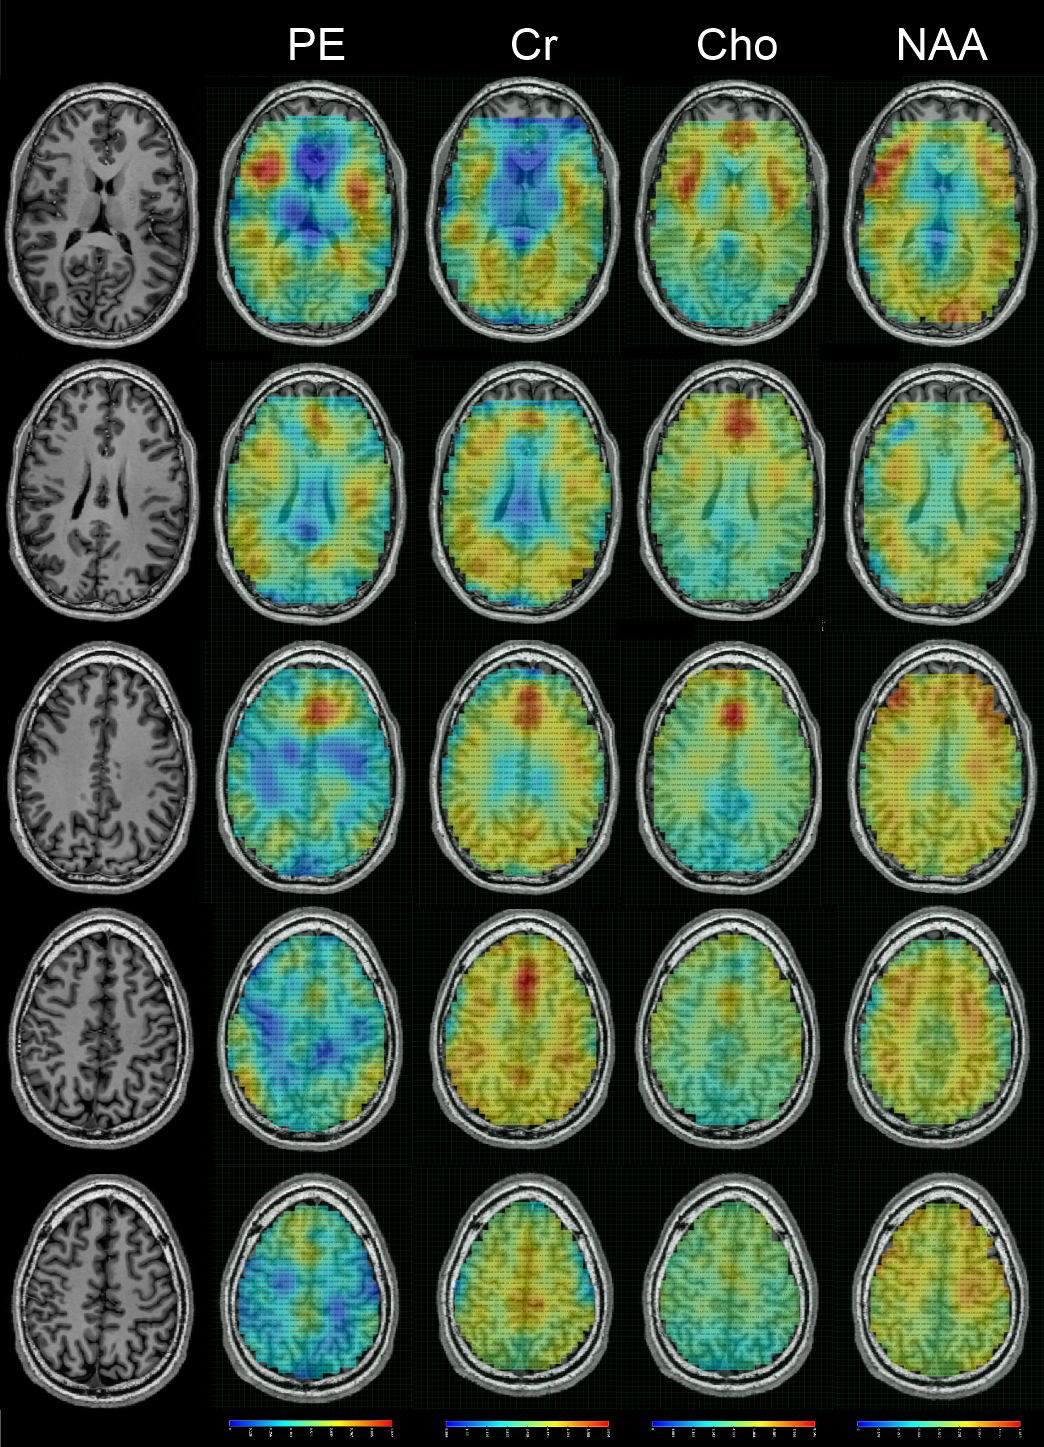
The PE (3.22 ppm), Cr (3.0 ppm), Cho (3.2 ppm) and NAA (2.01 ppm) maps were generated by integration of the absorption channel only. The metabolites signal was divided by water reference signal to correct B1+-inhomogeneities due to non-adiabatic excitation pulse and B1--inhomogeneities due to received coils. The baseline was corrected by spline interpolation using an in-house developed MATLAB (R2019b) program.
RESULTS and DISCUSSION
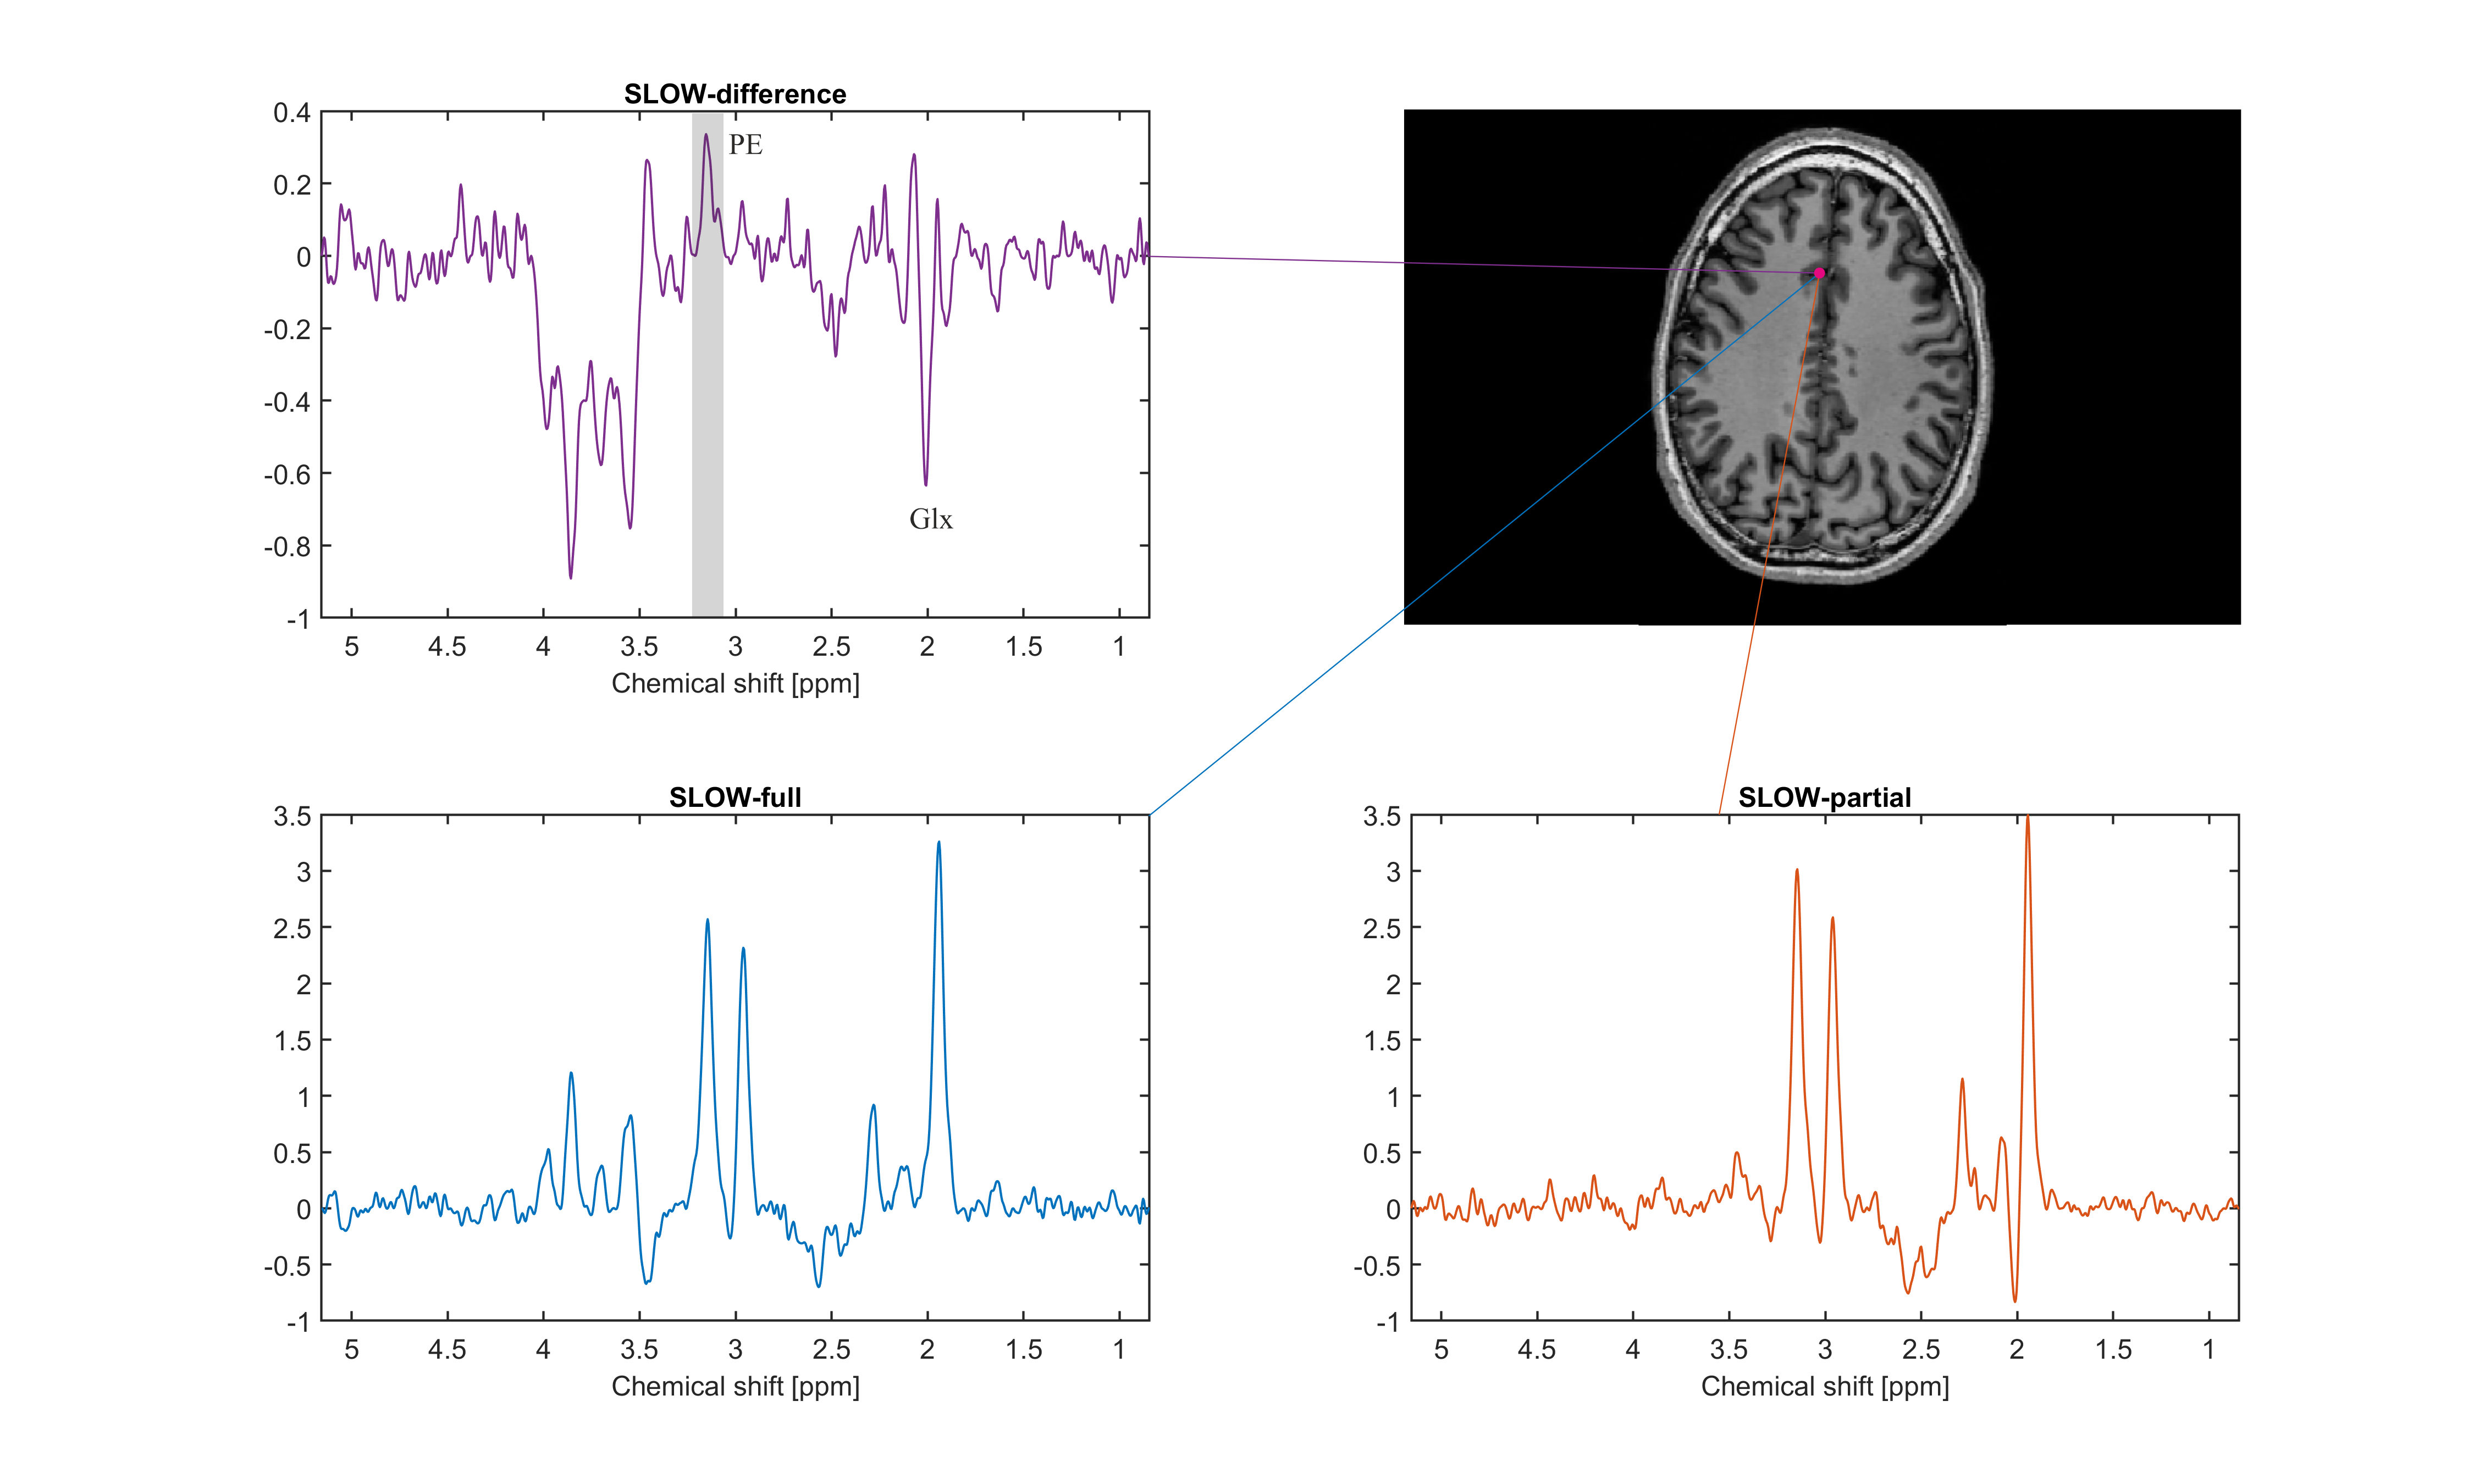
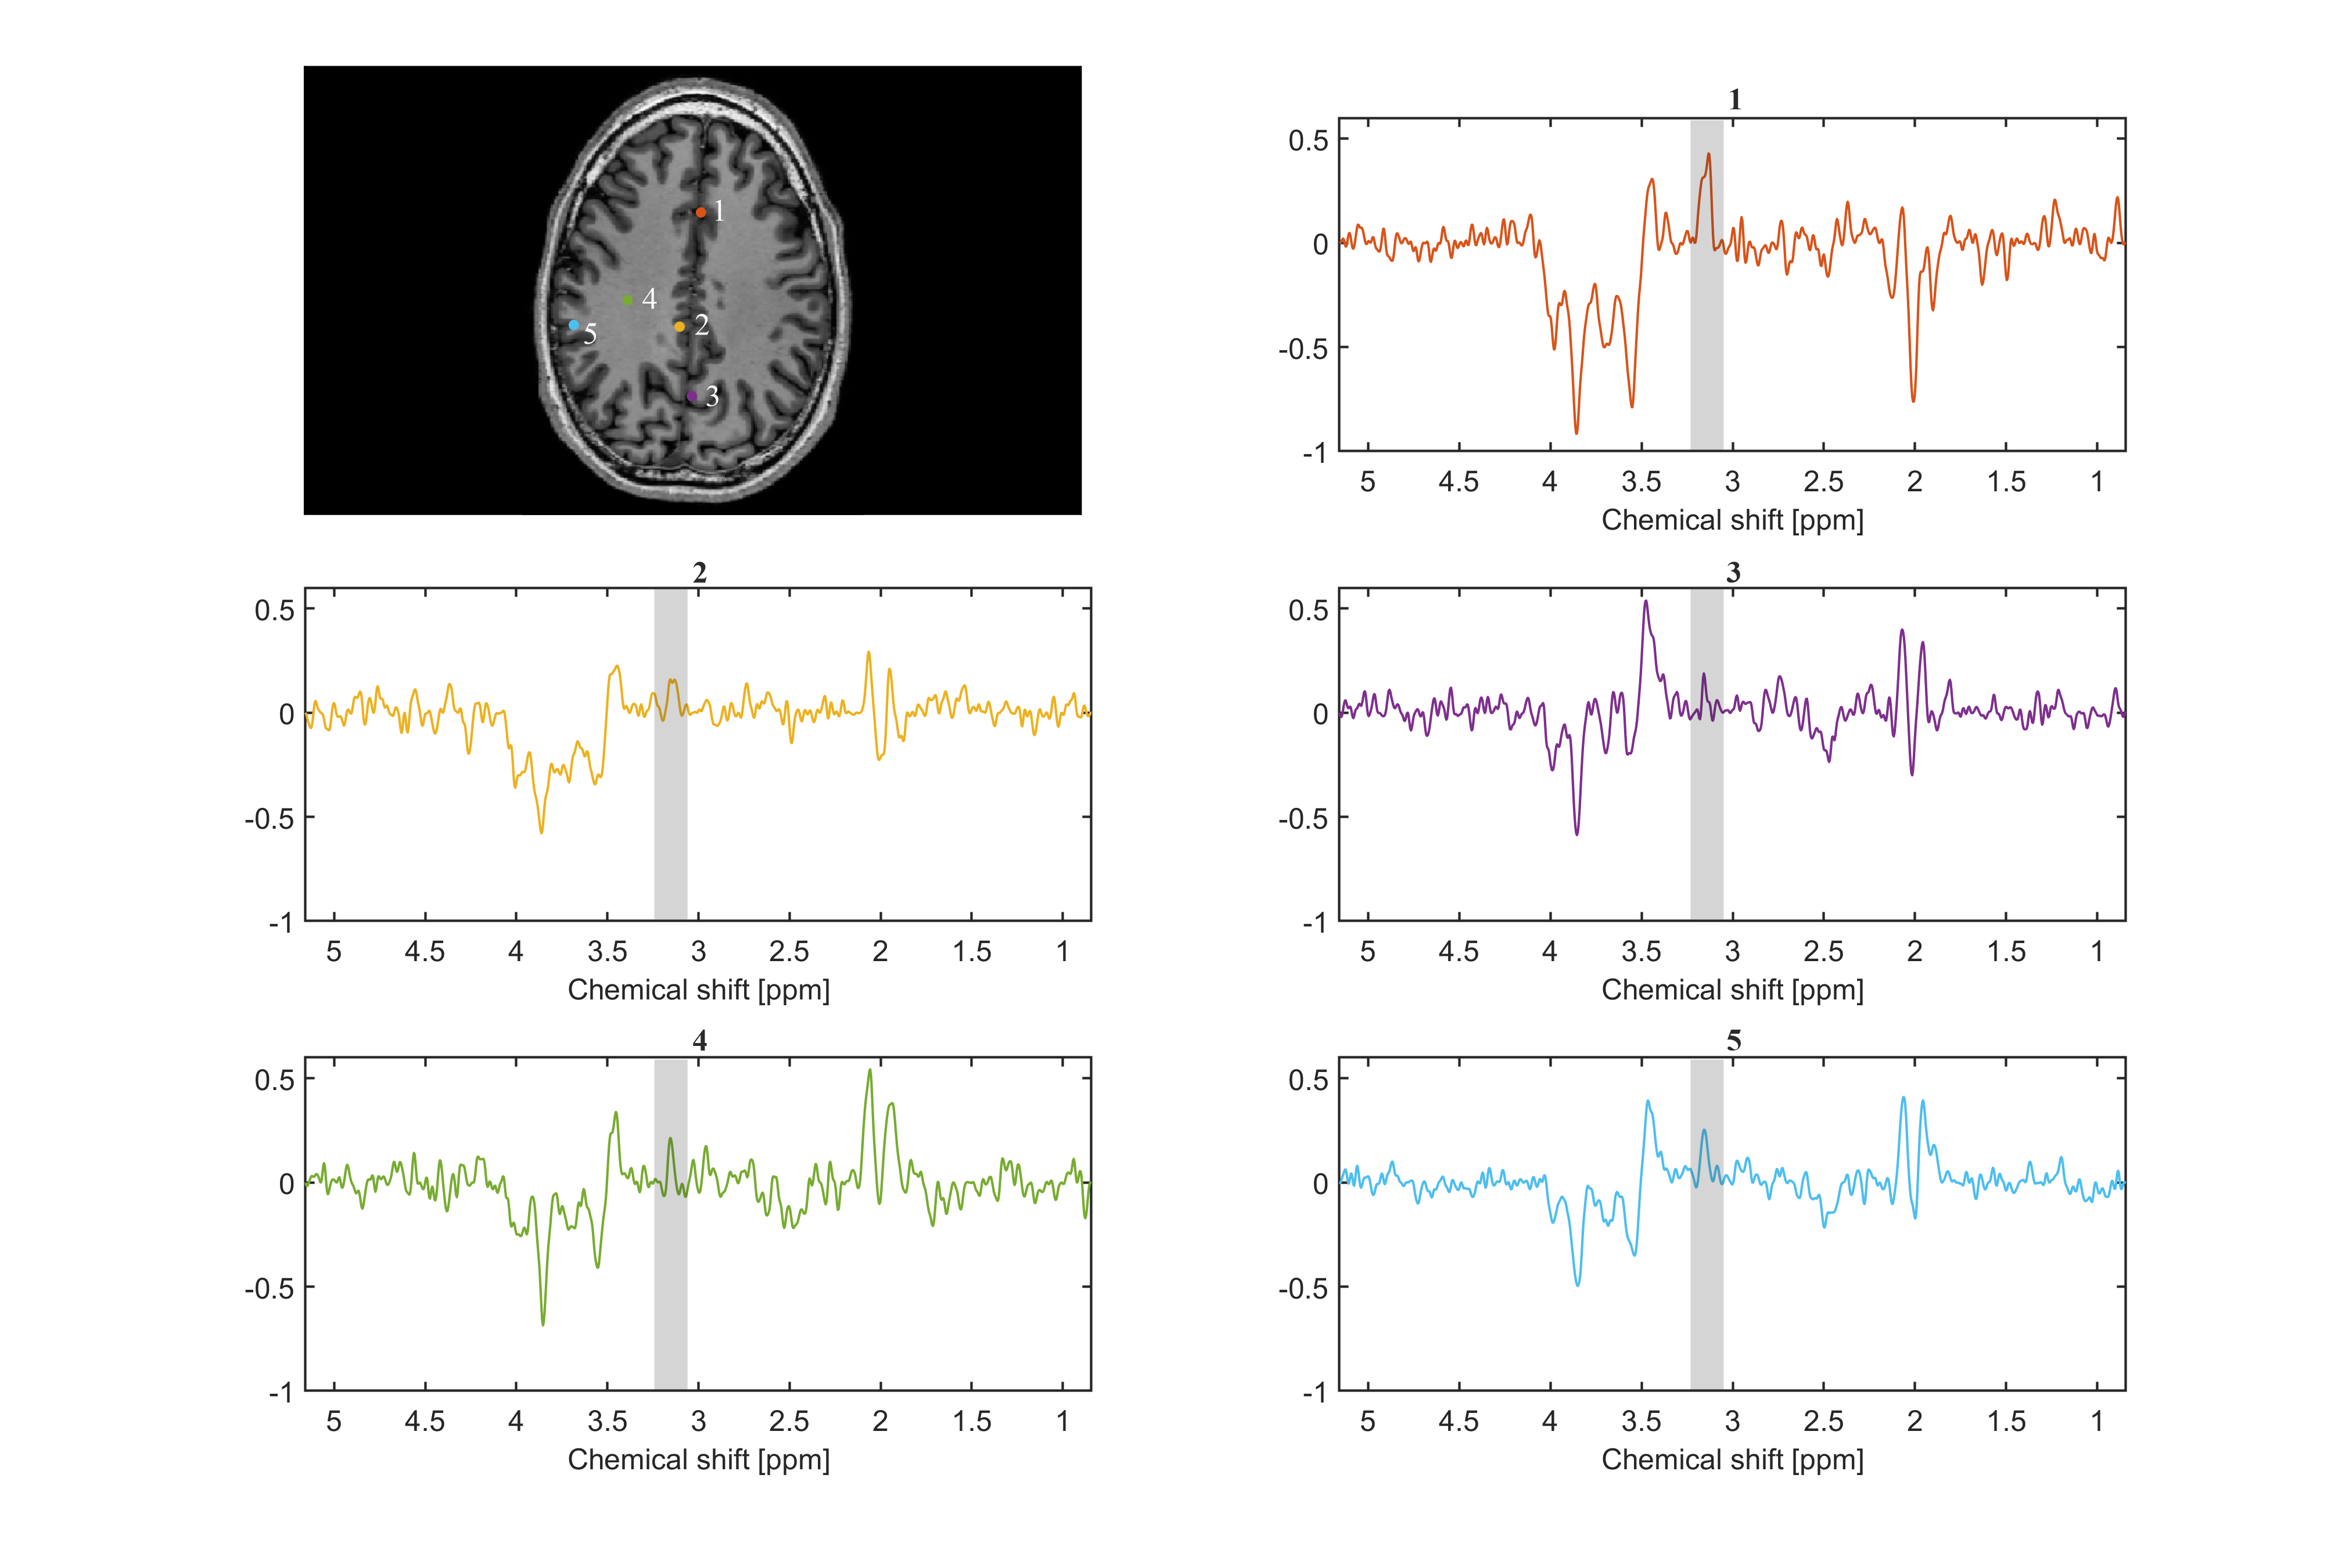
To illustrate one typical case (male, 31 years old), from 13 healthy persons examined, Figure 2 shows the spectra (SLOW-difference, SLOW-full, and SLOW-partial) of only one voxel (4.3 × 4.3 × 8.8 mm), and the PE at 3.22 ppm was clearly present. The editing difference spectra of five different locations are illustrated in Figure 3. The signal intensity of PE is highest at location 1 compared to other locations.The peak integration maps of PE (3.22 ppm), Cr (3.0 ppm), Cho (3.2 ppm) and NAA (2.01 ppm) are shown on Figure 4. The result shows that the PE levels are high in the cerebral cortex and low in the white matter being in line with the literature [7]. The Cr is similarly higher in grey matter and the Cho is relatively higher in white matter, also consistent with the literature [8]. The current measurement time is relatively long, but can be reduced by the application of parallel imaging techniques and denoising.
CONCLUSION
Our work suggests that in vivo 1H-MRSI-based whole brain PE-mapping in humans is feasible. However for widespread clinical application in AD and brain tumors, the sequence must be further optimized with regard to total acquisition time, and denoising of the data should also be taken into consideration.Acknowledgements
The research is supported by the Swiss National Science Foundation (SNSF-182569).References
[1] D. W. Ellison, M. F. Beal, and J. B. Martin, “Phosphoethanolamine and ethanolamine are decreased in Alzheimer’s disease and Huntington’s disease,” Brain Res, vol. 417, no. 2, pp. 389–392, Aug. 1987, doi: 10.1016/0006-8993(87)90471-9.
[2] P. F. Daly, R. C. Lyon, P. J. Faustino, and J. S. Cohen, “Phospholipid metabolism in cancer cells monitored by 31P NMR spectroscopy.,” Journal of Biological Chemistry, vol. 262, no. 31, pp. 14875–14878, Nov. 1987, doi: 10.1016/S0021-9258(18)48107-0.
[3] J. Ren, “31P-MRS of healthy human brain: revealing the hidden PME signals under phosphoethanolamine and phosphocholine resonances at 7T,” medRxiv, p. 2022.06.19.22276613, Jun. 2022, doi: 10.1101/2022.06.19.22276613.
[4] S. C. N. Hui, H. J. Zöllner, G. Oeltzschner, R. A. E. Edden, and M. G. Saleh, “In vivo spectral editing of phosphorylethanolamine,” Magn Reson Med, Aug. 2021, doi: 10.1002/mrm.28976.
[5] G. Weng et al., “SLOW: A novel spectral editing method for whole‐brain MRSI at ultra high magnetic field,” Magn Reson Med, vol. 88, no. 1, pp. 53–70, Jul. 2022, doi: 10.1002/mrm.29220.
[6] A. Ebel and A. A. Maudsley, “Improved spectral quality for 3D MR spectroscopic imaging using a high spatial resolution acquisition strategy,” Magn Reson Imaging, vol. 21, no. 2, pp. 113–120, 2003, doi: 10.1016/S0730-725X(02)00645-8.
[7] T. L. Perry, K. Berry, S. Hansen, S. Diamond, and C. Mok, “Regional distribution of amino acids in human brain obtained at autopsy,” J Neurochem, vol. 18, no. 3, pp. 513–519, 1971, doi: 10.1111/J.1471-4159.1971.TB11979.X.
[8] A. Klauser, P. Klauser, F. Grouiller, S. Courvoisier, and F. Lazeyras, “Whole-brain high-resolution metabolite mapping with 3D compressed-sensing SENSE low-rank 1H FID-MRSI,” NMR Biomed, vol. 35, no. 1, p. e4615, Jan. 2022, doi: 10.1002/NBM.4615.
[9] J. Slotboom et al., “Proton Resonance Spectroscopy Study of the Effects of L-Ornithine-L-Aspartate on the Development of Encephalopathy, Using Localization Pulses with Reduced Specific Absorption Rate,” J Magn Reson B, vol. 105, no. 2, Oct. 1994, doi: 10.1006/jmrb.1994.1114.
[10] J. Slotboom, A. Nirkko, C. Brekenfeld, and D. van Ormondt, “Reliability testing of in vivo magnetic resonance spectroscopy (MRS) signals and signal artifact reduction by order statistic filtering,” Meas Sci Technol, vol. 20, no. 10, p. 104030, Sep. 2009, doi: 10.1088/0957-0233/20/10/104030.
Figures